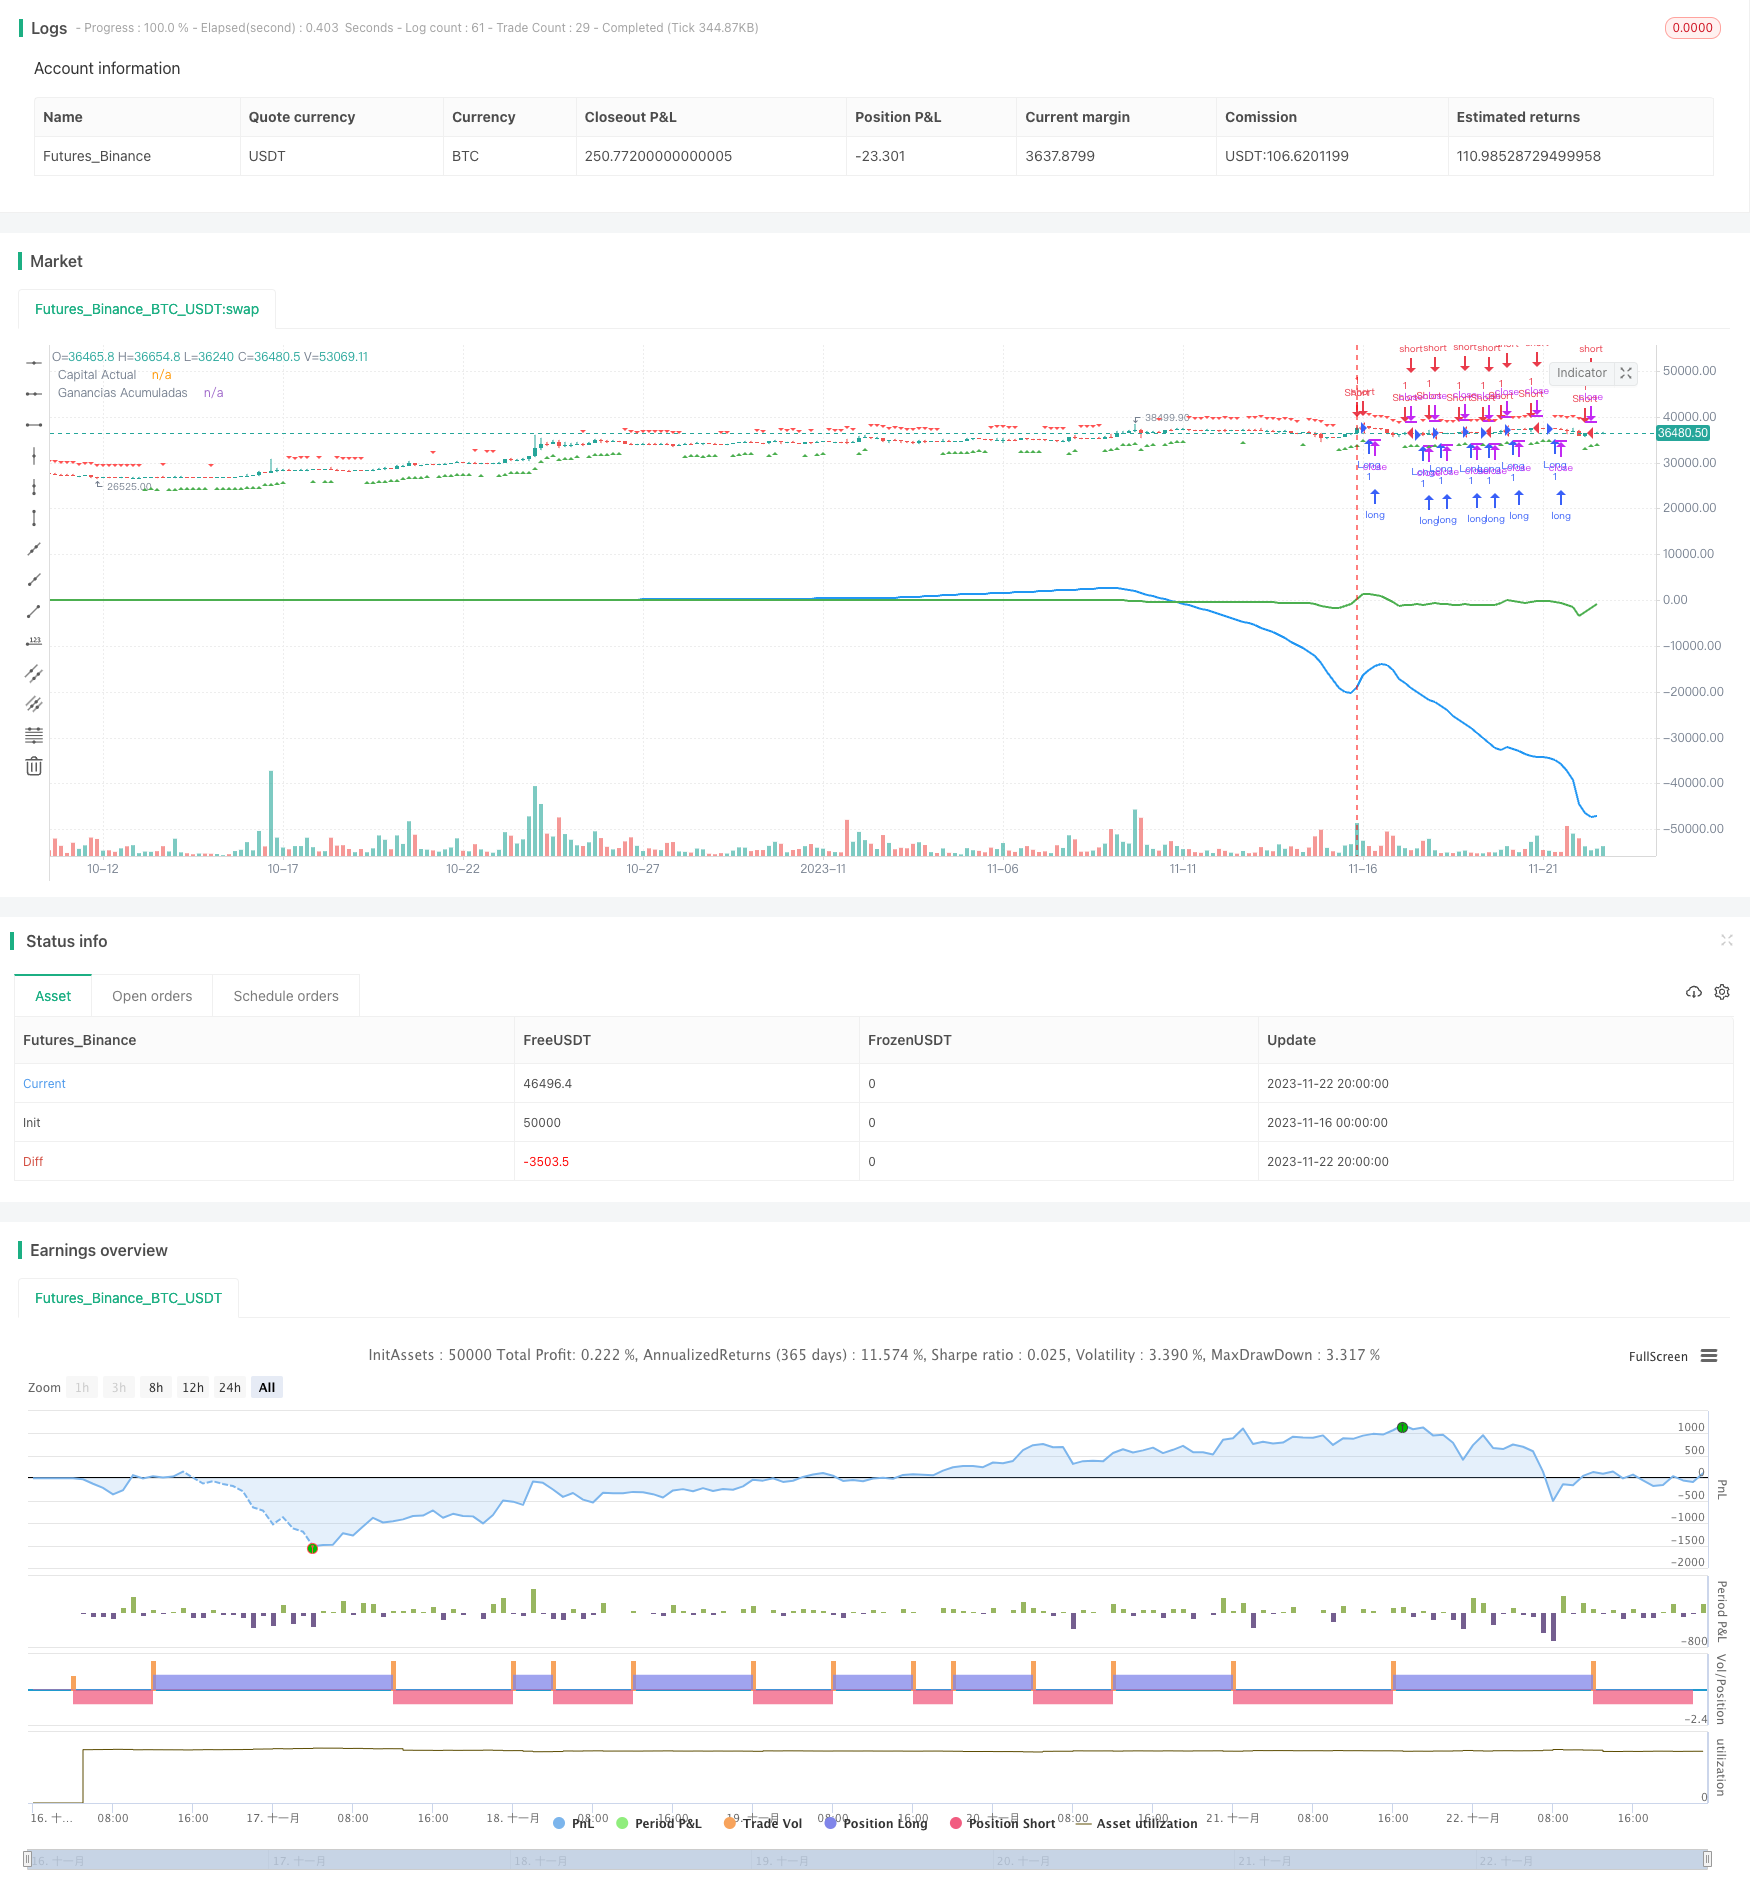
逆のラスベガスアルゴリズム取引戦略
作者: リン・ハーンチャオチャン,日付: 2023-11-24 15:19:03タグ:

概要
この戦略の名称は"逆ラスベガスアルゴリズム取引戦略"である.基本考えは,価格が上昇するとショート,価格が下がるとロングに行くラスベガスアルゴリズムを使用することです.これは元のアルゴリズムの反対であり,逆の運用戦略を形成します.
戦略原則
この戦略の主な論理は,現在の価格と前のサイクルの価格を計算することです.現在の価格が前の価格よりも大きいとき,ショート信号が起動します.現在の価格が前の価格よりも低いとき,ロング信号が起動します.ポジションサイズは,累積された総利益に基づいて計算されます.各取引が終了した後,利益は次の操作のための資金に蓄積され,再投資を形成します.
具体的には,戦略は,current_priceとprevious_price変数を通して前回のサイクルの現在の価格と閉じる価格を記録する.その後,long_conditionとshort_condition判断条件が定義される.current_priceがprevious_priceよりも大きいとき,long_conditionが起動する.current_priceがprevious_priceよりも小さいとき,short_conditionが起動する.条件が起動すると,capital_actual変数に基づいてポジションサイズposition_sizeを決定する.短または長い取引を実行した後,この取引の利益と損失をganancias変数を通じて記録し,ganancias_acumuladasに蓄積する.最後に,利益を次の取引資本に再投資する: capital_actual=actual_actual + ganancias_acumuladas.
利点分析
この戦略の最大の利点は,逆操作のアイデアを使用することです.市場でシステム的なエラーが発生すると,利益の可能性は非常に大きくなります.また,再投資メカニズムは利益も増幅します.幸運によって連続した収益性の高い取引を得れば,資金は再投資によって急速に蓄積することができます.
具体的には,主な利点は以下の通りです.
-
市場判断のシステム上の誤りを利用して 巨大な利益を得る可能性があります
-
利益再投資メカニズムは 利益を増大させ 運が良ければ 資金が急速に増加します
-
戦略の論理はシンプルで 分かりやすく 追跡も容易です
-
パラメータは異なる取引結果に合わせて調整できます.
リスク分析
この戦略の最大のリスクは,逆操作の特徴にあります.誤った市場判断を主張すると,大きな損失に直面します. さらに,レバレッジ効果は再投資メカニズムを通じて損失を拡大します.
特定のリスクポイントは以下のとおりです.
-
市場の動向判断が間違っている場合,閉店からの損失は増幅されます.
-
利息付き取引のリスクは高すぎるし,単一の取引による損失は本金を超えることがあります.
-
追いかけるのは高さ 殺すのは低さ 過剰な取引は損失を増やします
-
パラメータの設定が正しくない場合も,意外に大きな損失を引き起こす可能性があります.
対応する解決策は以下のとおりです.
-
リスク管理,ストップ・ロスの出口,バッチでポジションを開く
-
利息を慎重に使って 単一の取引の損失をコントロールする
-
過剰な取引を防ぐために心理的規制を強化する.
-
実行前にパラメータをテストする.
最適化 の 提案
この戦略の最適化空間は主に利益再投資メカニズムとパラメータ調整に集中している.
利益再投資メカニズムは,単一の損失の影響を制御するために,完全な再投資ではなく再投資比を設定することができます.
パラメータ調整は,最適なパラメータ組み合わせを見つけるために,異なるサイクル長さとシフトサイズを試すことができます.
さらに,損失を制御するためにストップ損失メカニズムを組み込むことが推奨されます. 特定の最適化提案は以下のとおりです.
-
過剰な損失を防ぐために再投資比率を設定します
-
適正なパラメータを見つけるために 異なるサイクルパラメータをテストする.
-
ストップ損失ロジックを追加します.最初は固定ストップ損失を設定し,後にATRに基づいて動的ストップ損失を追加することができます.
-
取引頻度を制御するために,時間または技術指標に基づく開閉条件と閉じる条件を追加することを検討する.
結論
この戦略の名称は"逆ラスベガスアルゴリズム取引戦略"です.逆操作のアイデアを組み合わせて,利益再投資メカニズムによって,市場が誤ったときに利益を得ようとします.この戦略は高い利益の可能性の利点がありますが,大きなリスクにも直面しています.我々はリスクを詳細に分析し,最適化提案をしました.一般的に,適切な管理により,戦略は特定の条件下で利益を得ることができますが,慎重に扱わなければなりません.
/*backtest
start: 2023-11-16 00:00:00
end: 2023-11-23 00:00:00
period: 4h
basePeriod: 15m
exchanges: [{"eid":"Futures_Binance","currency":"BTC_USDT"}]
*/

//@version=4
strategy("Estrategia Las Vegas Long/Short Invertida con Reinversión de Ganancias", shorttitle="Las Vegas LS-Invertida-Reinversion", overlay=true)

// Parámetros
length = input(14, title="Longitud de comparación")
offset = input(1, title="Desplazamiento")

// Capital inicial
capital_inicial = input(100, title="Capital Inicial")

// Variables para el seguimiento de las ganancias
var float capital_actual = capital_inicial
var float ganancias_acumuladas = 0.0

// Calcular el precio actual y el precio anterior
current_price = close
previous_price = security(syminfo.tickerid, "D", close[1])

// Lógica de la estrategia invertida
long_condition = current_price > previous_price
short_condition = current_price < previous_price

// Calcular el tamaño de la posición en función de las ganancias acumuladas y reinvertir
if (long_condition or short_condition)
    position_size = capital_actual / current_price
    ganancias = position_size * (previous_price - current_price)  // Invertir la dirección
    capital_actual := capital_actual + ganancias
    ganancias_acumuladas := ganancias_acumuladas + ganancias

// Reinvertir las ganancias en la próxima orden
position_size_reinvested = capital_actual / current_price

// Sumar las ganancias de los trades al monto de operación
if (long_condition or short_condition)
    capital_actual := capital_actual + ganancias_acumuladas

// Colocar una orden SHORT (venta) cuando se cumpla la condición Long invertida
strategy.entry("Short", strategy.short, when=long_condition)
// Colocar una orden LONG (compra) cuando se cumpla la condición Short invertida
strategy.entry("Long", strategy.long, when=short_condition)

// Etiquetas para mostrar las condiciones en el gráfico
plotshape(series=long_condition, title="Condición LONG", location=location.belowbar, color=color.green, style=shape.triangleup, size=size.small)
plotshape(series=short_condition, title="Condición SHORT", location=location.abovebar, color=color.red, style=shape.triangledown, size=size.small)

// Mostrar el capital actual y las ganancias acumuladas en el gráfico
plot(capital_actual, title="Capital Actual", color=color.blue, linewidth=2)
plot(ganancias_acumuladas, title="Ganancias Acumuladas", color=color.green, linewidth=2)
- 2つの移動平均のクロスオーバー逆転戦略
- 動的移動平均を追跡する戦略
- 逆転捕獲戦略
- RSIギャップの逆転戦略
- 3分間の短い専門家アドバイザー戦略
- アクションゾーン ATR リバースオーダー 量子戦略
- MACD トレンド 戦略をフォローする
- モメント分析 イチモク 雲霧 雷 取引戦略
- EMA に基づく信号商取引戦略
- Bollinger Bands をベースにした二重移動平均マッチング戦略
- 固い移動平均システム戦略
- 先進的なボリンジャー帯移動平均グリッドトレンド追跡戦略
- イチモク・キンコ・ヒョー指標 バランストレンド戦略
- ボリューム価格指標 バランスのとれた取引戦略
- 歪んだ SMA 適応型クロスオーバー ロングライン戦略
- 2つの移動平均の仲裁戦略
- 月間購入日に基づく定量投資戦略
- 標準偏差を考慮した取引戦略
- トリプル・ムービング・平均量的な取引戦略
- EMAのクロスオーバー戦略