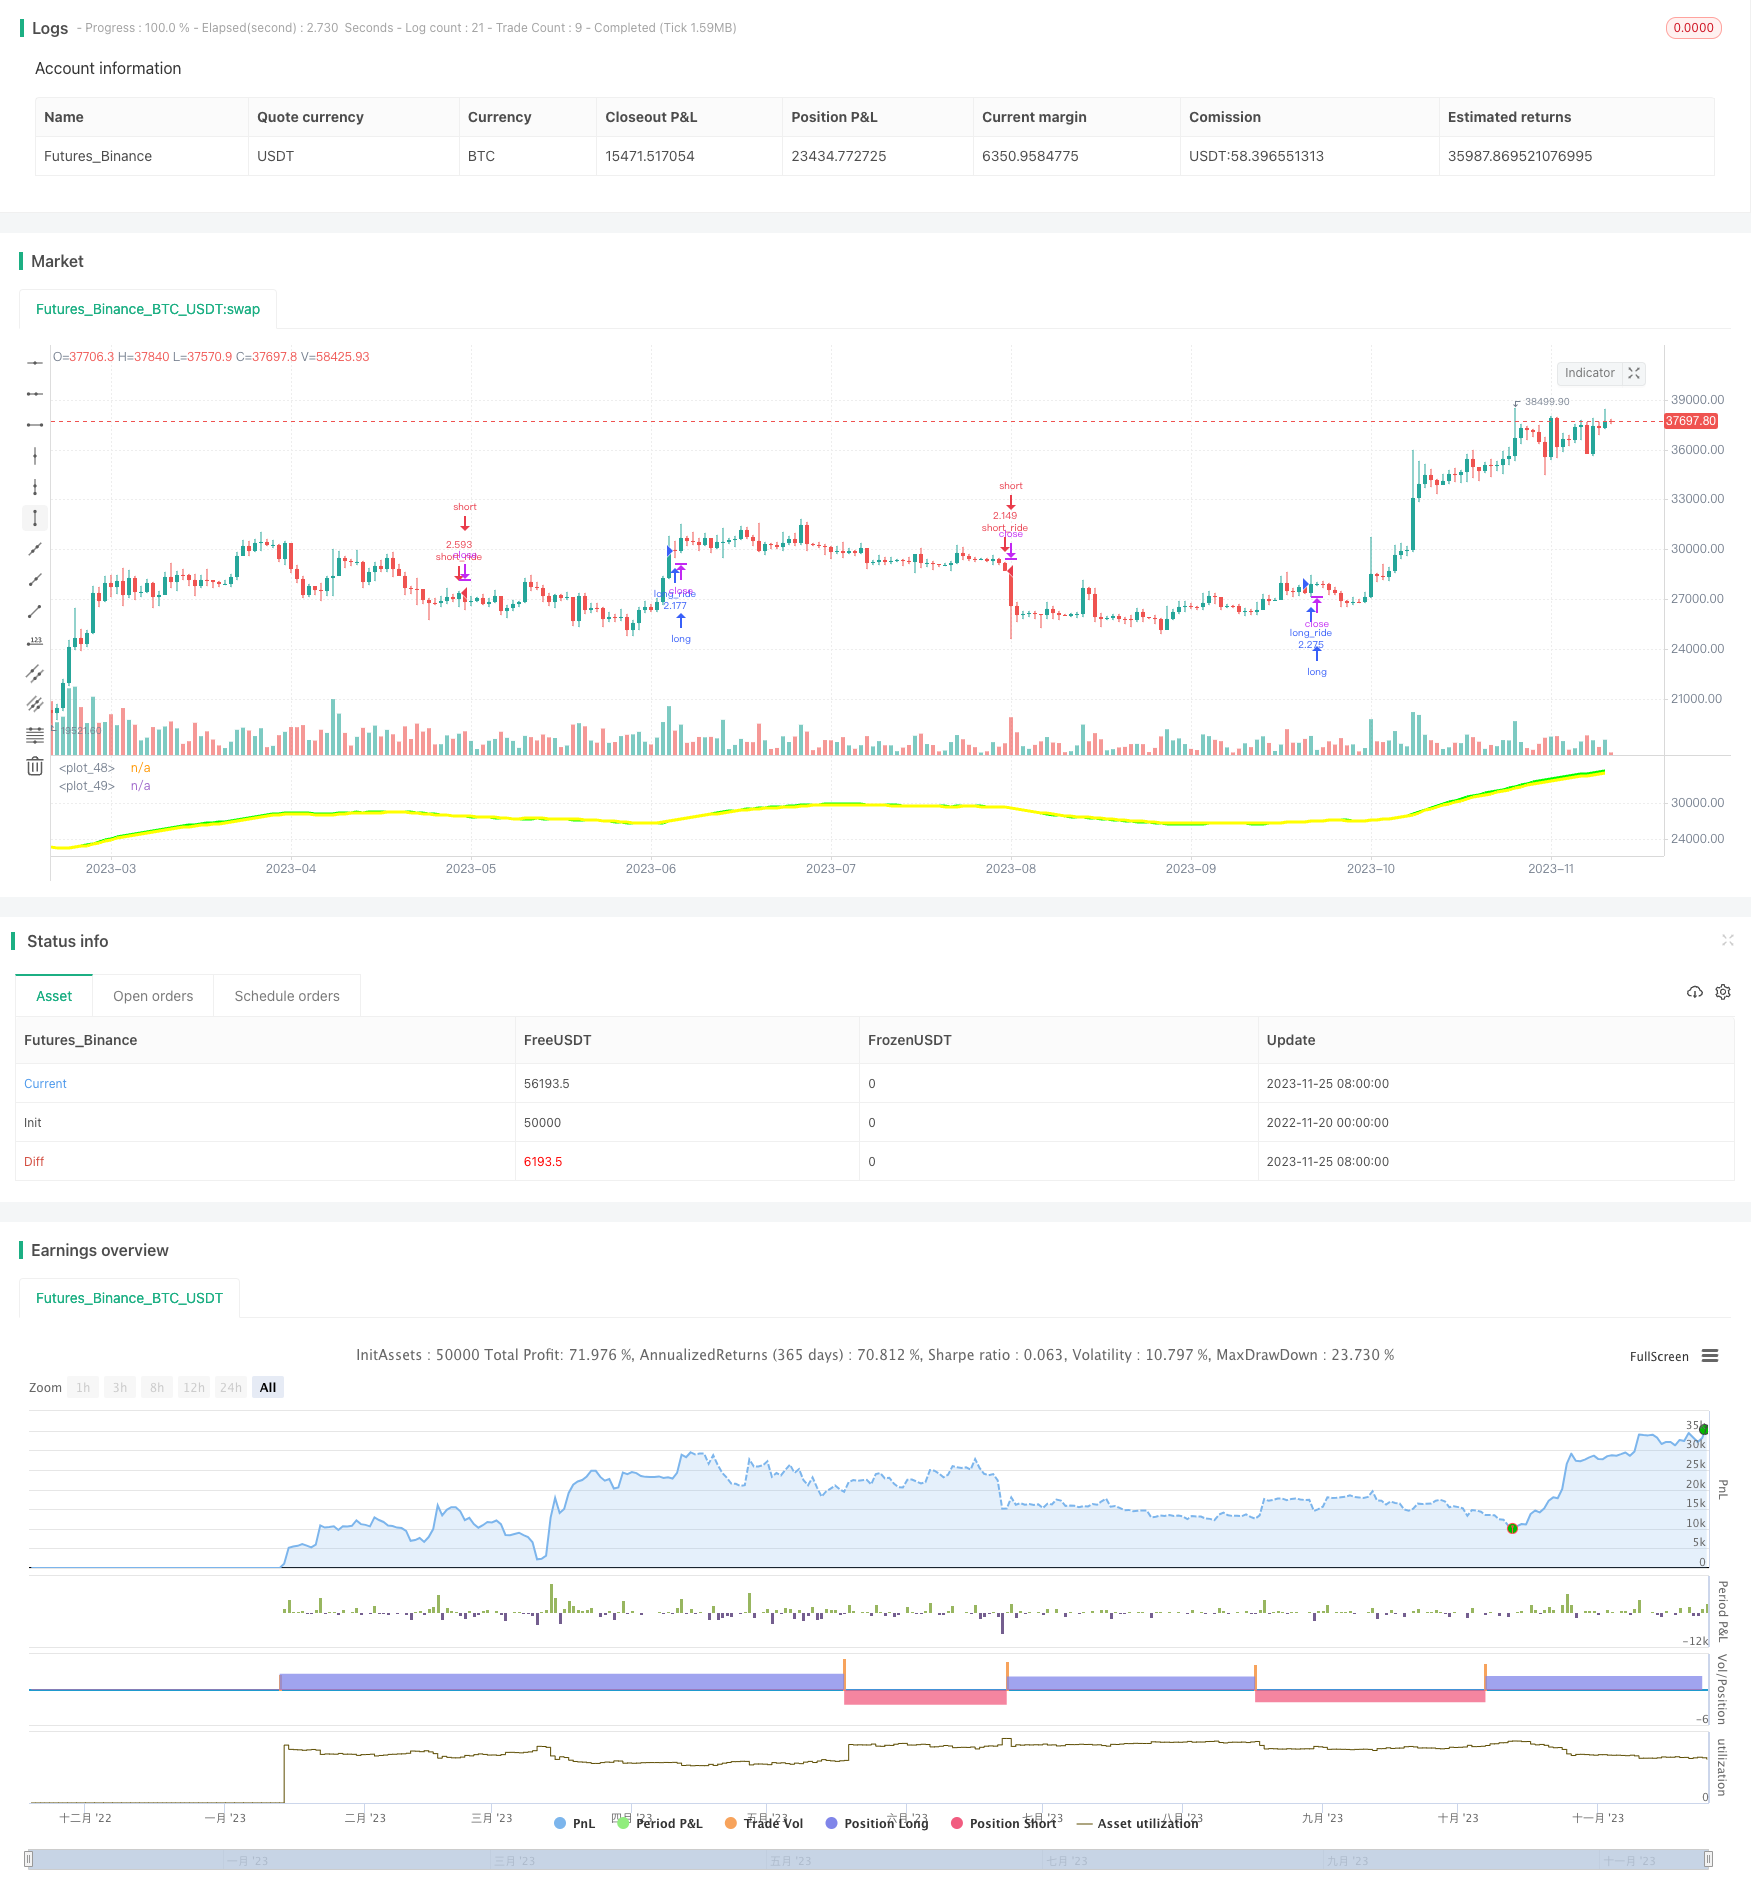
ダブル移動平均クロスオーバーブレイクアウト戦略

概要
この戦略は,株の急速30日単調移動平均と遅い33日単調移動平均を計算し,金叉または死叉が発生したときにLONGまたはSHORTの入場を行います.逆の信号が発生したときにすぐに停止します.これはトレンドの変化を効果的に捉えます.
戦略原則
この戦略の核心は,高速30日平均線と遅い33日平均線を計算することです.高速線は価格変化により早く反応し,遅い線はよりよい波効果があります.高速線が低いところから突破して上がるとき,買入シグナルが生じます.これは,価格が上昇し始めると,高速線は応答していますが,遅い線は依然として遅れています.高速線が上から落ちて,遅い線が下がると,売り込みシグナルが生じます.これは,価格が下がり始めると,高速線は応答していますが,遅い線は依然として遅れています.
このような快慢均線交差設計により,トレンドの開始時に取引シグナルを生成し,逆のシグナルが現れたときにストップストープを行い,中長線の価格トレンドを効果的に捕捉する.同時に,過度の市場波動に惑わされないようにする.
優位分析
この戦略の利点は以下の通りです.
- シンプルな移動平均を用いて 簡単に理解し,実行できます.
- 速線と遅線の組み合わせは,価格の変化に迅速に対応するだけでなく,波効果ももたらす.
- 金叉と死叉の信号はシンプルで明快で,操作が簡単です.
- 中長線トレンドを効果的に捉える
- 逆転信号の発生時に迅速に停止し,リスクを制御する
リスク分析
この戦略にはいくつかのリスクがあります.
- 価格が揺れ動いているとき,偽のシグナルが複数回発生し,過度の取引が起こる可能性があります.
- 価格の急激な変動にうまく対応できない
- 平均線周期などの選択されたパラメータは,最適化が必要であり,不適切な設定は,戦略のパフォーマンスを影響する
- 取引費用は収益に影響する
これらのリスクは,パラメータの最適化,ストップポイントの設定,トレンドが明確であるときにのみ取引などの方法によって制御および軽減することができます.
最適化の方向
この戦略は以下の点で最適化できます.
- 平均周期と交差型を最適化して,最適なパラメータの組み合わせを見つける
- 偽信号を減らすために,取引量,MACDなどの他の技術指標のフィルターを追加します.
- 単なる反射信号停止ではなく,適応的な停止メカニズムを追加
- 異なる商品に対する設計パラメータの組み合わせと止損規則
- 機械学習などの方法と組み合わせた動的調整パラメータ
テストと最適化によって,戦略規則を継続的に改善し,異なる市場環境でより信頼性の高い取引信号を得ることができます.
要約する
この双均線交差突破策は,全体的に比較的シンプルで実用的で,高速均線と遅速均線を組み合わせることで,中長期線トレンドの始まりを効果的に識別し,より信頼性の高い取引信号を生成することができる.また,その止損ルールは容易に実現できる.さらに最適化することで,この策は,長期にわたって保有する価値のある量化システムになることができる.
/*backtest
start: 2022-11-20 00:00:00
end: 2023-11-26 00:00:00
period: 1d
basePeriod: 1h
exchanges: [{"eid":"Futures_Binance","currency":"BTC_USDT"}]
*/

//@version=3
//future strategy
//strategy(title = "es1!_1minute_hull", default_qty_type = strategy.fixed, initial_capital=250000,  overlay = true, commission_type=strategy.commission.cash_per_contract,commission_value=2, calc_on_order_fills=false, calc_on_every_tick=false,pyramiding=0)
//strategy.risk.max_position_size(2)
//stock strategy
strategy(title = "stub", default_qty_type = strategy.percent_of_equity, default_qty_value = 100, initial_capital=1000000, overlay = false)//, calc_on_order_fills=true, calc_on_every_tick=true)
//forex strategy
//strategy(title = "stub", default_qty_type = strategy.percent_of_equity, default_qty_value = 100,  overlay = true,initial_capital=250000, default_qty_type = strategy.percent_of_equity)
//crypto strategy
//strategy(title = "stub", default_qty_type = strategy.percent_of_equity, default_qty_value = 100,  overlay = true, commission_type=strategy.commission.percent,commission_value=.005,default_qty_value=10000)
//strategy.risk.allow_entry_in(strategy.direction.long) // There will be no short entries, only exits from long.


testStartYear = 2010
testStartMonth = 1
testStartDay = 1
testPeriodStart = timestamp(testStartYear,testStartMonth,testStartDay,0,0)


testEndYear = 2039
testEndMonth = 1
testEndDay = 1
testPeriodEnd = timestamp(testEndYear,testEndMonth,testEndDay,0,0)


testPeriod() =>
    //true
    time >= testPeriodStart and time <= testPeriodEnd ? true : false

fast_length = 30
slow_length = 33

ema1 = 0.0
ema2 = 0.0

volumeSum1 = sum(volume, fast_length)
volumeSum2 = sum(volume, slow_length)

//ema1 := (((volumeSum1 - volume) * nz(ema1[1]) + volume * close) / volumeSum1)
ema1 :=  ema(close,fast_length)
//ema2 := (((volumeSum2 - volume) * nz(ema2[1]) + volume * close) / volumeSum2)
ema2 :=  ema(close,slow_length)


plot(ema1,color=#00ff00, linewidth=3)
plot(ema2, color=#ffff00, linewidth=3)

go_long = crossover(ema1,ema2)
go_short = crossunder(ema1,ema2)

if testPeriod()
    strategy.entry("long_ride", strategy.long, when=go_long)
    strategy.entry("short_ride", strategy.short,when=go_short)


    strategy.close("long_ride",when=go_short)
    strategy.close("short_ride",when=go_long)