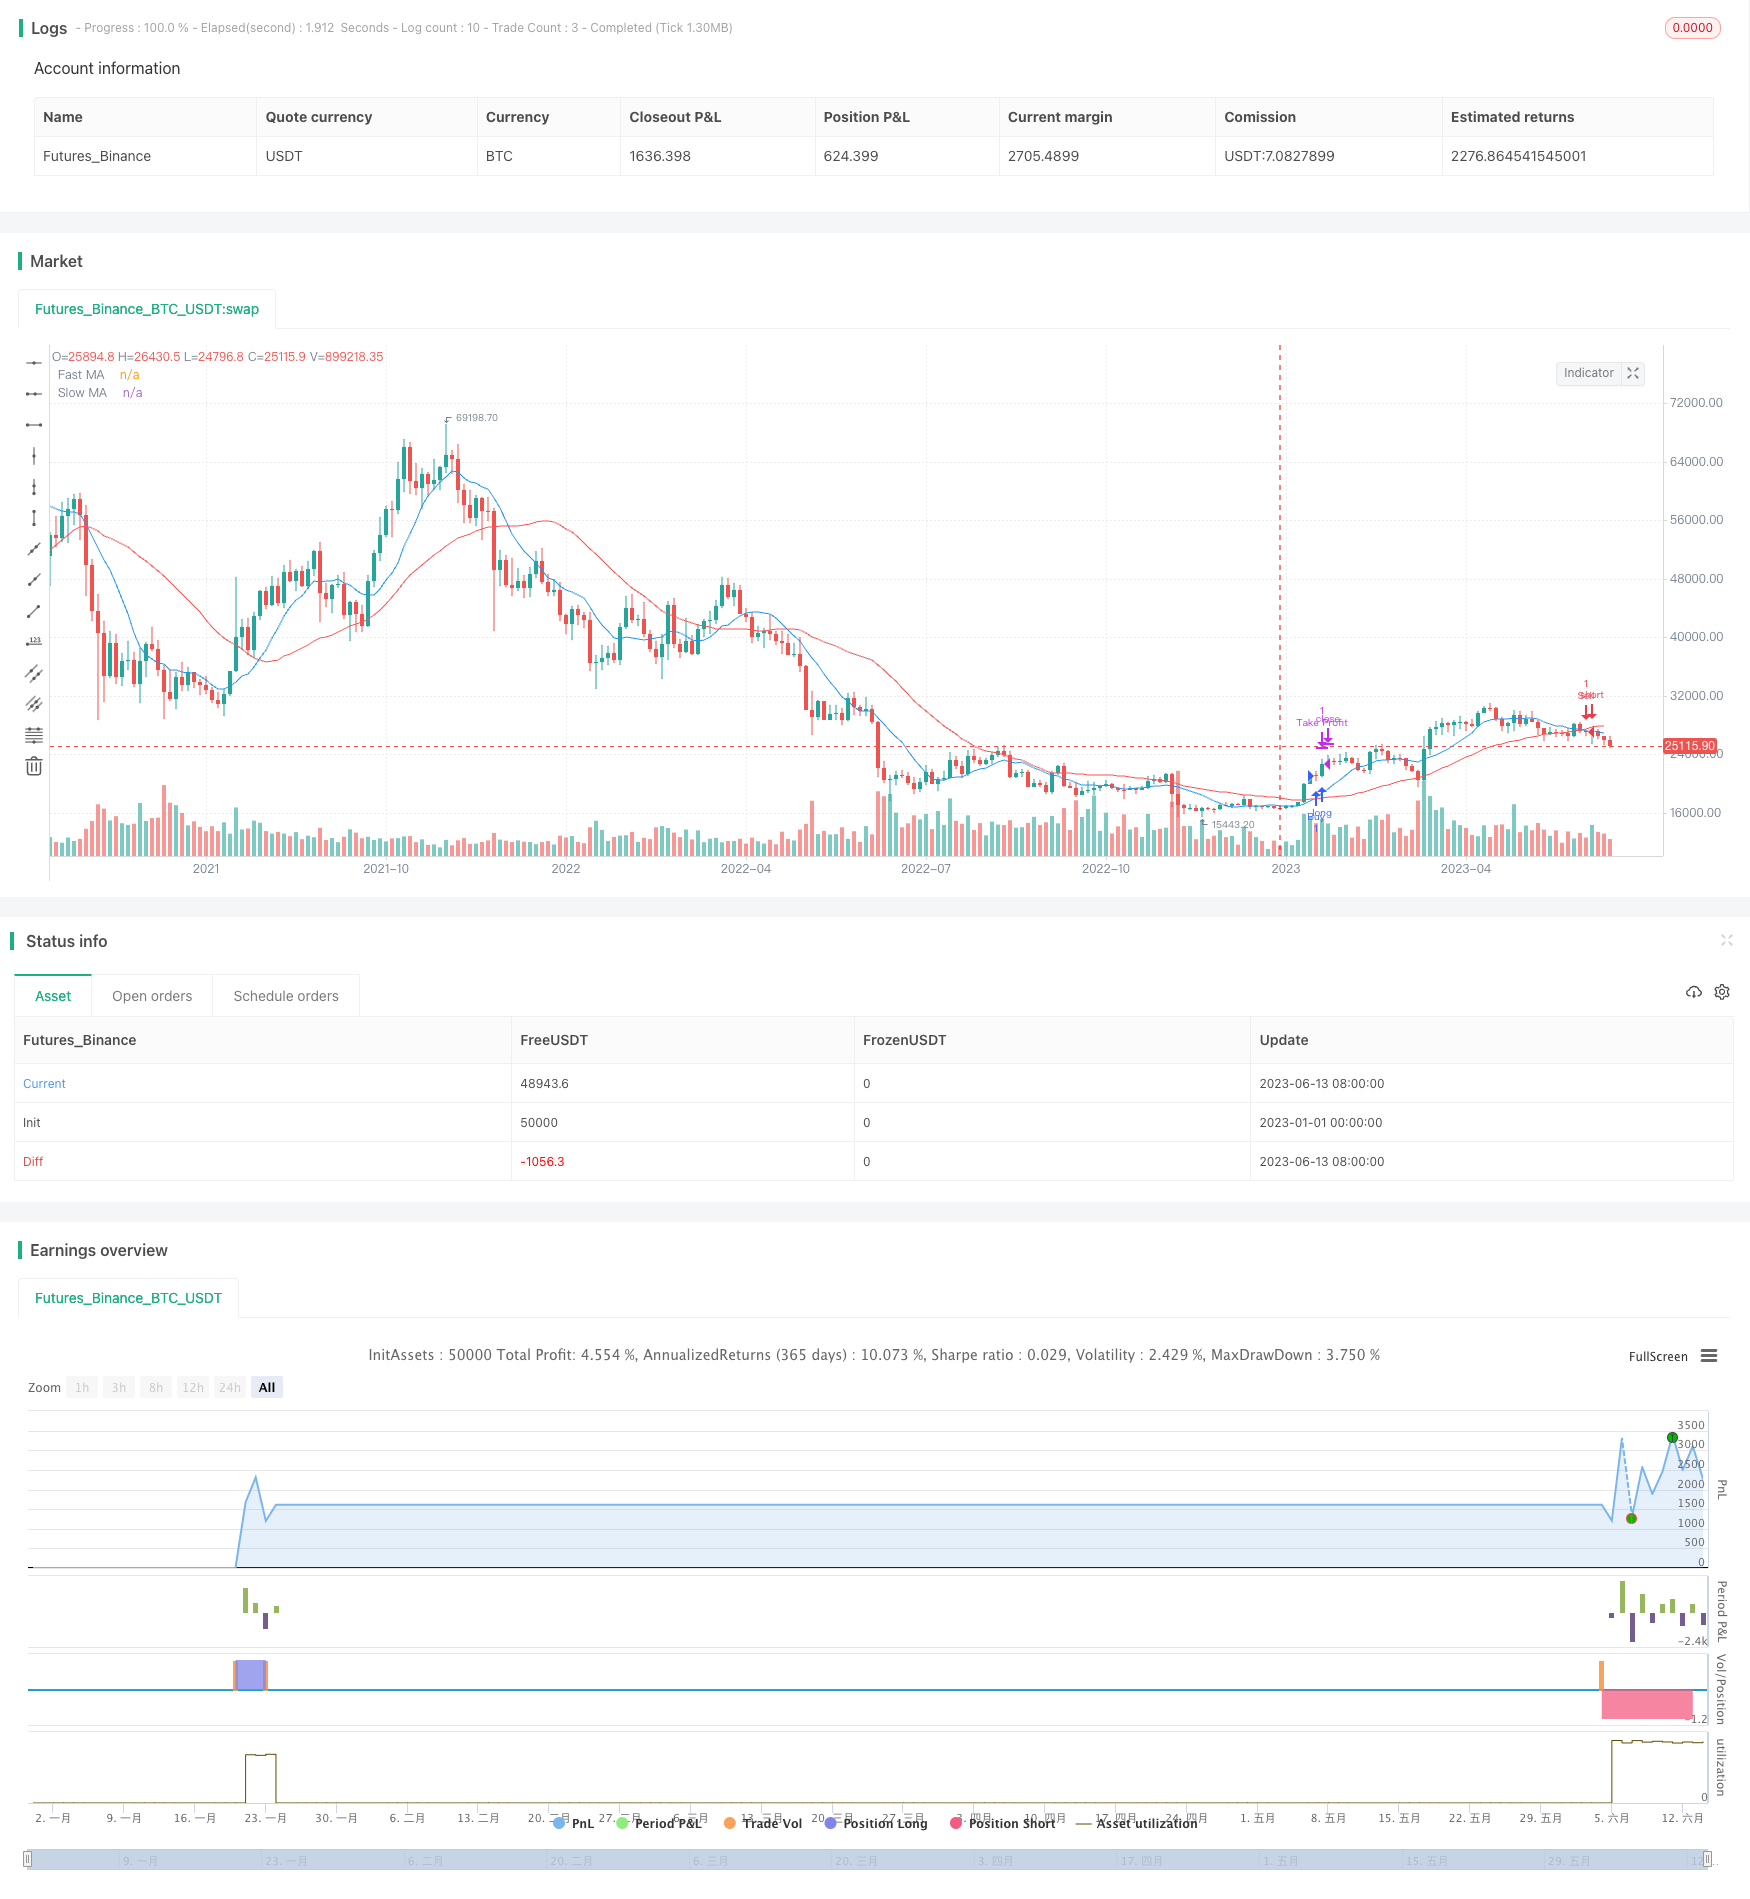
移動平均ゴールデンクロス 1% 利益ストップ戦略

概要
この戦略は,Fast MAとSlow MAの黄金の交差点を計算して買い信号を生成する.Fast MAがSlow MAを上方へ横切ると,買い信号が発動する.
また,小規模で安定した利益を確保するのに役立つ,1%の利益に達すると,戦略は停止する.
この戦略は,傾向がより顕著な株式市場環境に適しています. 中短線の上昇傾向を捉え,安定した利益を達成することができます.
戦略原則
この戦略は主に移動平均の黄金交差原理に基づいています.移動平均は,株価の短期間の傾向を反映します.短期移動平均が長期の移動平均を穿戴すると,株価が短期間の上昇力が長期の傾向より強いことを意味します.これは,より強い買い信号です.
戦略の急速移動平均の長さは10日,遅い移動平均の長さは30日である.これは一定幅の中間トレンドを捉えることができる.速い線で遅い線を突破する状況が発生すると,買入シグナルが誘発される.
さらに,戦略は1%のストップポイントを設定しています.つまり,ポジションの利益が1%に達した場合,ストップフローズが利益をロックします.これは,すでに反転が始まっているトレンドの損失を回避するのに役立ちます.
優位分析
この戦略の利点は以下の通りです.
- 移動平均の指標は,理解しやすく,実行しやすい.
- 平均線配列は,中期トレンドを効果的に識別する.
- 1%のストップポイントは,リスク管理に有利な固定収益目標を設定した.
これは,この戦略を全体的に安定させ,トレンドが顕著な市場で安定した利益を得ることを可能にします.
リスク分析
この戦略にはいくつかのリスクがあります.
- 市場が明らかにトレンドしていないとき,誤ったシグナルや頻繁にストップが起こりやすい.
- 複雑でトレンドの無い市場を 効率的に処理できない
- ストップレスト設定がないので,大きな損失に晒されます.
これらのリスクは以下の方法で制御できます.
- ブリンライン,KDJなどの他の指標の組み合わせを加え,信号の正確性を向上させる.
- 市場の変化に合わせて移動平均のパラメータを動的に調整する.
- 合理的なストップポイントを追加し,単一損失を制御します.
最適化の方向
この戦略は以下の点で最適化できます.
- より多くの快線と遅線のパラメータ組み合わせをテストし,最適のマッチングを探します.
- ストップポイントを追加する.例えば,購入後の評価損失が3%に達したときにストップする.
- MACD,KDJなどの他の技術指標と組み合わせて,多要素モデルを形成し,信号の正確性を向上させる.
- 自動パラメータ最適化方法を使用して最適なパラメータの組み合わせを探します.
要約する
この戦略は,全体として典型的な移動平均線戦略である。中期トレンドを特定し,1%の止まり点と並べて安定した利潤をロックする。優点は,単純に操作しやすいことであり,一定の幅の株価上昇傾向を捉えることができる。欠点は,複雑な状況への適応性の欠如である。この戦略は,より多くの技術指標と止まりシステムの最適化と組み合わせれば,より安定したパフォーマンスを得ることができる。
/*backtest
start: 2023-01-01 00:00:00
end: 2023-06-15 00:00:00
period: 3d
basePeriod: 1d
exchanges: [{"eid":"Futures_Binance","currency":"BTC_USDT"}]
*/

// This source code is subject to the terms of the Mozilla Public License 2.0 at https://mozilla.org/MPL/2.0/
// © pleasantHead5366

//@version=4
strategy("1% Profit Strategy", overlay=true)

// Input parameters
fastLength = input(10, title="Fast MA Length")
slowLength = input(30, title="Slow MA Length")
profitPercentage = input(1, title="Profit Percentage")

// Calculate moving averages
fastMA = sma(close, fastLength)
slowMA = sma(close, slowLength)

// Plot moving averages on the chart
plot(fastMA, color=color.blue, title="Fast MA")
plot(slowMA, color=color.red, title="Slow MA")

// Trading logic
longCondition = crossover(fastMA, slowMA)
if (longCondition)
    strategy.entry("Buy", strategy.long)

// Close long position when profit reaches 1%
if (strategy.position_size > 0)
    strategy.exit("Take Profit", from_entry="Buy", profit=profitPercentage / 100)

// Plot Buy and Sell signals on the chart
shortCondition = crossunder(fastMA, slowMA)
if (shortCondition)
    strategy.entry("Sell", strategy.short)