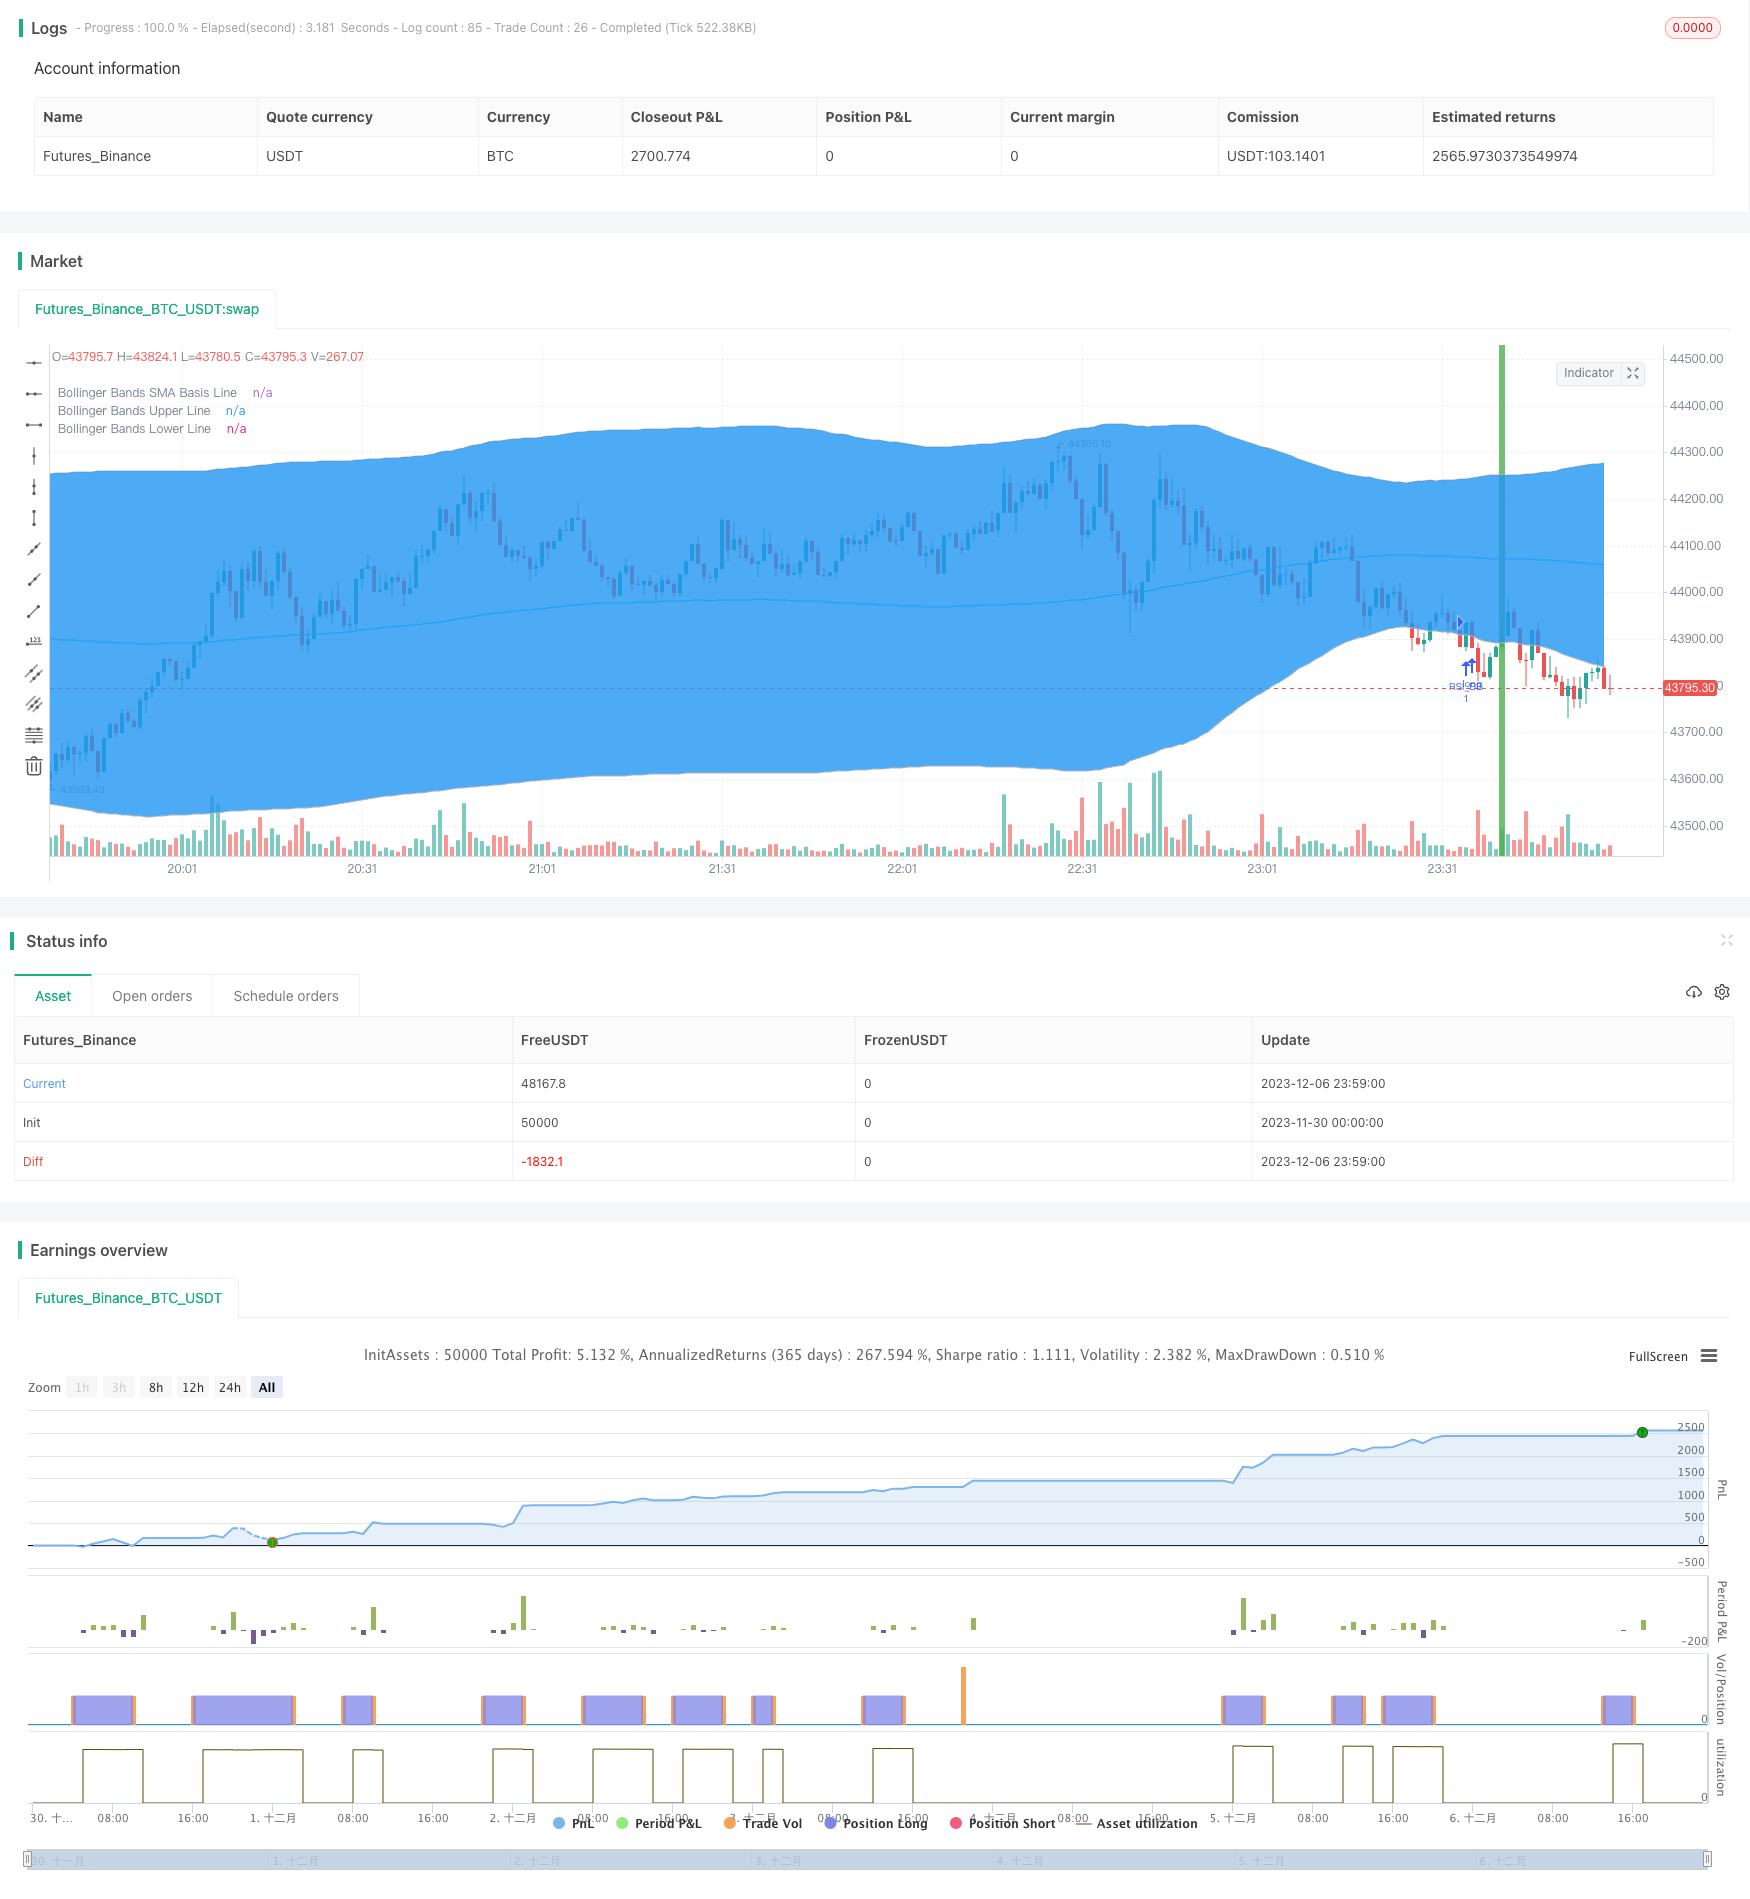
ボリンジャー+RSI デュアル戦略 (ロングのみ) v1.2
作成日:
2023-12-08 10:39:52
最終変更日:
2023-12-08 10:39:52
コピー:
0
クリック数:
1082
1
フォロー
1627
フォロワー

1. 戦略の名称
Bollinger + RSI ダブル・マルチヘッド戦略
2 戦略概要
この戦略は,ブリンライン指標とRSI指標の組み合わせを利用し,両方が同時にオーバーソール信号を表示するときに多仓を立て,両方が同時にオーバー買い信号を表示するときに平仓を立てます.単一の指標と比較して,取引信号をより信頼的に確認し,偽信号を避けることができます.
3つ目 戦略の原則
- RSIで 超買いと超売りを判断する
- RSIが50を下回ると 超売りです
- RSIが50を超えると 超買いとされます
- ブリンラインで価格の異常を判断する
- 価格を下回るものは超売りとみなされる
- 上線より高い価格なら超買いだ.
- RSIとブリンラインが同時にオーバーセール信号を発したときに,多額のポジションを作ります.
- RSIが50を下回った
- 価格ラインはブリン線より下線
- RSIとブリンラインが同時にオーバーバイのシグナルを示しているとき,平仓
- RSIは50を超えています.
- ブリン線より上線
4 戦略的優位性
- 2つの指標を組み合わせると,偽信号を避けるため,より信頼性の高い信号が得られます.
- 複数のポジションのみを設定し,論理を簡素化し,取引リスクを減らす
5 戦略的リスクと解決策
- ブリンラインパラメータの設定不適切,上下線制限が広く,誤取引のリスクが増加
- ブリンラインパラメータを最適化し,ブリンライン周期と標準差を合理的に設定する
- RSIパラメータの設定が不適切で,超買い超売判断基準が不適切で,誤取引のリスクが増加する
- RSIパラメータを最適化し,RSI周期を調整し,超買超売基準を合理的に設定する
- レーヴィンは,トレンドがない時,うまくいかない.
- トレンド指数と組み合わせて,震動操作を避ける
6 戦略の最適化方向
- ブリンラインとRSIパラメータの設定を最適化
- 損失防止の強化
- MACDなどのトレンド指数と組み合わせた
- 短線と長線を組み合わせる判断を追加する
VII. 結論
この戦略は,ブリンラインとRSIの2つの指標の優位性を組み合わせて,両方が同時に超買い超売りシグナルを表示するときに取引し,単一の指標によって発生する偽信号を避け,シグナル正確性を向上させる.以前のバージョンと比較して,複数のポジションのみを確立し,取引リスクを低下させる.その後,パラメータ最適化,ストップダスト機構,およびトレンド型の指標との組み合わせなどによって戦略を最適化することができ,異なる市場環境により適合させる.
ストラテジーソースコード
/*backtest
start: 2023-11-30 00:00:00
end: 2023-12-07 00:00:00
period: 1m
basePeriod: 1m
exchanges: [{"eid":"Futures_Binance","currency":"BTC_USDT"}]
*/

//@version=3
strategy("Bollinger + RSI, Double Strategy Long-Only (by ChartArt) v1.2", shorttitle="CA_-_RSI_Bol_Strat_1.2", overlay=true)

// ChartArt's RSI + Bollinger Bands, Double Strategy UPDATE: Long-Only
//
// Version 1.2
// Idea by ChartArt on October 4, 2017.
//
// This strategy uses the RSI indicator
// together with the Bollinger Bands
// to buy when the price is below the
// lower Bollinger Band (and to close the
// long trade when this value is above
// the upper Bollinger band).
//
// This simple strategy only longs when
// both the RSI and the Bollinger Bands
// indicators are at the same time in
// a oversold condition.
//
// In this new version 1.2 the strategy was
// simplified by going long-only, which made
// it more successful in backtesting.
//
// List of my work:
// https://www.tradingview.com/u/ChartArt/
//
//  __             __  ___       __  ___
// /  ` |__|  /\  |__)  |   /\  |__)  |
// \__, |  | /~~\ |  \  |  /~~\ |  \  |
//
//


///////////// RSI
RSIlength = input(6,title="RSI Period Length")
RSIoverSold = 50
RSIoverBought = 50
price = close
vrsi = rsi(price, RSIlength)


///////////// Bollinger Bands
BBlength = input(200, minval=1,title="Bollinger Period Length")
BBmult = 2 // input(2.0, minval=0.001, maxval=50,title="Bollinger Bands Standard Deviation")
BBbasis = sma(price, BBlength)
BBdev = BBmult * stdev(price, BBlength)
BBupper = BBbasis + BBdev
BBlower = BBbasis - BBdev
source = close
buyEntry = crossover(source, BBlower)
sellEntry = crossunder(source, BBupper)
plot(BBbasis, color=aqua,title="Bollinger Bands SMA Basis Line")
p1 = plot(BBupper, color=silver,title="Bollinger Bands Upper Line")
p2 = plot(BBlower, color=silver,title="Bollinger Bands Lower Line")
fill(p1, p2)


///////////// Colors
switch1=input(true, title="Enable Bar Color?")
switch2=input(true, title="Enable Background Color?")
TrendColor = RSIoverBought and (price[1] > BBupper and price < BBupper) and BBbasis < BBbasis[1] ? red : RSIoverSold and (price[1] < BBlower and price > BBlower) and BBbasis > BBbasis[1] ? green : na
barcolor(switch1?TrendColor:na)
bgcolor(switch2?TrendColor:na,transp=50)


///////////// RSI + Bollinger Bands Strategy
long = (crossover(vrsi, RSIoverSold) and crossover(source, BBlower))
close_long = (crossunder(vrsi, RSIoverBought) and crossunder(source, BBupper))

if (not na(vrsi))

    if long
        strategy.entry("RSI_BB", strategy.long, stop=BBlower, comment="RSI_BB")
    else
        strategy.cancel(id="RSI_BB")

    if close_long
        strategy.close("RSI_BB")


//plot(strategy.equity, title="equity", color=red, linewidth=2, style=areabr)