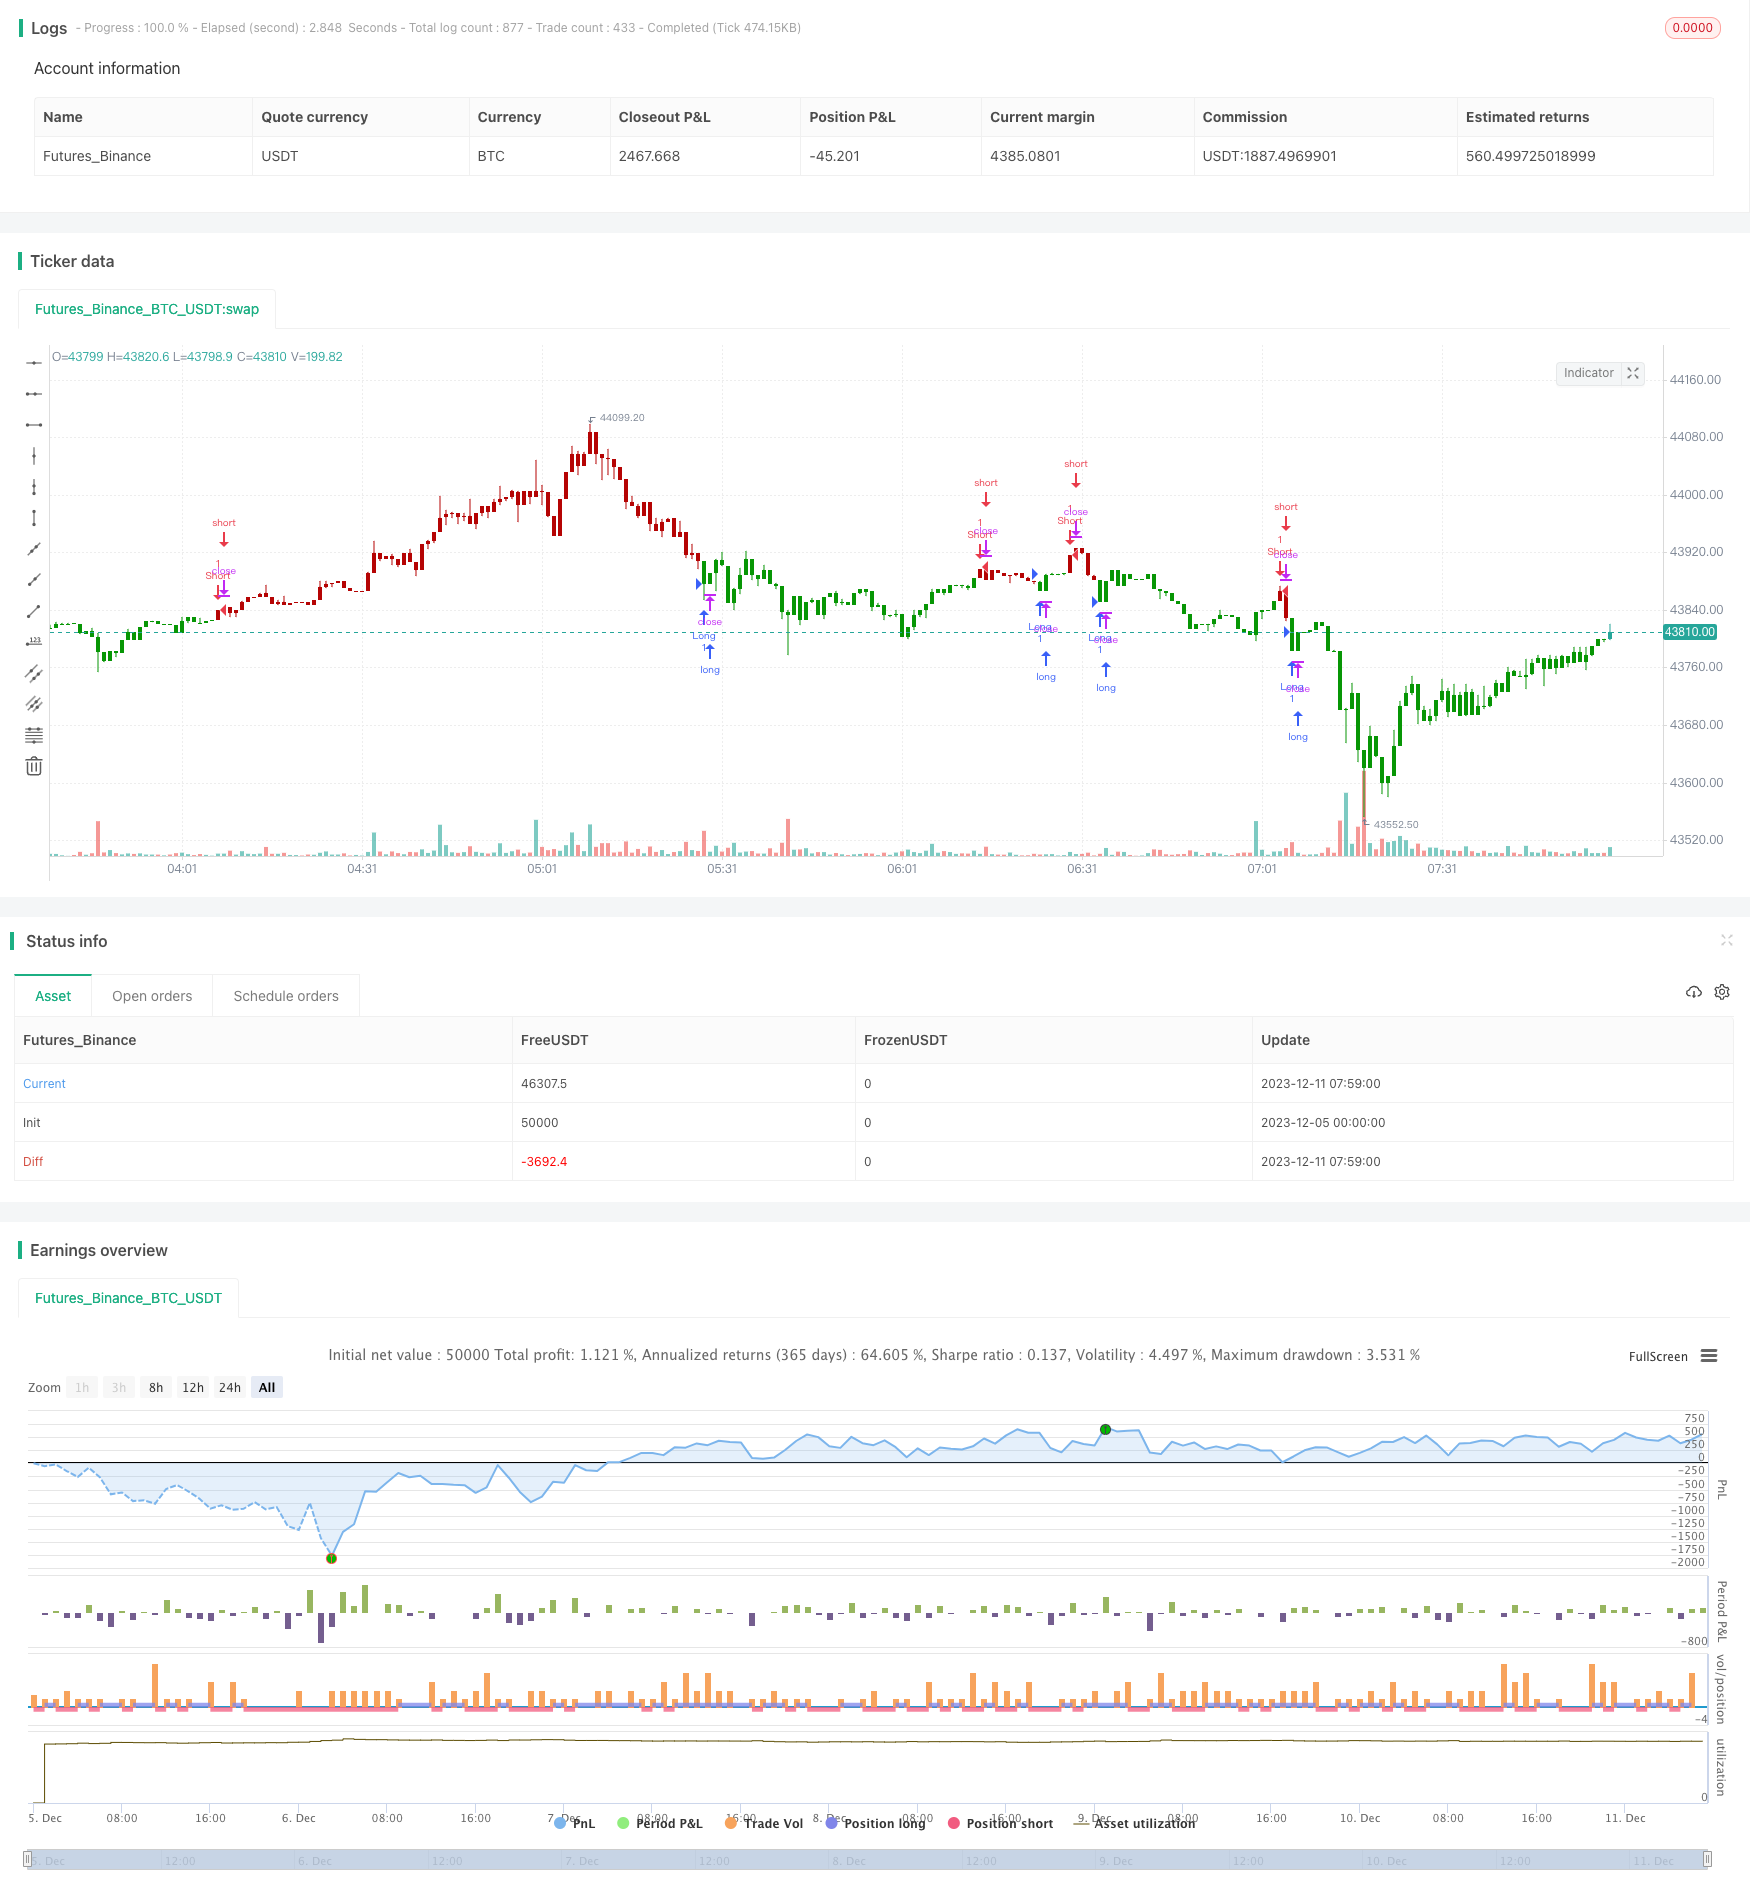
適応型価格帯反転取引戦略

戦略概要
戦略の名前は適応型価格帯反転取引戦略この戦略は,適応価格ゾーン (Adaptive Price Zone,APZ) を用いて,価格ゾーンを識別し,そのゾーンを破るときに取引シグナルを生成する.APZ指標は,二指数移動平均と変動率の計算に基づいて,価格ゾーンの境界を下回る.価格がゾーンの境界を破るときは,価格が逆転する可能性を示し,取引機会を生成する.
この戦略は,主に波動的な状況,特に整合的な状況に適用されます.これは,日中のショートライン取引または自動取引システムの一部として,すべての取引可能な資産に適用されます.全体的に,この戦略は,APZ指標が提供する補助判断を利用して,価格領域の境界付近で反転取引を行います.
2. 戦略の原則
この策略は,APZ指標を用いて価格領域を判断し,具体的には以下の計算方法を用いる.
- 最新のnサイクル (デフォルトの20サイクル) の最高値と最低値の差 xHL を計算する
- 二次指数移動平均を用いて平滑後の閉盘値xVal1とxHLの平滑値xVal2を計算する. 計算周期は平方根の後の整数 ((20の平方根を整数=4と仮定する)
- xVal1 + nBandPct * xVal2 を計算する
- 下線=xVal1−nBandPct*xVal2を計算する
このように得られる上下線は自律価格領域を形成する.価格がこの領域を突破すると,取引信号が生成される.突破信号判断の規則は以下の通りである.
- 価格が下位に下がったとき,多めにシグナルを出す
- 価格が上線より高いとき,空き信号
さらに,この戦略は,逆取引の切り替えパラメータ reverse も提供している. reverse を開いた後,上記の規則に反して,多額の空調信号を行う.
総じて,この戦略は,APZ指標を用いて自律的な価格領域を判断し,価格が地域境界を破るときに反転取引信号を生成し,典型的なトレンド反転追跡戦略に属します.
3つ目 戦略的優位性分析
この戦略の利点は以下の通りです.
- APZ指標を使用して,価格領域を自主的に決定し,人為的にサポートレジスタンス位置を設定することを避ける
- 価格区間の境界を突破して反転取引を行い,短期的な価格調整の機会を捉える
- 逆取引パラメータで対価下げ取引が可能
- 取引頻度が高く,短線機会が多く
- リスク管理の柔軟性
4 戦略的リスク分析
この戦略にはいくつかのリスクがあり,以下のような部分に重点を置いています.
- APZパラメータを正しく設定しない場合,価格の逆転のチャンスを逃す可能性があります.
- 震災の際には,偽突破が複数発生する可能性があります.
- ストップ・ローズ戦略の欠如は,大きな損失をもたらす可能性があります.
解決策は以下の通りです.
- APZパラメータを調整して,適切な滑り回路を見つける
- 他の指標と組み合わせたフェイクブレークをフィルタリング
- 単一損失をコントロールするために移動停止を増加させる
5 戦略の最適化方向
この戦略は以下の点で最適化できます.
- 波動率の指数で判断すると,底は買い,上は売り
- 大量の放出など,区間突破強度条件を増やす
- 特定の時間帯での取引のみ,例えばアメリカ盤
- 均線システムと組み合わせて大市場のトレンド方向を決定する
- 価格の設定は,無意味な取引を避けるために
VI. 結論
この戦略は,一般的に,ショートライン反転戦略に属し,APZ指標を通して価格領域を捕捉し,区間の境界付近で反転取引を行う.この戦略の優点は,取引頻度が高いこと,ショートラインの機会を多く捕捉でき,価格領域を自律的に調整できる点である.しかし,ある程度の偽突破リスクもあるため,他のツールを使用して最適化を行う必要がある.
/*backtest
start: 2023-12-05 00:00:00
end: 2023-12-11 08:00:00
period: 1m
basePeriod: 1m
exchanges: [{"eid":"Futures_Binance","currency":"BTC_USDT"}]
*/

//@version=4
////////////////////////////////////////////////////////////
//  Copyright by HPotter v1.0 15/01/2020
//
// The adaptive price zone (APZ) is a volatility-based technical indicator that helps investors
// identify possible market turning points, which can be especially useful in a sideways-moving
// market. It was created by technical analyst Lee Leibfarth in the article “Identify the
// Turning Point: Trading With An Adaptive Price Zone,” which appeared in the September 2006 issue
// of the journal Technical Analysis of Stocks and Commodities.
// This indicator attempts to signal significant price movements by using a set of bands based on
// short-term, double-smoothed exponential moving averages that lag only slightly behind price changes.
// It can help short-term investors and day traders profit in volatile markets by signaling price
// reversal points, which can indicate potentially lucrative times to buy or sell. The APZ can be
// implemented as part of an automated trading system and can be applied to the charts of all tradeable assets.
//
// WARNING:
// - For purpose educate only
// - This script to change bars colors.
////////////////////////////////////////////////////////////

strategy(title="Adaptive Price Zone Backtest", shorttitle="APZ", overlay = true)
nPeriods = input(20, minval=1)
nBandPct = input(2, minval=0)
reverse = input(false, title="Trade reverse")
xHL = high - low
nP = ceil(sqrt(nPeriods))
xVal1 = ema(ema(close,nP), nP)
xVal2 = ema(ema(xHL,nP), nP)
UpBand = nBandPct * xVal2 + xVal1
DnBand = xVal1 - nBandPct * xVal2
pos = 0
pos := iff(low < DnBand , 1,
	   iff(high > UpBand, -1, pos[1]))
possig = iff(reverse and pos == 1, -1,
          iff(reverse and pos == -1 , 1, pos))
if (possig == 1)
    strategy.entry("Long", strategy.long)
if (possig == -1)
    strategy.entry("Short", strategy.short)
if (possig == 0)
    strategy.close_all()
barcolor(possig == -1 ? #b50404: possig == 1 ? #079605 : #0536b3 )