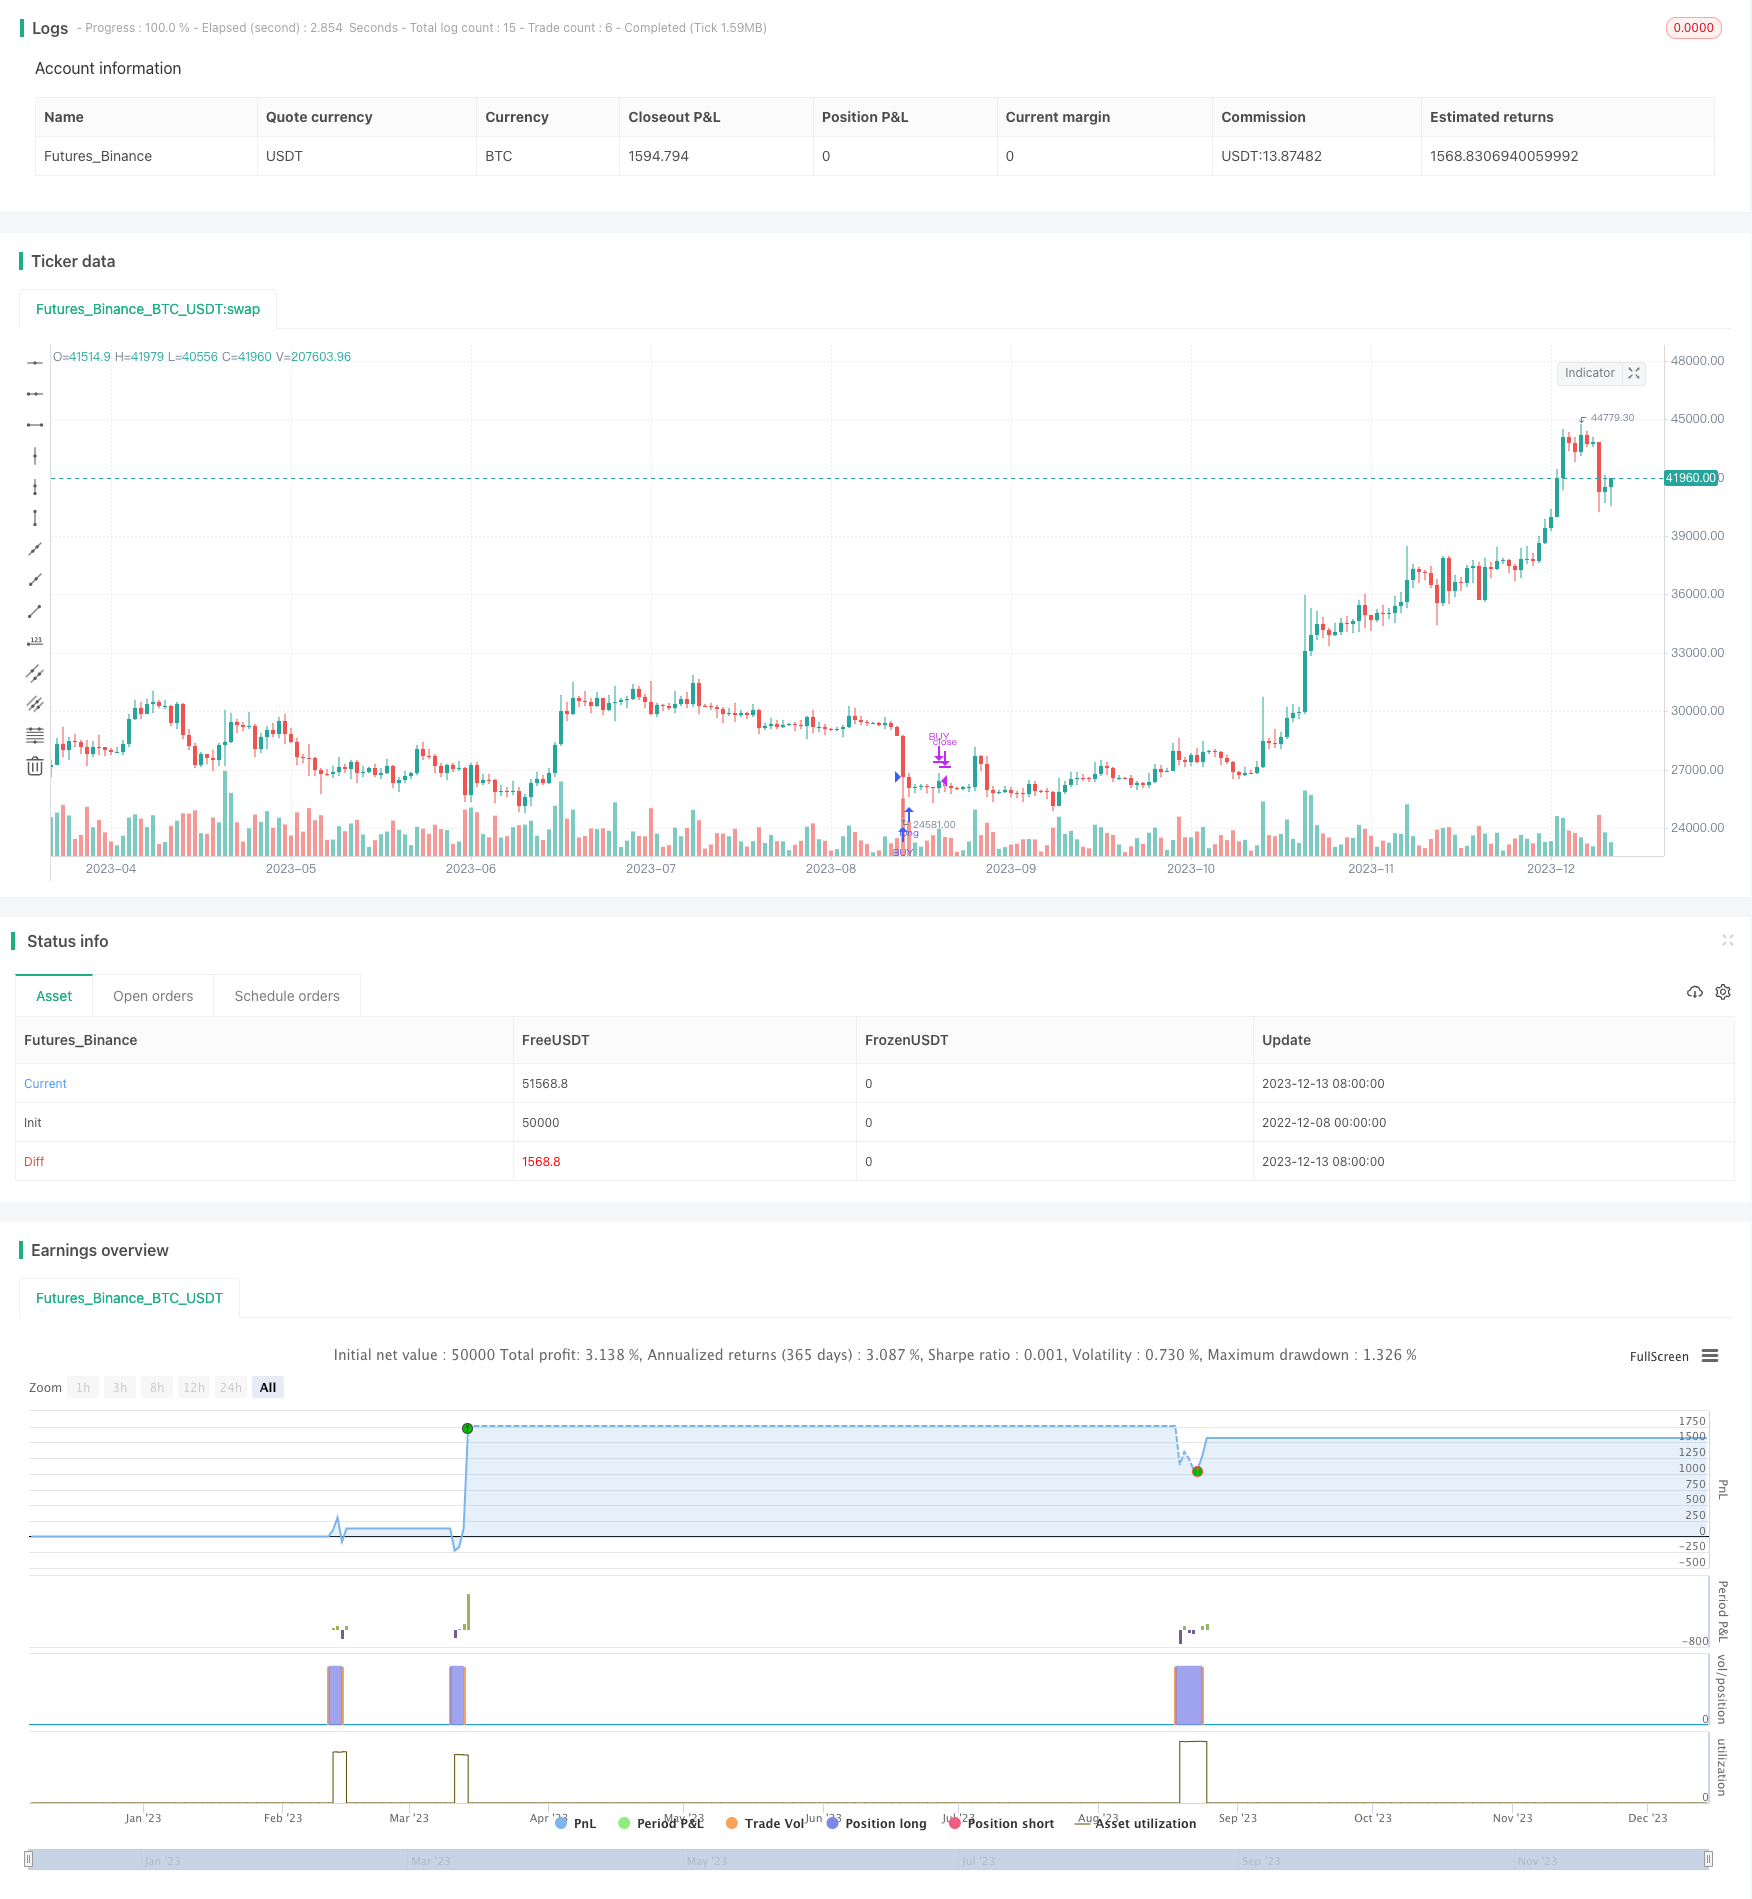
Qiming ダブルシフト平均回帰取引戦略

概要
HYE Mean Reversion SMA Strategyは,シンプルな移動平均と比較的強い指標を利用した平均の回帰取引戦略である.この戦略は,価格が移動平均から一定幅の偏移を適用すると,RSI指標のフィルター信号と組み合わせて,買入と売却の信号を生成し,ショートライン取引戦略に属します.
戦略原則
この戦略は主に以下のルールに基づいています.
期2の簡易移動平均線が5期の簡易移動平均線に比べて3%下落すると,株価が平均値から偏っていると考えられ,買い信号が生じます.
2期の簡易移動平均線を5期の簡易移動平均線に突破すると,価格の回帰平均値とみなされ,売り込みシグナルを生成する.
5期RSI指標の指数移動平均を組み合わせると,RSIが30を下回ったときにのみ買い信号が生じ,RSIが70を超えたときにのみ売り信号が生じ,不必要な取引を回避します.
この戦略の主な構想は,短期間の価格の変動を利用して平均値戻りチャンスを捉えることである.価格が一定量の下落時に買い,等価が再び平均線に近いところに戻ったときに売り,利益を上げることである.同時に,RSI指標は,超買い超売状況を識別し,いくつかのノイズ取引信号をフィルターするために使用することができる.
戦略的優位分析
この戦略の利点は以下の通りです.
簡単な操作,実行しやすい,低コストの監視
価格が移動平均から偏っているという特性を利用し,短線平均の回帰の機会を捉え,歴史の追溯は良好です.
RSIは,高低の動きを回避するために,ノイズ取引を効果的にフィルターします.
市場環境によってパラメータを柔軟に調整できる.
異なる好みを考慮して,多額,空白,双方向の取引が可能です.
リスク分析
この戦略にはいくつかのリスクがあります.
戻り取引は価格が平均線に戻る能力に依存し,価格が急激に変化した場合,止損のリスクが大きい.
パラメータの不適切な設定により,取引が頻発し,機会が失われる可能性があります.
策略のパフォーマンスは市場に関連性があり,横盤と振動的な市では劣っている.
対策として
ストップ・ロスを合理的に設定し,単一損失をコントロールする.
収益の引き戻し比率を評価するパラメータを段階的に最適化します.
株価指数強化戦略と組み合わせた適応性
最適化の方向
この戦略は以下の点で最適化できます.
異なる移動平均の組み合わせをテストし,最適なパラメータを探します.
戦略の成功率を高めるために,他の指標とトレンドを組み合わせてみましょう.
戦略の最大撤回を減らすために,最大損失を抑えるメカニズムを増やすこと.
取引のルールを最適化し,収益性を向上させる.
機械学習技術と組み合わせた自己適応パラメータの構築.
要約する
啓蒙 二重偏移平均値回帰取引戦略は,簡単な実用的な短線平均値回帰戦略である.価格の相対移動平均の偏差を利用して取引信号を生成し,同時にRSI指標でノイズをフィルタリングし,反転で優れたパフォーマンスを発揮する.この戦略は,操作がシンプルで,実行が容易で,市場環境に応じてパラメータを調整し,短線平均値回帰を追跡する投資家に適している.しかし,また,回帰不確実性や止損リスクにも注意し,異なる市場状況に適した合理的な最適化が必要である.全体的に,この戦略は,取引を量化するための参照平均値回帰戦略のテンプレートを提供します.
/*backtest
start: 2022-12-08 00:00:00
end: 2023-12-14 00:00:00
period: 1d
basePeriod: 1h
exchanges: [{"eid":"Futures_Binance","currency":"BTC_USDT"}]
*/

// @version=4

strategy("HYE Mean Reversion SMA [Strategy]", overlay = true )

//Strategy inputs
source = input(title = "Source", defval = close)
tradeDirection = input(title="Trade Direction", type=input.string,
     options=["Long Only", "Short Only", "Both"], defval="Long Only")
smallMAPeriod = input(title = "Small Moving Average", defval = 2)
bigMAPeriod = input(title = "Big Moving Average", defval = 5)
percentBelowToBuy = input(title = "Percent below to buy %", defval = 3)
percentAboveToSell = input(title = "Percent above to sell %", defval = 3)
rsiPeriod = input(title = "Rsi Period", defval = 2)
rsiLevelforBuy = input(title = "Maximum Rsi Level for Buy", defval = 30)
rsiLevelforSell = input(title = "Minimum Rsi Level for Sell", defval = 70)

longOK  = (tradeDirection == "Long Only") or (tradeDirection == "Both")
shortOK = (tradeDirection == "Short Only") or (tradeDirection == "Both")

// Make input options that configure backtest date range
startDate = input(title="Start Date", type=input.integer,
     defval=1, minval=1, maxval=31)
startMonth = input(title="Start Month", type=input.integer,
     defval=1, minval=1, maxval=12)
startYear = input(title="Start Year", type=input.integer,
     defval=2020, minval=1800, maxval=2100)

endDate = input(title="End Date", type=input.integer,
     defval=31, minval=1, maxval=31)
endMonth = input(title="End Month", type=input.integer,
     defval=12, minval=1, maxval=12)
endYear = input(title="End Year", type=input.integer,
     defval=2021, minval=1800, maxval=2100)

inDateRange = true

//Strategy calculation
rsiValue = rsi(source, rsiPeriod)
rsiEMA   = ema(rsiValue, 5)
smallMA = sma(source, smallMAPeriod)
bigMA =  sma(source, bigMAPeriod)
buyMA = ((100 - percentBelowToBuy) / 100) * sma(source, bigMAPeriod)[0]
sellMA = ((100 + percentAboveToSell) / 100) * sma(source, bigMAPeriod)[0]

if(crossunder(smallMA, buyMA) and rsiEMA < rsiLevelforBuy and inDateRange and longOK)
    strategy.entry("BUY", strategy.long)

if(crossover(smallMA, bigMA) or not inDateRange)
    strategy.close("BUY")

if(crossover(smallMA, sellMA) and rsiEMA > rsiLevelforSell and inDateRange and shortOK)
    strategy.entry("SELL", strategy.short)

if(crossunder(smallMA, bigMA) or not inDateRange)
    strategy.close("SELL")