EMAのクロスオーバー戦略
作者: リン・ハーンチャオチャン開催日:2023年12月20日 17:39:30タグ:

概要
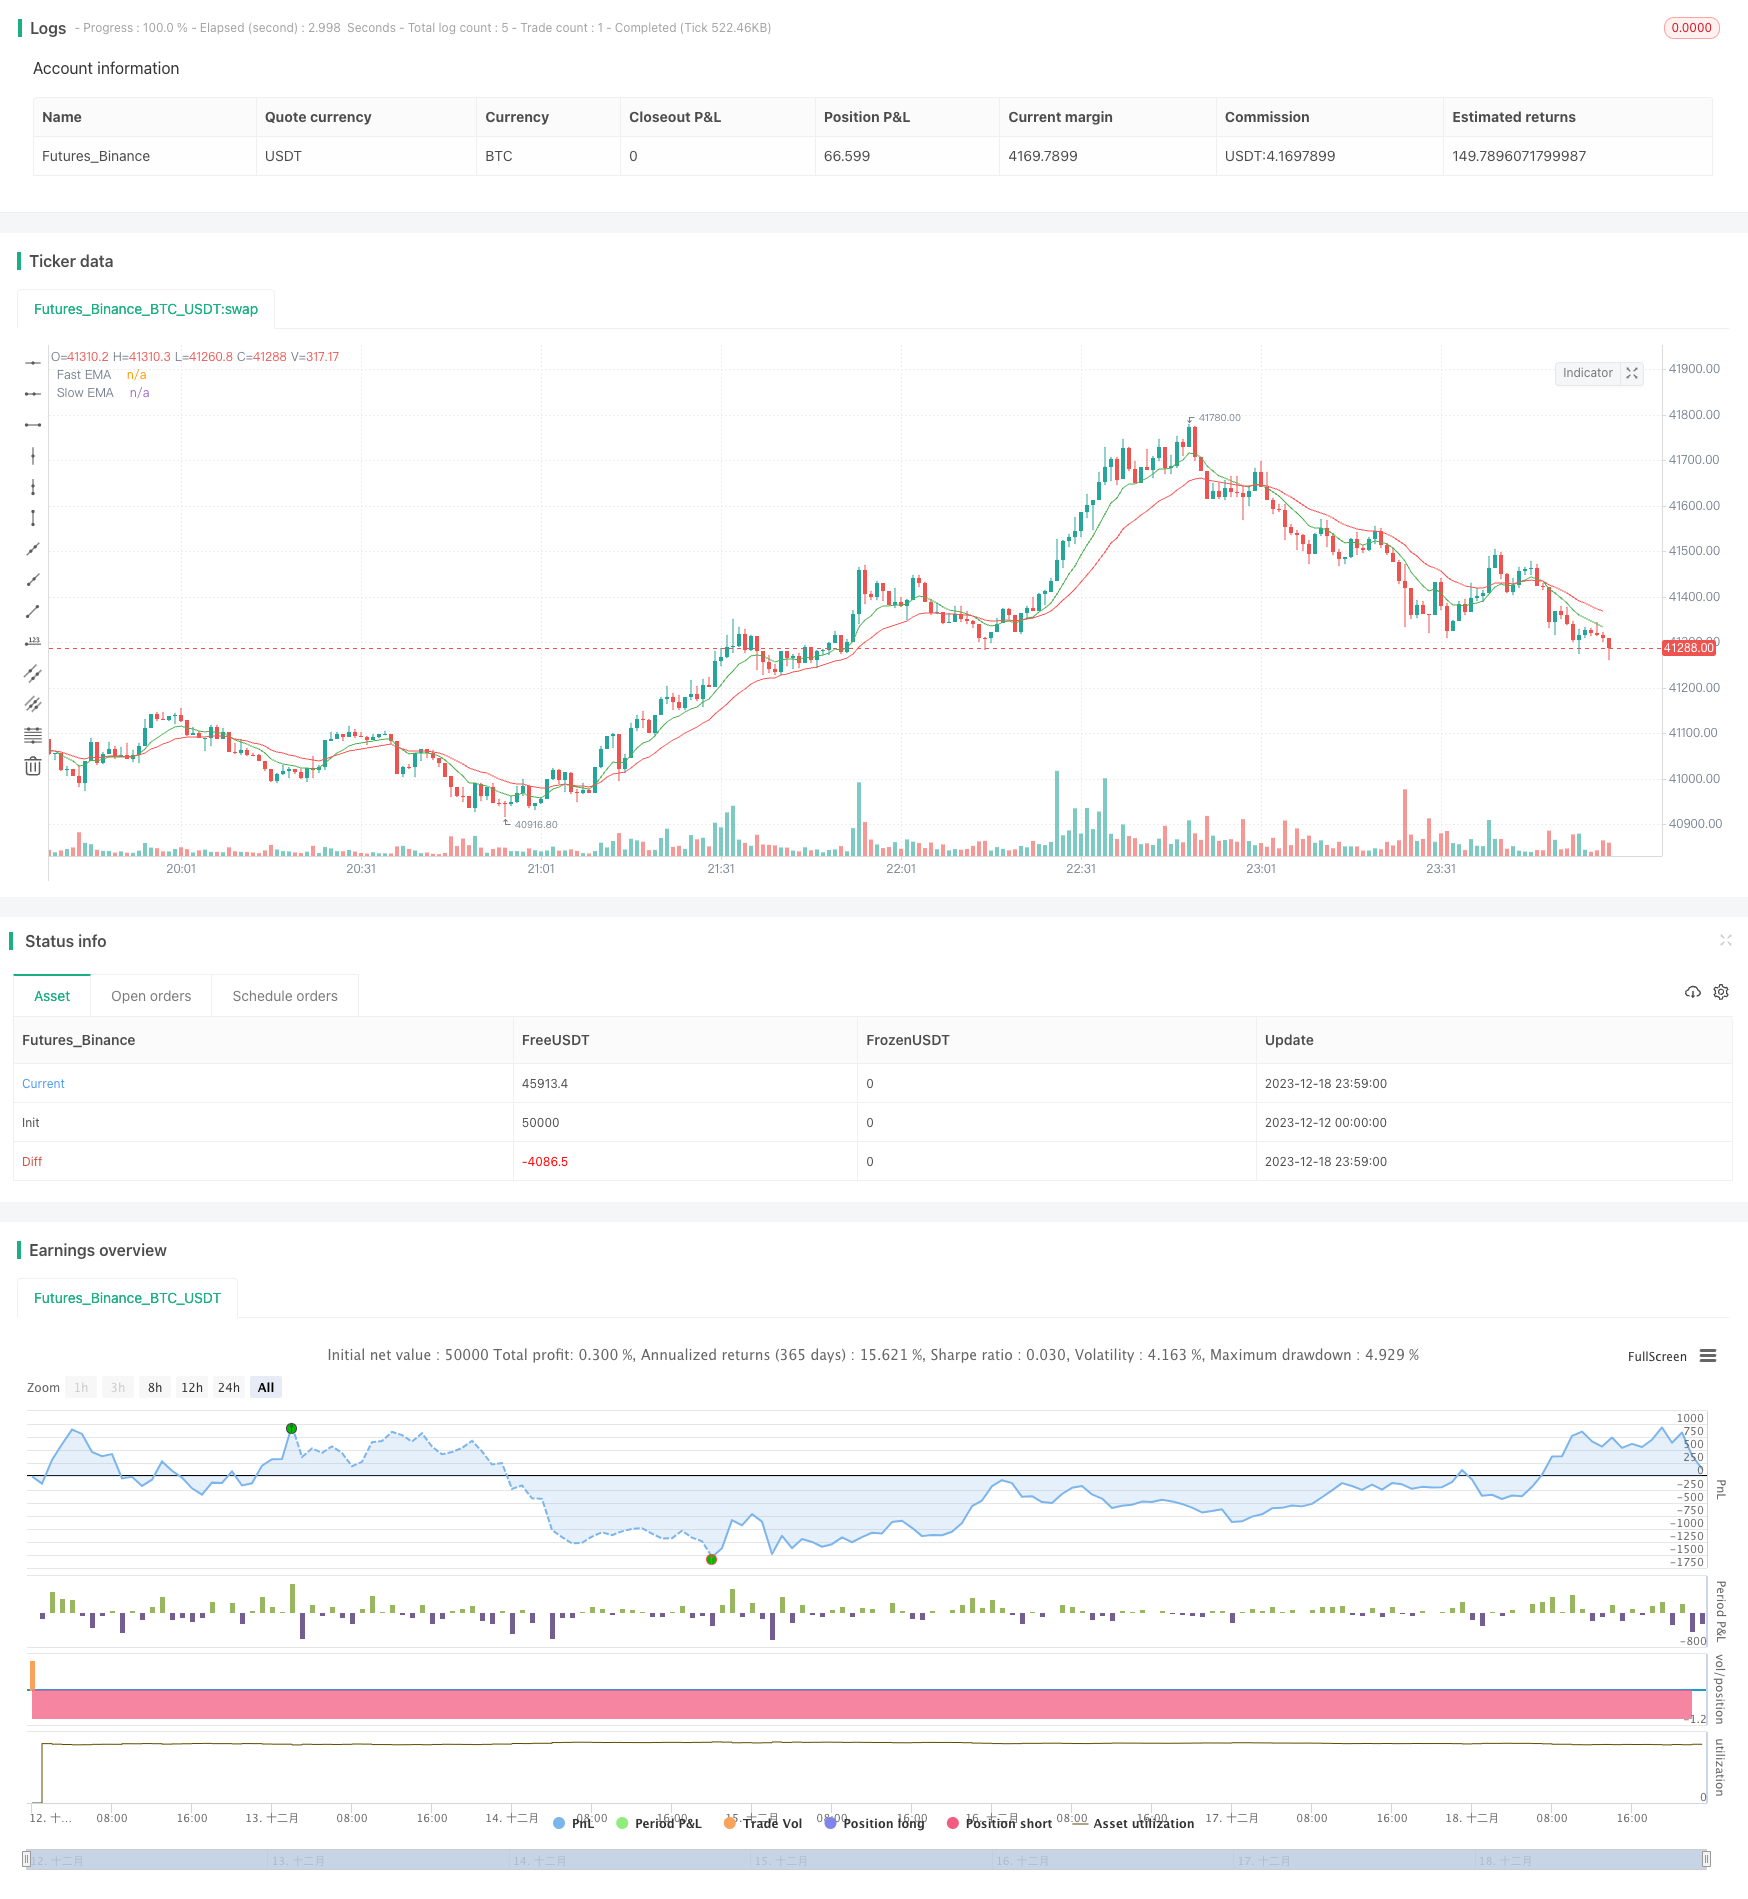
この戦略は,高速EMA (9期) と遅いEMA (21期) のクロスオーバーをエントリーシグナルとして利用し,利益を固定し,過度の引き下げを避けるために後続ストップ損失を組み込む.
戦略の論理
低速EMAが低速EMAを下から横切ると,買い信号が生成される.高速EMAが低速EMAを下から横切ると,売り信号が起動する.
入力すると,戦略はリアルタイムで最高値を追跡し,現在の価格が最高値を下回り2%になると,ストップ損失を誘発し,利益をロックします.
利点分析
- 中長期のトレンドを効果的に把握するために,EMAのトレンドフォローと信号生成能力を利用します.
- トレイリングストップ・ロスはほとんどの利益にロックされ,全利益が飲み込まれるのを避ける.
- 調整可能なEMAパラメータは,異なる市場環境に対応する
- 購入・販売のシグナルに関する明確な規則,実行が簡単
リスク分析
- EMAは遅れている 短期的な機会を逃すかもしれない
- 誤ったストップ距離の設定は,損失を早急に停止したり,無効にする可能性があります.
- パラメータと市場の不一致は,過剰な取引または不十分な信号を引き起こす可能性があります.
リスク対策
- 適切な EMA パラメータの組み合わせを選択する
- ストップ損失パラメータをテストし評価する
- パラメータを市場の変動動態に合わせて調整する
オプティマイゼーションの方向性
- 市場変動とリスク意欲に基づいて,後続停止距離を動的に調整する
- 偽信号を減らすために他のフィルターを追加します.
- EMA 期間のパラメータを最適化
- 逆トレンド取引を避けるためにトレンド指標を組み込む
結論
この戦略は,トレンド識別とリスク管理の利点を統合している.パラメータ調整と最適化によって,異なる市場タイプと取引手段に適応することができ,さらなるテストと実践に値する.
/*backtest
start: 2023-12-12 00:00:00
end: 2023-12-19 00:00:00
period: 1m
basePeriod: 1m
exchanges: [{"eid":"Futures_Binance","currency":"BTC_USDT"}]
*/

//@version=4
strategy("EMA Crossover with Trailing Stop-Loss", overlay=true)

fastEMA = ema(close, 9)
slowEMA = ema(close, 21)

// Entry conditions
longCondition = crossover(fastEMA, slowEMA)
shortCondition = crossunder(fastEMA, slowEMA)

// Trailing stop-loss calculation
var float trailingStop = na
var float highestHigh = na

if (longCondition)
    highestHigh := na
    trailingStop := na

if (longCondition and high > highestHigh)
    highestHigh := high

if (strategy.position_size > 0)
    trailingStop := highestHigh * (1 - 0.02)  // Adjust the trailing percentage as needed

// Execute trades
strategy.entry("Long", strategy.long, when=longCondition)
strategy.entry("Short", strategy.short, when=shortCondition)

// Apply trailing stop-loss to long positions
strategy.exit("Long", from_entry="Long", loss=trailingStop)

// Plot EMAs and Trailing Stop-Loss
plot(fastEMA, color=color.green, title="Fast EMA")
plot(slowEMA, color=color.red, title="Slow EMA")
plot(trailingStop, color=color.orange, title="Trailing Stop-Loss", linewidth=2)
もっと
- 相対強度指数と移動平均のクロスオーバー戦略
- 振動するモメンタム逆転移動平均クロスオーバー戦略
- RSI ボリンガーバンド TP/SL戦略
- イチモク クラウド 量子 スカルピング 戦略
- エルゴティック・ダブルレール逆MACD量的な取引戦略
- 二重指標の定量戦略
- インタラクティブなモデルベースのキャンドルスティック取引戦略
- DEMA MACD 組み合わせ戦略
- イチモク・イイン・ヤング キャンドルスタイク ブレイク戦略
- 流動性に基づくトレンド戦略 - 流動トレンド指針に基づく量取引戦略
- SMA RSI & 突然の買い売る戦略
- 2つの要素による量的な逆転追跡戦略
- エーラーズ 瞬間のトレンドライン戦略
- 双重EMAのゴールデンクロスブレークスルー戦略
- トールとベアパワー 移動平均取引戦略
- 定量戦略:ボリンジャー帯 RSI CCIクロスオーバー戦略
- VWAPの脱出追跡戦略
- モメント・リバーサル・トレーディング・戦略
- モメント トラッキング トレーディング戦略
- 複数の重度の移動平均値のトレンド戦略