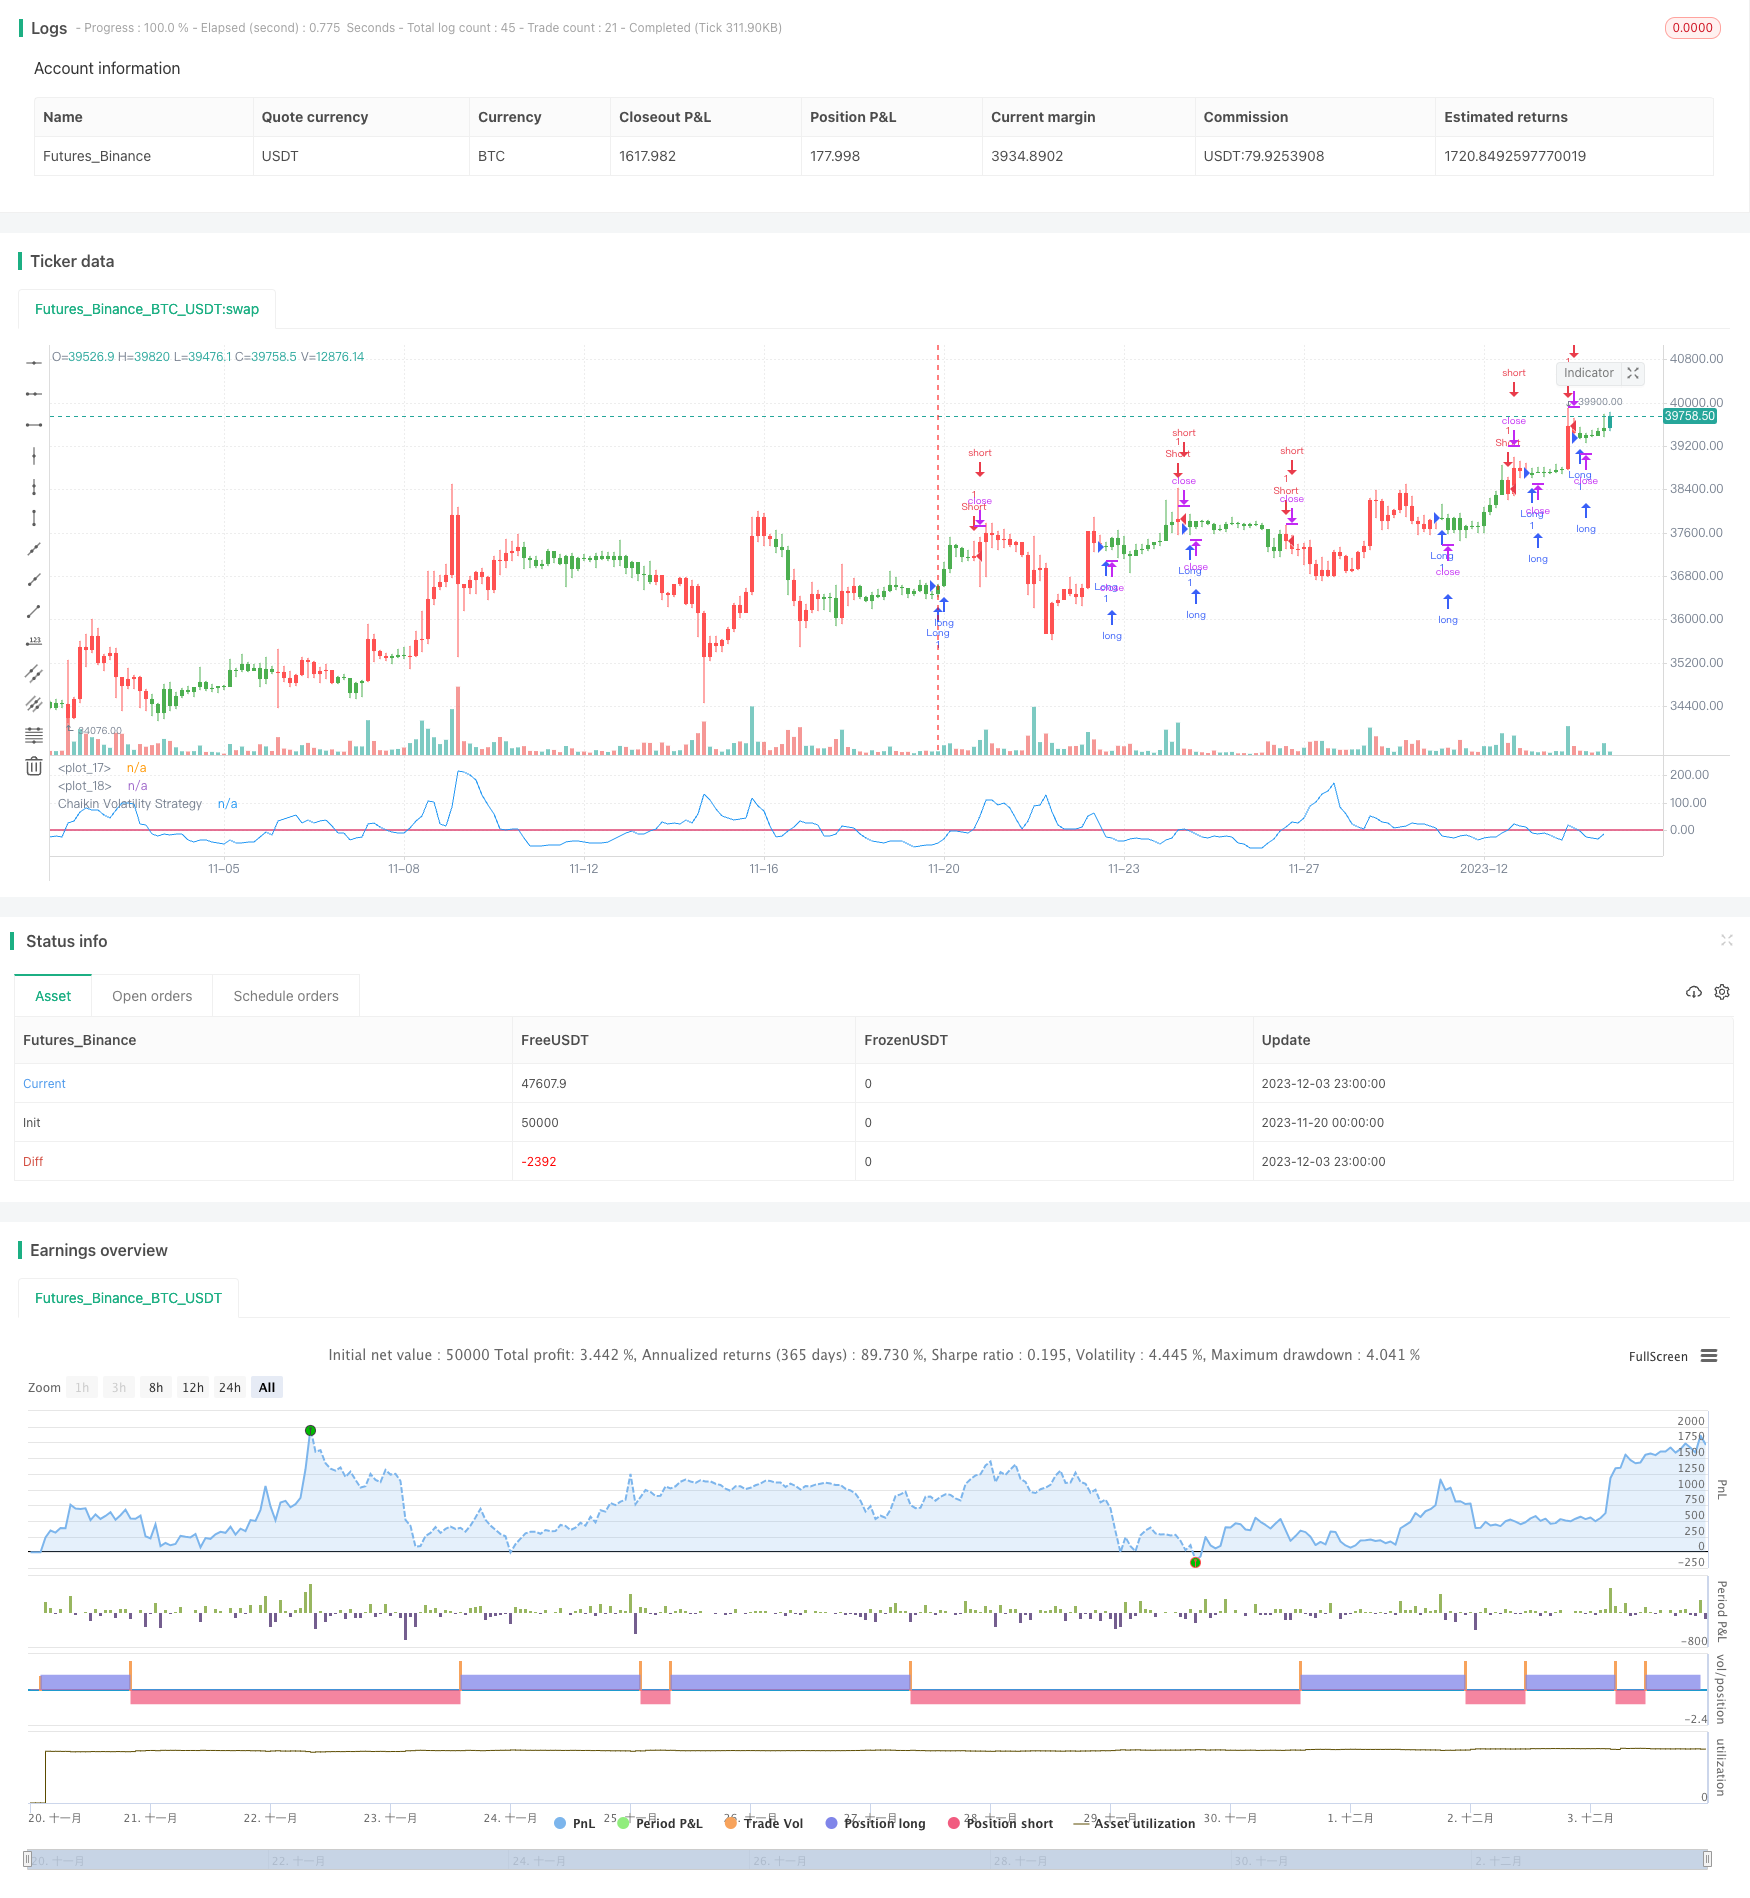
チェイキン・ボラティリティ・インディケーターに基づく短期取引戦略
作者: リン・ハーンチャオチャン, 日付: 2023-12-21 16:14:56タグ:

概要
この戦略は,チャイキン・ボラティリティ・インディケーターに基づいて短期間の取引システムを設計し,短期間の市場変動を把握する.主なアイデアは,チャイキン・ボラティリティ・インディケーターが指定された
戦略の論理
チャイキン波動指標は,証券の最高価格と最低価格の差を測定することによって波動性を定量化します.高価格と低価格の間の範囲が拡大すると,波動性が上昇することを示します.
この戦略の具体的な論理は
- チェイキン波動性指標 (xROC_EMA) を計算する
- トリガースロージックを設定する (Trigger)
- xROC_EMA が Trigger の上を横切ったとき,ロング; xROC_EMA が Trigger の下を横切ったとき,ショート
- 逆方向の取引のオプション
利点分析
この戦略の利点は以下の通りです.
- 短期取引に適した迅速な対応
- 相対的に少額で,ある程度の資本管理効果
- シンプルで理解しやすい
- 異なる市場環境のための柔軟なパラメータ調整
リスク分析
リスクもあります:
- 高い取引頻度は,過剰取引のリスクを増加させる.
- 長さやトリガーのようなパラメータは,オーバーフィットすることができます
- 取引が逆転した場合の損失に脆弱である
- 市場騒音を効果的にフィルタリングできず
解決策:
- 取引頻度を制御するパラメータを調整する
- オーバーフィッティングを防ぐためにパラメータを最適化
- 価格のリトラセーションを許可するために,より広いストップを使用します.
- 偽信号を減らすためにフィルターを追加する
最適化
戦略は以下によって改善できます.
- 傾向とサポートレベルを特定するための構造指標を組み込む
- 音量や移動平均値などのフィルターを追加して,ウィップソウを減らす
- 変化する市場状況に基づくパラメータの動的調整
- ストップ・ロスのメカニズムを強化する.例えば,トライリング・ストップやキャンドリア・エグジットなどにより多くの利益を得る.
結論
この戦略は,短期取引に適したシンプルで明確な論理を持っています.柔軟なパラメータは,必要に応じて調整できます.過剰なフィッティングと高い取引頻度のリスクがあります.さらなる最適化は,より安定したパフォーマンスのために戦略をより堅牢にすることができます.
/*backtest
start: 2023-11-20 00:00:00
end: 2023-12-04 00:00:00
period: 3h
basePeriod: 15m
exchanges: [{"eid":"Futures_Binance","currency":"BTC_USDT"}]
*/

//@version = 2
////////////////////////////////////////////////////////////
//  Copyright by HPotter v1.0 01/12/2016
// Chaikin's Volatility indicator compares the spread between a security's
// high and low prices. It quantifies volatility as a widening of the range
// between the high and the low price.
// You can use in the xPrice1 and xPrice2 any series: Open, High, Low, Close, HL2,
// HLC3, OHLC4 and ect...
// You can change long to short in the Input Settings
// Please, use it only for learning or paper trading. Do not for real trading.
///////////////////////////////////////////////////////////
strategy(title="Chaikin Volatility Strategy Backtest")
Length = input(10, minval=1)
ROCLength = input(12, minval=1)
Trigger = input(0, minval=1)
reverse = input(false, title="Trade reverse")
hline(0, color=purple, linestyle=line)
hline(Trigger, color=red, linestyle=line)
xPrice1 = high
xPrice2 = low
xPrice = xPrice1 - xPrice2
xROC_EMA = roc(ema(xPrice, Length), ROCLength)
pos = iff(xROC_EMA < Trigger, 1,
	   iff(xROC_EMA > Trigger, -1, nz(pos[1], 0)))
possig = iff(reverse and pos == 1, -1,
         iff(reverse and pos == -1, 1, pos))
if (possig == 1)
    strategy.entry("Long", strategy.long)
if (possig == -1)
    strategy.entry("Short", strategy.short)
barcolor(pos == -1 ? red: pos == 1 ? green : blue )
plot(xROC_EMA, color=blue, title="Chaikin Volatility Strategy")
もっと
- 定量的な取引価格突破戦略
- エラーズ・フィッシャーストカスティック相対活力指数戦略
- 二重モメンタムブレークスルーと波動性フィルタリング アルゴリズム取引戦略
- 複数移動平均の包括的戦略
- 価格逆転RSIコンボ戦略
- 雲雲双移動平均突破戦略
- MACD ゴールデンクロス デスクロス トレンド 戦略をフォロー
- カメ の 傾向 に 従う 戦略
- 双重確認 ドンチアンチャンネル トレンド戦略
- 多因子モデルに基づくモメント逆転戦略
- 2つのMAのクロスオーバートレンド追跡戦略
- スーパートレンド トリプル戦略
- ダイナミック・トラッキング・ストップ・ロスの戦略
- ストップ・ロストとテイク・プロフィートの移動平均クロスオーバー戦略
- 移動平均をベースにした平均逆転逆転戦略
- Bollinger Bands をベースにした高周波取引戦略
- イチモク・クラウド・トレーディング戦略
- 二重底突破モデルに基づくモメンタム戦略
- ストカスティック・ヴォルテックス戦略
- 変動指数とストカスティックオシレーターに基づく多期取引戦略