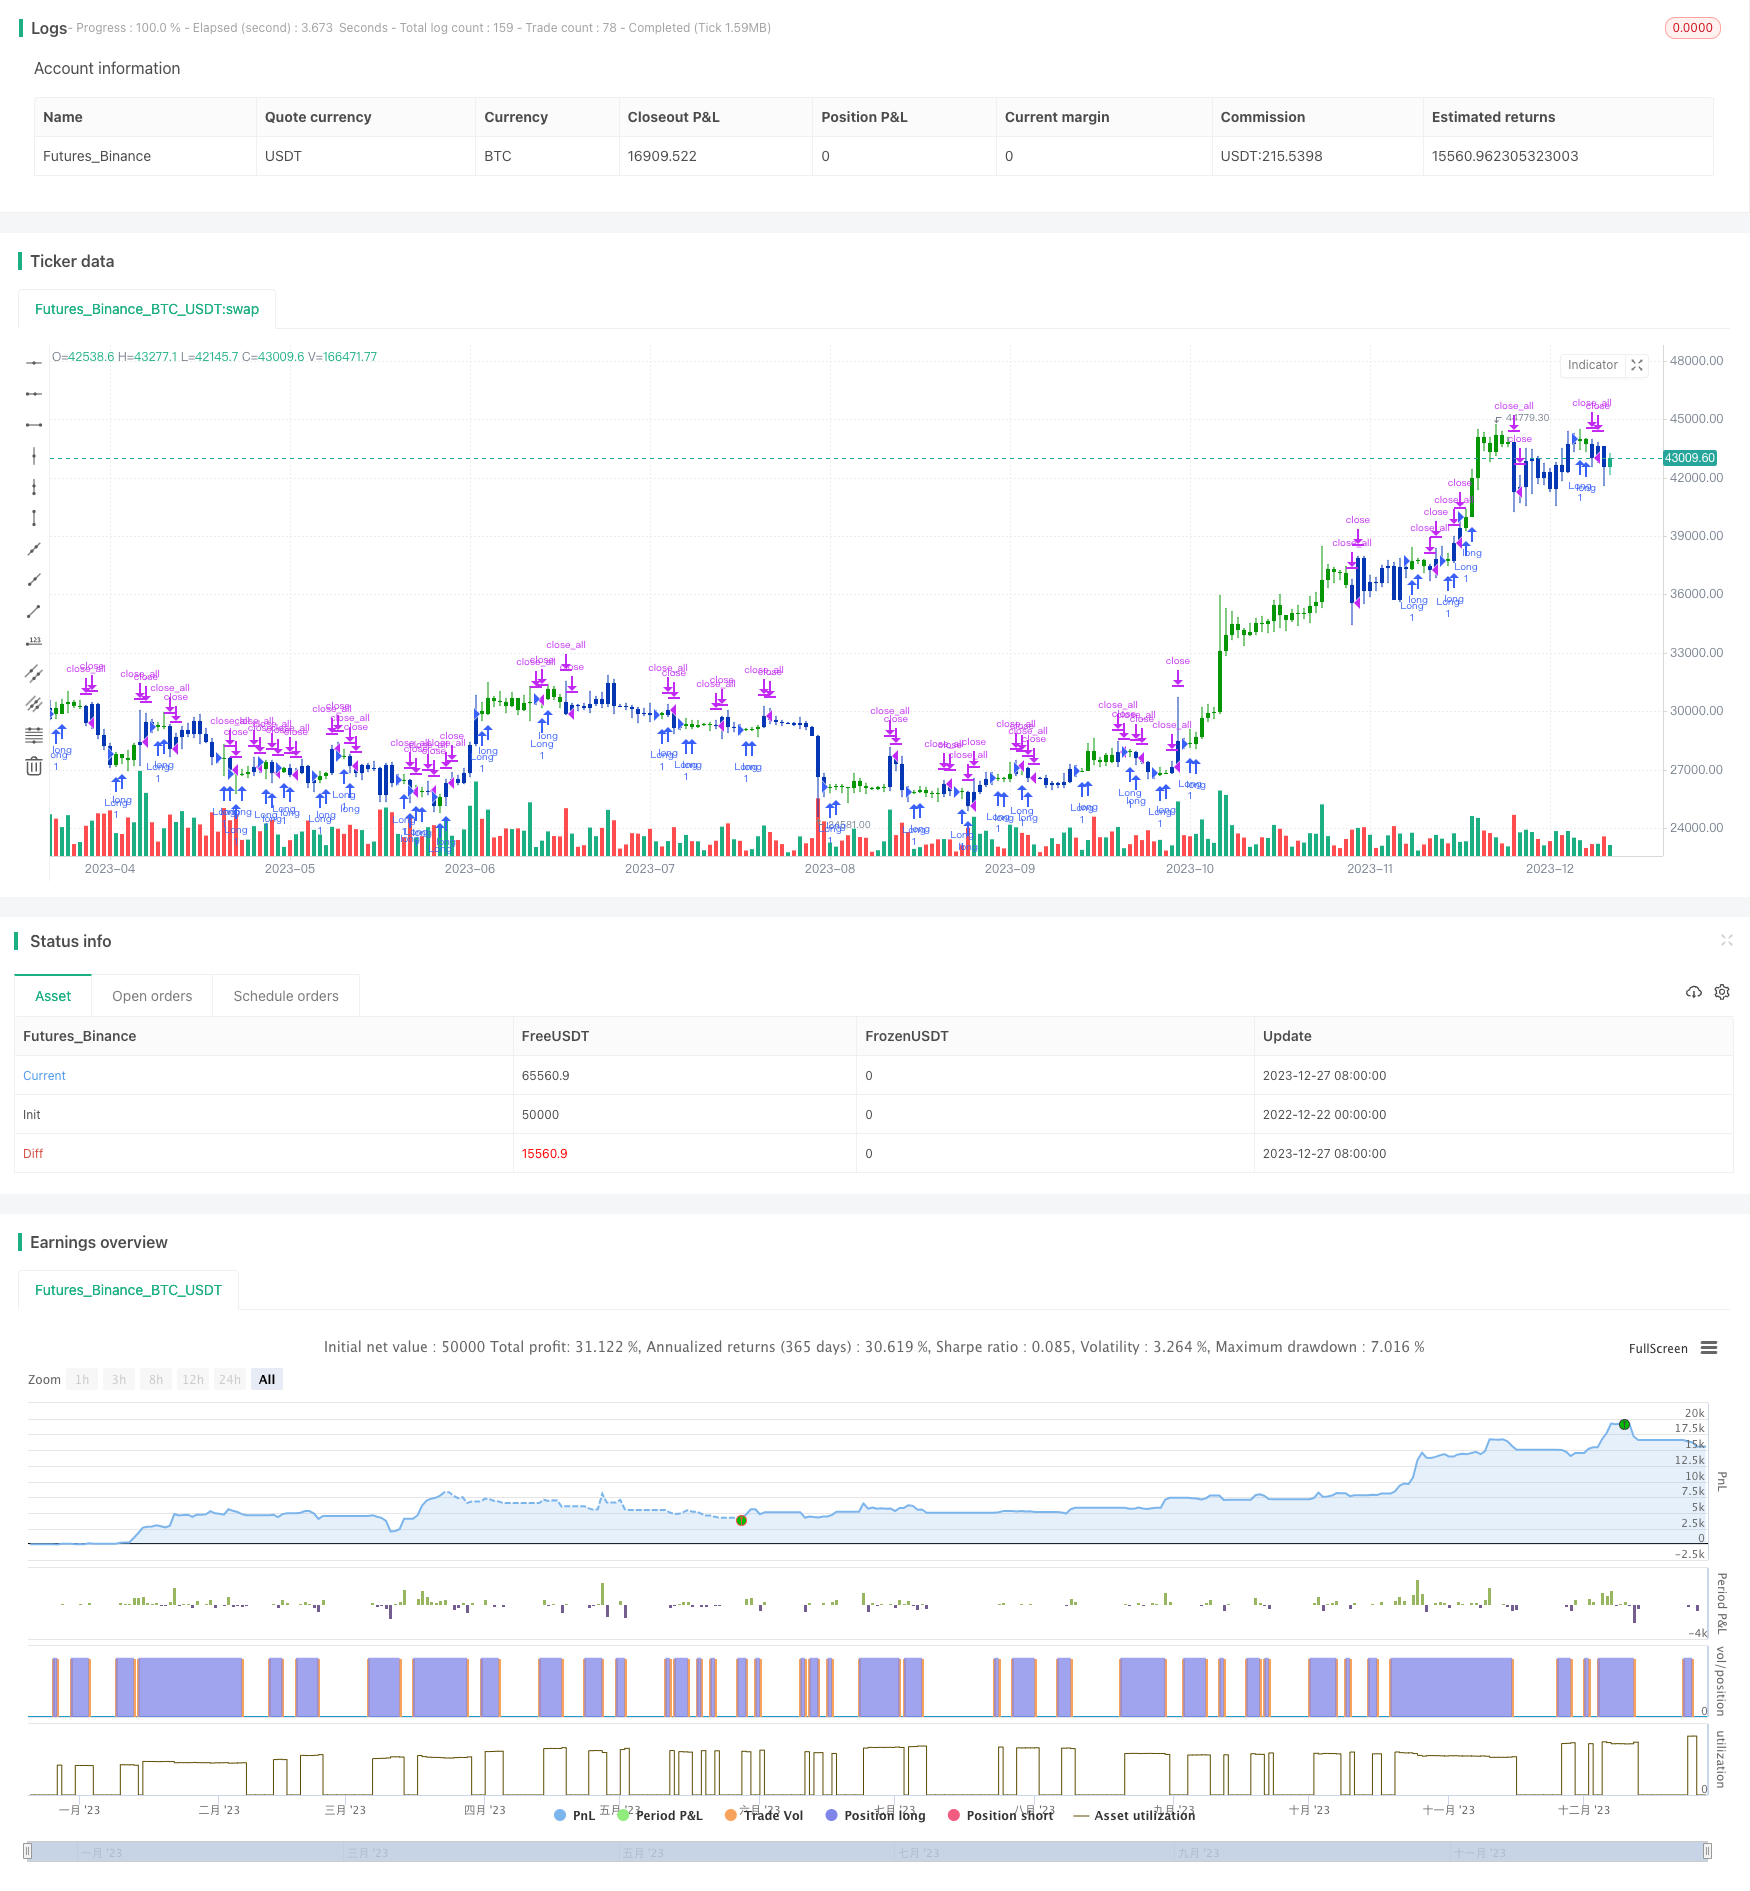
定量的な二重指標戦略
作者: リン・ハーンチャオチャン, 日付: 2023-12-29 16:29:21タグ:

概要
この戦略は,EMA指標とブルパワー指標を組み合わせた戦略である.戦略名には"量"と"双指数"のようなキーワードが含まれ,独立した2つの指標を使用するという特徴を強調する.
戦略の論理
戦略は2つの部分からなる.
-
2/20 EMA インディケーター.このインディケーターは2日間のEMAと20日間のEMAを計算します.価格はEMAを超えると購入信号を生成し,価格がEMAを下回ると販売信号を生成します.
-
Bull Power インディケーター. このインディケーターは,現在のバーと前のバーの関係に基づいて,上昇/下落力を計算します.牛/下落力が
値を超えると取引信号を生成します.
この2つの部分
利点分析
- 偽信号をフィルタリングするために指標を組み合わせる.単一指標は偽信号を生成する外部要因の影響を受けやすい.ダブルインジケータの組み合わせは互いに検証し,偽信号をフィルタリングし,信号品質を改善することができます.
- 調整可能なパラメータ. EMA の期間と Bull Power の
値は,異なる市場環境に適応するように調整できます. - シンプルで明快な論理です 戦略は2つの共通指標のみを使用し シンプルで明快な論理で 分かりやすく実行できます
リスク分析
- インディケーターの失敗リスク 組み合わせインディケーターを使用しているにもかかわらず,極端な市場状況は依然としてインディケーターの失敗を引き起こす可能性があります.
- パラメータ最適化リスク.不適切なパラメータ設定は,戦略のパフォーマンスを損なう,不十分なまたは過剰な取引につながる可能性があります.最適なパラメータを見つけるのに十分なテストが必要です.
オプティマイゼーションの方向性
- ストップ損失メカニズムを追加します. 移動またはバックストップ損失を設定して単一の取引損失を制御します.
- パラメータ設定を最適化する. パラメータの組み合わせをテストして,パフォーマンスの向上のために最適なパラメータを見つける.
- フィルタリング条件を追加します. 取引量や変動などの条件を追加して,ポジションを開くときに異常な市場条件をフィルタリングします.
結論
この戦略は,二重EMAとブルパワー指標を組み合わせることで取引決定を実現する.単一指標戦略と比較して,この組み合わせは,カスタマイズ可能なパラメータを維持しながら,偽信号を効果的に排除する.結論として,この戦略は,定量的な取引戦略として単純性と柔軟性,そして強力な実用性を持っています.
/*backtest
start: 2022-12-22 00:00:00
end: 2023-12-28 00:00:00
period: 1d
basePeriod: 1h
exchanges: [{"eid":"Futures_Binance","currency":"BTC_USDT"}]
*/

//@version=5
////////////////////////////////////////////////////////////
//  Copyright by HPotter v1.0 12/07/2022
// This is combo strategies for get a cumulative signal.
//
// First strategy
// This indicator plots 2/20 exponential moving average. For the Mov
// Avg X 2/20 Indicator, the EMA bar will be painted when the Alert criteria is met.
//
// Second strategy
//  Bull Power Indicator
//  To get more information please see "Bull And Bear Balance Indicator"
//  by Vadim Gimelfarb.
//
// WARNING:
// - For purpose educate only
// - This script to change bars colors.
////////////////////////////////////////////////////////////
EMA20(Length) =>
    pos = 0.0
    xPrice = close
    xXA = ta.ema(xPrice, Length)
    nHH = math.max(high, high[1])
    nLL = math.min(low, low[1])
    nXS = nLL > xXA or nHH < xXA ? nLL : nHH
    iff_1 = nXS < close[1] ? 1 : nz(pos[1], 0)
    pos := nXS > close[1] ? -1 : iff_1
    pos


BP(SellLevel) =>
    pos = 0.0
    value = close < open ?
             close[1] < open ?  math.max(high - close[1], close - low): math.max(high - open, close - low):
              close > open ?
               close[1] > open ?  high - low : math.max(open - close[1], high - low) :
                 high - close > close - low ?
                  close[1] < open ? math.max(high - close[1], close - low) : high - open :
                   high - close < close - low ?
                     close[1] > open ?  high - low : math.max(open - close, high - low) :
                      close[1] > open ? math.max(high - open, close - low) :
                       close[1] < open? math.max(open - close, high - low): high - low
    val2 = ta.sma(value, 15)
    pos :=  val2 > SellLevel ? 1 : -1
    pos

strategy(title='Combo 2/20 EMA & Bull Power', shorttitle='Combo', overlay=true)
var I1 = '●═════ 2/20 EMA ═════●'
Length = input.int(14, minval=1, group=I1)
var I2 = '●═════  Bull Power ═════●'
SellLevel = input.float(-15, step=0.01, group=I2)
var misc = '●═════ MISC ═════●'
reverse = input.bool(false, title='Trade reverse', group=misc)
var timePeriodHeader = '●═════ Time Start ═════●'
d = input.int(1, title='From Day', minval=1, maxval=31, group=timePeriodHeader)
m = input.int(1, title='From Month', minval=1, maxval=12, group=timePeriodHeader)
y = input.int(2005, title='From Year', minval=0, group=timePeriodHeader)
StartTrade = time > timestamp(y, m, d, 00, 00) ? true : false
posEMA20 = EMA20(Length)
prePosBP = BP(SellLevel)
iff_1 = posEMA20 == -1 and prePosBP == -1 and StartTrade ? -1 : 0
pos = posEMA20 == 1 and prePosBP == 1 and StartTrade ? 1 : iff_1
iff_2 = reverse and pos == -1 ? 1 : pos
possig = reverse and pos == 1 ? -1 : iff_2
if possig == 1
    strategy.entry('Long', strategy.long)
if possig == -1
    strategy.entry('Short', strategy.short)
if possig == 0
    strategy.close_all()
barcolor(possig == -1 ? #b50404 : possig == 1 ? #079605 : #0536b3)
もっと
- BankNifty スーパートレンド トレーディング戦略
- 臨時地帯戦略
- ストップ・損失を後押しするダブル移動平均戦略
- 複数のタイムフレームのモメンタムブレイク戦略
- ピボットポイント ゴールデン比 高いものを買う 低いものを売る戦略
- シンプル・ムービング・メアディアに基づくトレード・戦略
- 2つの移動平均ボリンガー帯 MACD取引戦略
- Bollinger Bands と RSI のクロスオーバー 戦略
- QQEとMAをベースにした戦略をフォローする傾向
- 量重量平均価格戦略
- モメント トラッキング 戦略
- RSI インディケーター改善取引戦略
- トレンド逆転モメント指標 クロスオーバー追跡戦略
- 複数のタイムフレームのブレイクアウト戦略
- 勢いと資金流の交差点 キャッシング戦略
- トレンド戦略をフォローするダイナミックな収益
- 10EMA ダブルクロストレンド追跡戦略
- ダイナミックピボットポイントバックテスト戦略
- 双重EMAクロスオーバートレンド戦略
- 固定型ローリング CVDVWAP 信号戦略