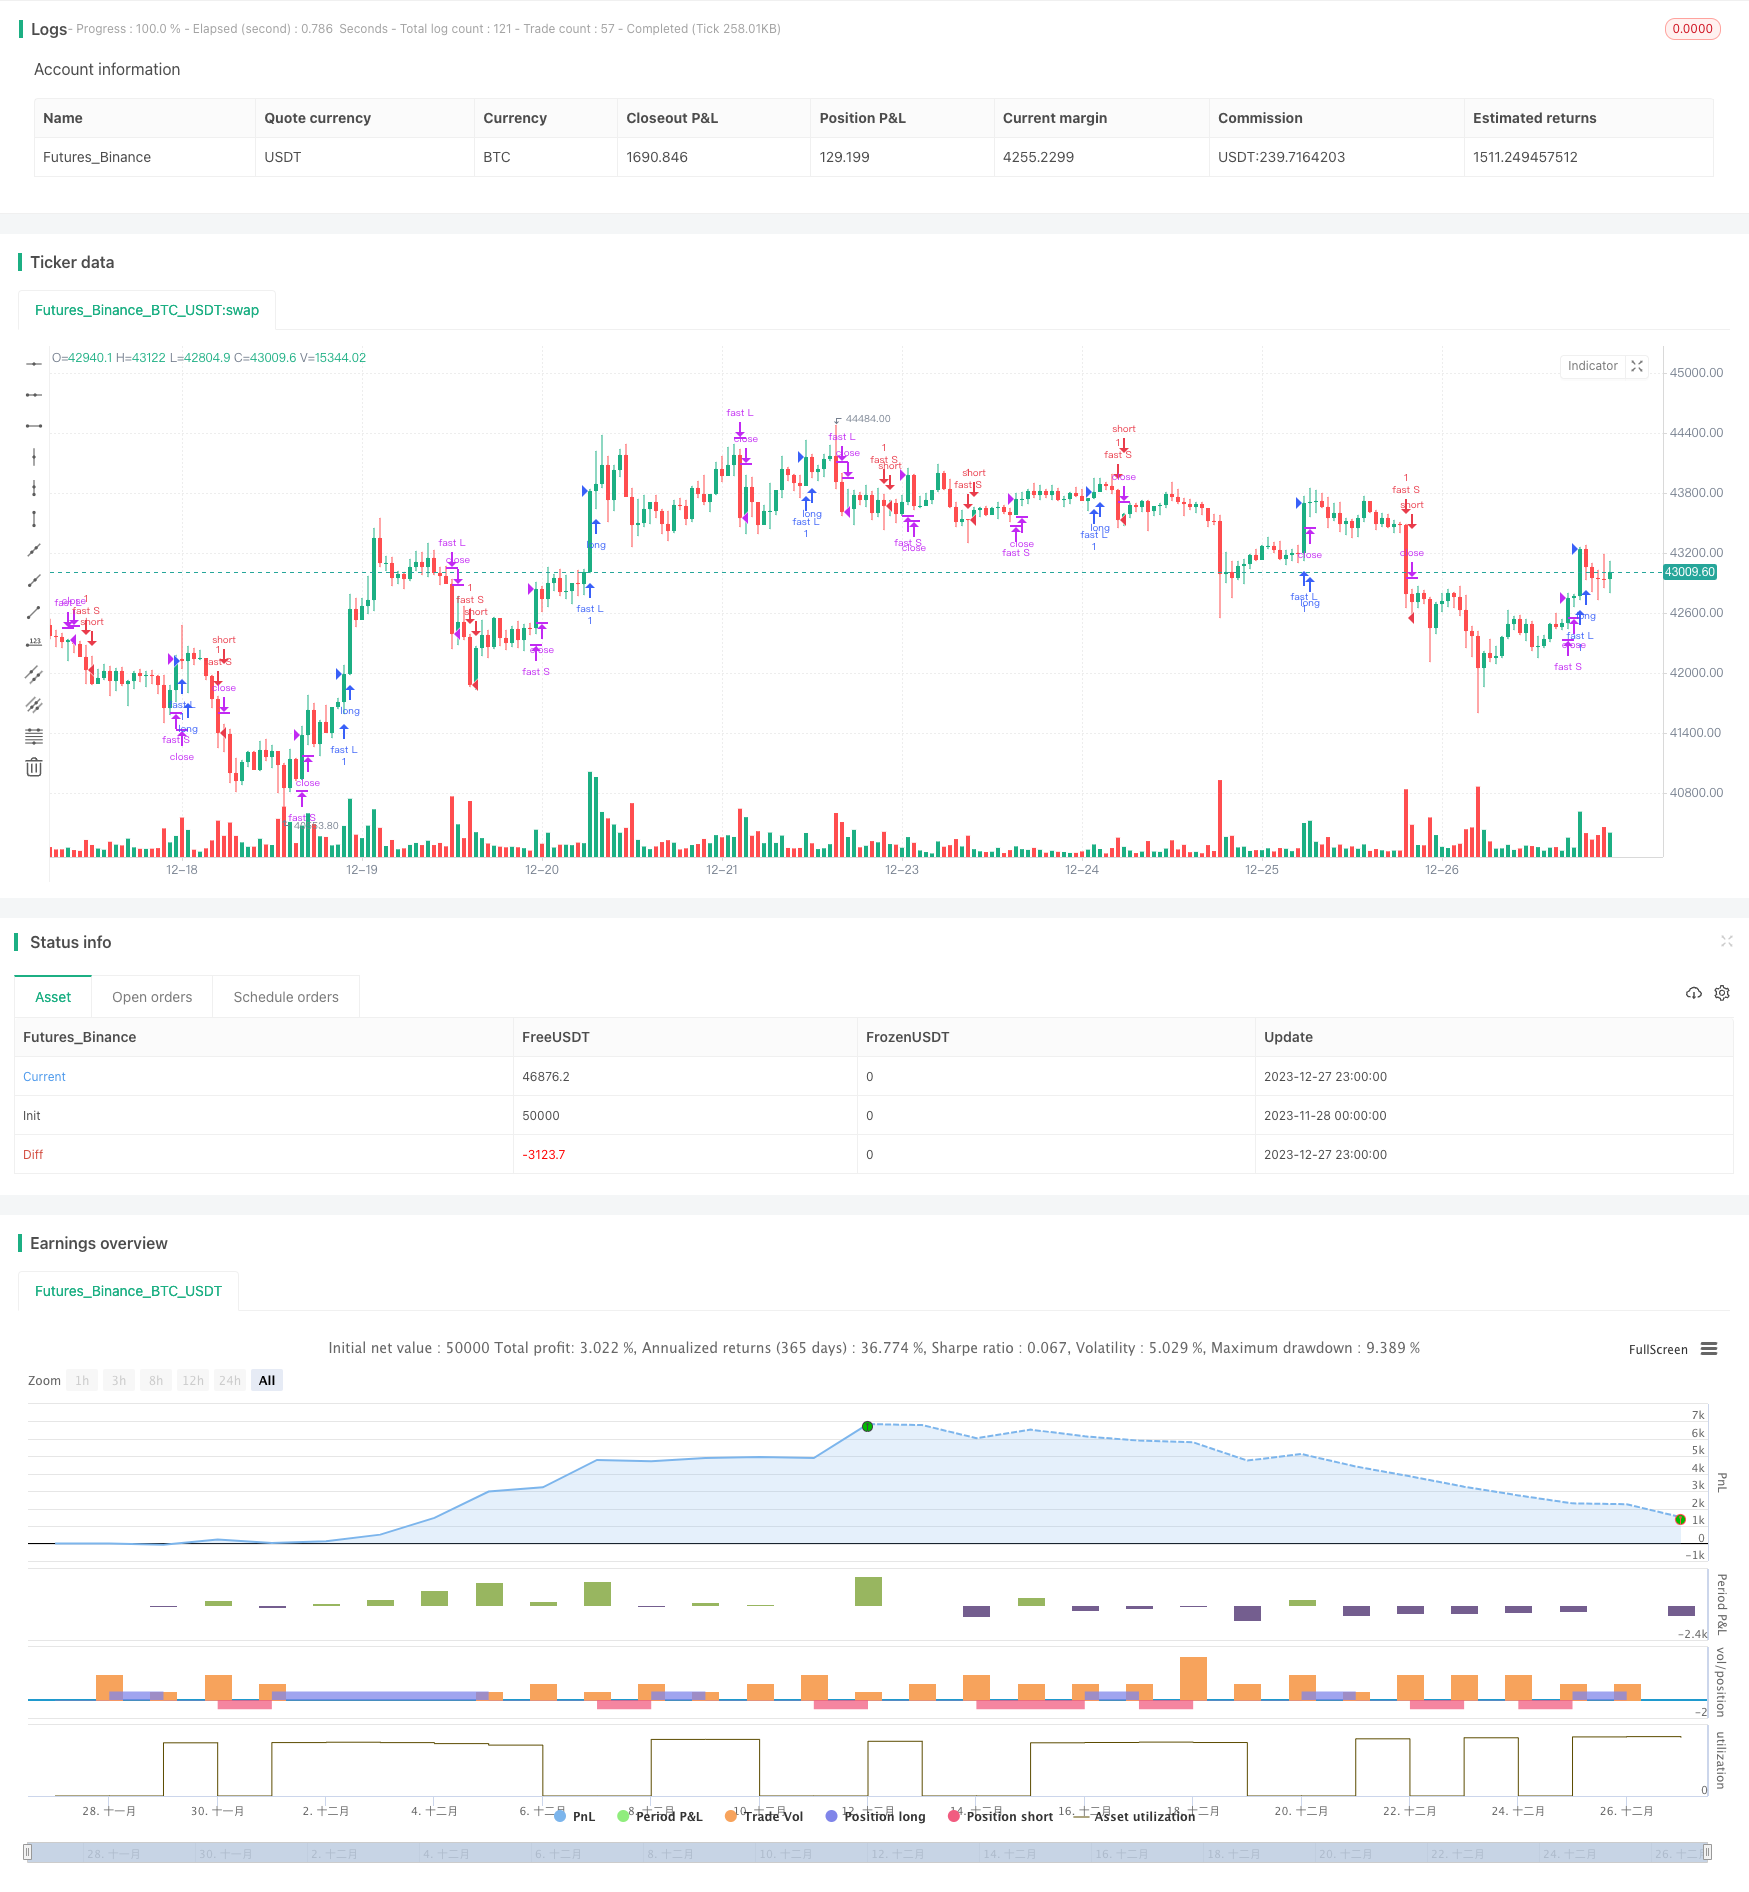
シンプル・ムービング・メアディアに基づくトレード・戦略
作者: リン・ハーンチャオチャン, 日時: 2023-12-29 16:45:51タグ:

概要
この戦略は,異なるパラメータを持つ単純な移動平均値の2つのグループを計算し,それらをポジションを開閉するためのシグナルとして使用することで利益を生む.この戦略は,1983年にアメリカントレーダーリチャード・デニスによって最初に提案された.単純なルールを遵守することで,安定した利益を達成し,カーティス・フェイトによってさらに普及させられ,広く"亀取引戦略"として知られる.
原則
この戦略は,同時に,2つのグループである高速線と遅い線を計算する.高速線パラメータは,開設ポジションの20日と閉じるポジションの10日に設定されている.遅い線パラメータは,それぞれ55日と20日である.価格が高速線の開設期間の最高値を超えると,それはロング信号を誘発する.価格が高速線の開設期間の最低値を下回ると,それはショート信号を誘発する.同様に,価格が高速線の閉じる期間の最低値を下回ると,それはロングポジションを閉じる.価格が高速線の閉じる期間の最高値を突破すると,それはショートポジションを閉じる.遅い線は,高速線と同じロジックを持つ.
この戦略は,移動平均理論を基に利益を得ている.つまり,短期移動平均が長期平均を超えると,それは上昇信号とみなされる.下を横切ると,下向きの傾向を示す.この戦略の速い線と遅い線は同様の役割を果たします.
利点
- シンプルで明快なルールで 分かりやすく実行し 初心者にも適しています
- 取引の頻度を避け,ポジションの開設と閉じるための明確な基準
- 急速な移動平均と遅い移動平均を組み合わせることで,価格変動を平ら化し,より明確な取引信号を生成します.
- 複数のパラメータセットの使用はリスクを制御し,誤った取引を防ぐのに役立ちます.
- 長期的には安定した利益で リアルタイムの取引で証明されています
リスクと緩和策
- 戦略そのものは機械的であり,特殊な市場状況について判断することができないため,利益制限がある.
- 意思決定を助けるためにより多くの指標や機械学習モデルを組み込もうとする
- 遅れている指標としての移動平均値は,一定の遅延がある.
- 営業時間と営業時間を適度に短縮する
- 最大引き上げを制限できない.
- ストップ・ロスのポイントを設定する
オプティマイゼーションの方向性
- ストップ・ロスのモジュールを追加して最大引き上げを制御する
- シグナルをフィルターする他の指標を組み込む
- 移動平均パラメータを動的に調整する
- 異常データの影響を除去するためにデータ処理モジュールを追加
- 傾向を特定するために機械学習モデルを組み込む
概要
この戦略は,典型的なトレンドフォロー戦略である. 単純な二重移動平均値に基づいて取引規則を確立し,市場動向を追跡することで,安定した利益を達成する. 戦略は,明確な開示信号とライブ取引からの長期確認された利益で理解し,実行するのが簡単で,初心者にとって学習と研究に非常に適している. また,より複雑な定量的な取引の基礎を築く.さらなる最適化により,より優れたパフォーマンスにつながる.
/*backtest
start: 2023-11-28 00:00:00
end: 2023-12-28 00:00:00
period: 1h
basePeriod: 15m
exchanges: [{"eid":"Futures_Binance","currency":"BTC_USDT"}]
*/

//@version=2
//coded by tmr0
//original idea from «Way of the Turtle: The Secret Methods that Turned Ordinary People into Legendary Traders» (2007) CURTIS FAITH
strategy("20 years old Turtles strategy by tmr0", shorttitle = "Turtles", overlay=true)

enter_fast = input(20, minval=1)
exit_fast = input(10, minval=1)
enter_slow = input(55, minval=1)
exit_slow = input(20, minval=1)

fastL = highest(enter_fast)
fastLC = lowest(exit_fast)
fastS = lowest(enter_fast)
fastSC = highest(exit_fast)

slowL = highest(enter_slow)
slowLC = lowest(exit_slow)
slowS = lowest(enter_slow)
slowSC = highest(exit_slow)

enterL1 = high > fastL[1]
exitL1 = low <= fastLC[1]
enterS1 = low < fastS[1]
exitS1 = high >= fastSC[1]

enterL2 = high > slowL[1]
exitL2 = low <= slowLC[1]
enterS2 = low < slowS[1]
exitS2 = high >= slowSC[1]


//bgcolor(exitL1 or exitL2? red: enterL1 or enterL2? navy:white)

strategy.entry("fast L", strategy.long, when = enterL1)
strategy.entry("fast S", strategy.short, when = enterS1)
strategy.close("fast L", when = exitL1)
strategy.close("fast S", when = exitS1)

strategy.entry("slow L", strategy.long, when = enterL2)
strategy.entry("slow S", strategy.short, when = enterS2)
strategy.close("slow L", when = exitL2)
strategy.close("slow S", when = exitS2)
//zl=0
//z=strategy.netprofit / 37 * koef  //ежемесячная прибыль
//z=strategy.grossprofit/strategy.grossloss
//z1=plot (z, style=line, linewidth=3, color = z>zl?green:red, transp = 30)
//hline(zl, title="Zero", linewidth=1, color=gray, linestyle=dashed)
- 移動平均のクロスオーバー戦略の9種類
- ビナインOKX 永続的な自動ヘッジ
- 戦略を踏まえて ダイナミックなブレイクアウト傾向
- カルマンフィルターと平均逆転に基づいたトランシティブ比率取引戦略
- 逆線形回帰戦略
- BankNifty スーパートレンド トレーディング戦略
- 臨時地帯戦略
- ストップ・損失を後押しするダブル移動平均戦略
- 複数のタイムフレームのモメンタムブレイク戦略
- ピボットポイント ゴールデン比 高いものを買う 低いものを売る戦略
- 2つの移動平均ボリンガー帯 MACD取引戦略
- Bollinger Bands と RSI のクロスオーバー 戦略
- QQEとMAをベースにした戦略をフォローする傾向
- 量重量平均価格戦略
- 定量的な二重指標戦略
- モメント トラッキング 戦略
- RSI インディケーター改善取引戦略
- トレンド逆転モメント指標 クロスオーバー追跡戦略
- 複数のタイムフレームのブレイクアウト戦略
- 勢いと資金流の交差点 キャッシング戦略