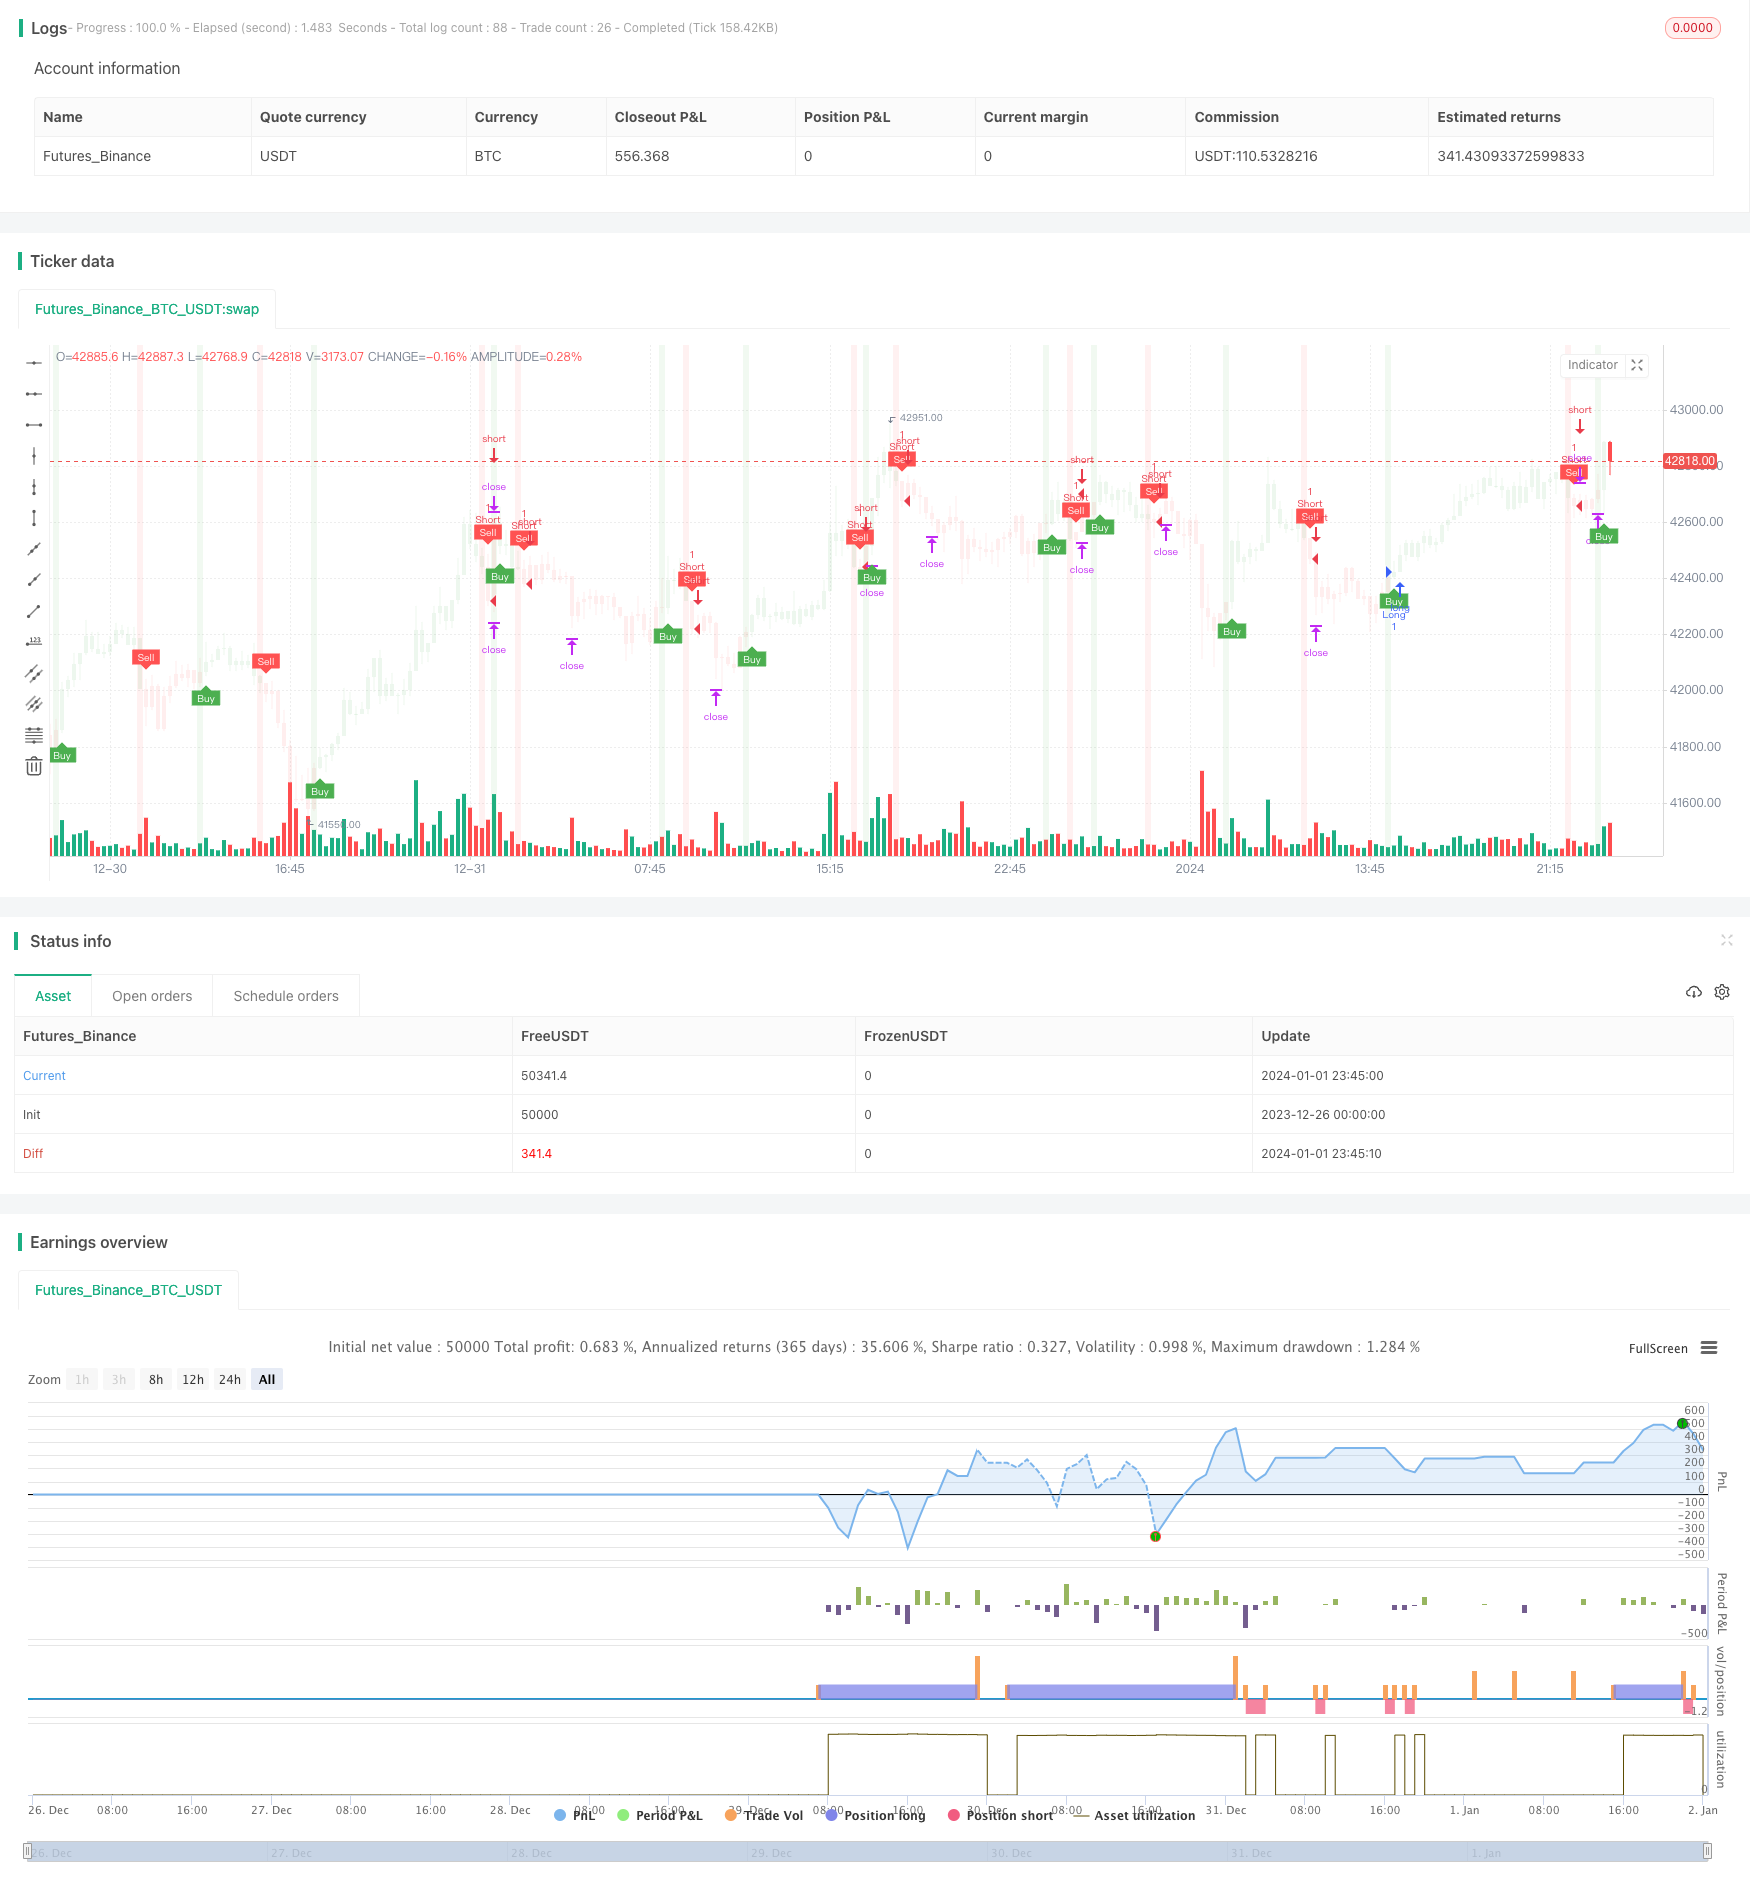
T3とATRをベースにした自動トレンド追跡戦略
作者: リン・ハーンチャオチャン,日付: 2024-01-03 11:58:25タグ:

概要
この戦略の核心は,トレンド方向とトレンドトレンドを追跡するためにT3指標スムーズ移動平均値とATR指標ダイナミックストップロスを利用することにある.この戦略は,トレンド追跡とトレンド逆転機会を組み合わせ,トレンド市場でより大きな利益を達成することを目的としています.
戦略の論理
この戦略は,価格のスムーズ移動平均を計算するためにT3指標を使用し,現在のサイクルの平均真の範囲を計算するためにATR指標を使用する.価格がATRダイナミックストップ損失を突破すると取引信号が生成される.特に,価格がATRストップ損失線を超えると購入信号が生成され,価格がATRストップ損失線を下回ると販売信号が生成される.
誤った信号をフィルタリングするために,戦略はさらに,信号を確認する前に価格もT3移動平均を突破する必要があります. さらに,戦略はリスク管理を実施するために,ATR値に基づいてストップロスを計算し,利益を得ています.
利点分析
従来の移動平均値と比較して,T3指標はより高い感度と遅延が少なく,価格動向の変化をより早く把握することができる.また,T3には,より正確でスムーズな移動平均値を提供できる数学的利点がある.
ATR値は現在の市場の変動とリスクレベルを反映する.ATRダイナミック・トラッキング・ストップと利益は,動向市場でのより大きな利益を達成し,不安定な市場での損失を削減するために,ポジションサイズを動的に調整することができます.
リスク分析
この戦略は,指標計算とリスクの仲介に依存している.さらに,T3スムーズ移動平均値とATR動的ストップは,急速な価格逆転の機会を逃す可能性がある遅れの問題がある.パラメータはそれに応じて調整または最適化のために他の指標と組み合わせることができます.
トレンドが変動し逆転すると,ストップ損失が破られ,より大きな損失につながる可能性があります.ストップ損失範囲を合理的に拡大するか,ハンドル番号などの他のパラメータを使用して探求することができます.
オプティマイゼーションの方向性
-
T3指標のパラメータを調整して 感度を最適化します
-
最適値を見つけるために,異なるATRサイクルパラメータをテストする.
-
最適なパラメータを決めるために リスク・報酬比を試してください
-
お金流指数などの他の指標をフィルター信号に追加します.
-
マシン・ラーニング方法を使って パラメータの組み合わせを自動的に最適化します
概要
この戦略は,T3スムーズ移動平均値のトレンドトラッキング能力とATR
/*backtest
start: 2023-12-26 00:00:00
end: 2024-01-02 00:00:00
period: 15m
basePeriod: 5m
exchanges: [{"eid":"Futures_Binance","currency":"BTC_USDT"}]
*/

//@version=5
strategy(title='NinjaView Example 1 (UTBA "QuantNomad" Strategy)', overlay=true)
T3 = input(100)//600
// Input for Long Settings
// Input for Long Settings


xPrice3 = close
xe1 = ta.ema(xPrice3, T3)
xe2 = ta.ema(xe1, T3)
xe3 = ta.ema(xe2, T3)
xe4 = ta.ema(xe3, T3)
xe5 = ta.ema(xe4, T3)
xe6 = ta.ema(xe5, T3)

b3 = 0.7
c1 = -b3*b3*b3
c2 = 3*b3*b3+3*b3*b3*b3
c3 = -6*b3*b3-3*b3-3*b3*b3*b3
c4 = 1+3*b3+b3*b3*b3+3*b3*b3
nT3Average = c1 * xe6 + c2 * xe5 + c3 * xe4 + c4 * xe3

//plot(nT3Average, color=color.white, title="T3")

// Buy Signal - Price is below T3 Average
buySignal3 = xPrice3 < nT3Average
sellSignal3 = xPrice3 > nT3Average
// Inputs
a = input(1, title='Key Value. "This changes the sensitivity"')
c = input(50, title='ATR Period')
h = input(true, title='Signals from Heikin Ashi Candles')
riskRewardRatio = input(1, title='Risk Reward Ratio')

xATR = ta.atr(c)
nLoss = a * xATR

src = h ? request.security(ticker.heikinashi(syminfo.tickerid), timeframe.period, close, lookahead=barmerge.lookahead_off) : close

xATRTrailingStop = 0.0
iff_1 = src > nz(xATRTrailingStop[1], 0) ? src - nLoss : src + nLoss
iff_2 = src < nz(xATRTrailingStop[1], 0) and src[1] < nz(xATRTrailingStop[1], 0) ? math.min(nz(xATRTrailingStop[1]), src + nLoss) : iff_1
xATRTrailingStop := src > nz(xATRTrailingStop[1], 0) and src[1] > nz(xATRTrailingStop[1], 0) ? math.max(nz(xATRTrailingStop[1]), src - nLoss) : iff_2

pos = 0
iff_3 = src[1] > nz(xATRTrailingStop[1], 0) and src < nz(xATRTrailingStop[1], 0) ? -1 : nz(pos[1], 0)
pos := src[1] < nz(xATRTrailingStop[1], 0) and src > nz(xATRTrailingStop[1], 0) ? 1 : iff_3

xcolor = pos == -1 ? color.red : pos == 1 ? color.green : color.blue

ema = ta.ema(src, 1)
above = ta.crossover(ema, xATRTrailingStop)
below = ta.crossunder(ema, xATRTrailingStop)

buy = src > xATRTrailingStop and above
sell = src < xATRTrailingStop and below

barbuy = src > xATRTrailingStop
barsell = src < xATRTrailingStop

plotshape(buy, title='Buy', text='Buy', style=shape.labelup, location=location.belowbar, color=color.new(color.green, 0), textcolor=color.new(color.white, 0), size=size.tiny)
plotshape(sell, title='Sell', text='Sell', style=shape.labeldown, location=location.abovebar, color=color.new(color.red, 0), textcolor=color.new(color.white, 0), size=size.tiny)

barcolor(barbuy ? color.new(color.green, 90) : na)
barcolor(barsell ? color.new(color.red, 90) : na)

var float entryPrice = na
var float takeProfitLong = na
var float stopLossLong = na
var float takeProfitShort = na
var float stopLossShort = na

if buy and buySignal3
    entryPrice := src
    takeProfitLong := entryPrice + nLoss * riskRewardRatio
    stopLossLong := entryPrice - nLoss
    takeProfitShort := na
    stopLossShort := na

if sell and sellSignal3
    entryPrice := src
    takeProfitShort := entryPrice - nLoss * riskRewardRatio
    stopLossShort := entryPrice + nLoss
    takeProfitLong := na
    stopLossLong := na

// Strategy order conditions
acct = "Sim101"
ticker = "ES 12-23"
qty = 1

OCOMarketLong = '{ "alert": "OCO Market Long", "account": "' + str.tostring(acct) + '", "ticker": "' + str.tostring(ticker) + '", "qty": "' + str.tostring(qty) + '", "take_profit_price": "' + str.tostring(takeProfitLong) + '", "stop_price": "' + str.tostring(stopLossLong) + '", "tif": "DAY" }'
OCOMarketShort = '{ "alert": "OCO Market Short", "account": "' + str.tostring(acct) + '", "ticker": "' + str.tostring(ticker) + '", "qty": "' + str.tostring(qty) + '", "take_profit_price": "' + str.tostring(takeProfitShort) + '", "stop_price": "' + str.tostring(stopLossShort) + '", "tif": "DAY" }'
CloseAll = '{ "alert": "Close All", "account": "' + str.tostring(acct) + '", "ticker": "' + str.tostring(ticker) + '" }'

strategy.entry("Long", strategy.long, when=buy and buySignal3, alert_message=OCOMarketLong)
strategy.entry("Short", strategy.short, when=sell and sellSignal3, alert_message=OCOMarketShort)

// Setting the take profit and stop loss for long trades
strategy.exit("Take Profit/Stop Loss", "Long", stop=stopLossLong, limit=takeProfitLong,alert_message=CloseAll)

// Setting the take profit and stop loss for short trades
strategy.exit("Take Profit/Stop Loss", "Short", stop=stopLossShort, limit=takeProfitShort,alert_message=CloseAll)

// Plot trade setup boxes
bgcolor(buy ? color.new(color.green, 90) : na, transp=0, offset=-1)
bgcolor(sell ? color.new(color.red, 90) : na, transp=0, offset=-1)

// longCondition = buy and not na(entryPrice)
// shortCondition = sell and not na(entryPrice)

// var line longTakeProfitLine = na
// var line longStopLossLine = na
// var line shortTakeProfitLine = na
// var line shortStopLossLine = na

// if longCondition
//     longTakeProfitLine := line.new(bar_index, takeProfitLong, bar_index + 1, takeProfitLong, color=color.green, width=2)
//     longStopLossLine := line.new(bar_index, stopLossLong, bar_index + 1, stopLossLong, color=color.red, width=2)
//     label.new(bar_index + 1, takeProfitLong, str.tostring(takeProfitLong, "#.#####"), color=color.green, style=label.style_none, textcolor=color.green, size=size.tiny)
//     label.new(bar_index + 1, stopLossLong, str.tostring(stopLossLong, "#.#####"), color=color.red, style=label.style_none, textcolor=color.red, size=size.tiny)

// if shortCondition
//     shortTakeProfitLine := line.new(bar_index, takeProfitShort, bar_index + 1, takeProfitShort, color=color.green, width=2)
//     shortStopLossLine := line.new(bar_index, stopLossShort, bar_index + 1, stopLossShort, color=color.red, width=2)
//     label.new(bar_index + 1, takeProfitShort, str.tostring(takeProfitShort, "#.#####"), color=color.green, style=label.style_none, textcolor=color.green, size=size.tiny)
//     label.new(bar_index + 1, stopLossShort, str.tostring(stopLossShort, "#.#####"), color=color.red, style=label.style_none, textcolor=color.red, size=size.tiny)

alertcondition(buy, 'UT Long', 'UT Long')
alertcondition(sell, 'UT Short', 'UT Short')
- ストップ損失追跡戦略を移動する
- Gann Me 分析指標に基づく短期トレンド追跡戦略
- ガウスの移動平均取引戦略
- アダプティブ・カウフマン 移動平均 トレンド 戦略
- バンドパスフィルタリングトレンド抽出戦略
- 二重逆転高低戦略
- ハイピング 移動平均トレンド戦略
- マルチタイムフレーム移動平均値とMACDをベースとした長期・短期開拓戦略
- モメント インディケーター RSI リバーサル 取引戦略
- ダブル・ボリンジャー・バンド・ブレークアウト戦略
- ATRチャンネルブレイク トレンドフォロー戦略
- MACD 200 日間移動平均クロスオーバー取引戦略
- ゴールデンクロス 上昇傾向追跡戦略
- 双 EMA 交差振動追跡戦略
- 硬さ 突破策
- 横向突破振動戦略
- RSI インディケーターとエングロフィング パターンに基づく定量的な取引戦略
- Bollinger Bands ATR トレイリングストップ戦略
- 日々の脱出戦略
- 定量取引に基づくシグナル対ノイズ移動平均取引戦略