容量エネルギー主導戦略
作者: リン・ハーンチャオチャン,日付: 2024-01-04 15時38分54秒タグ:

概要
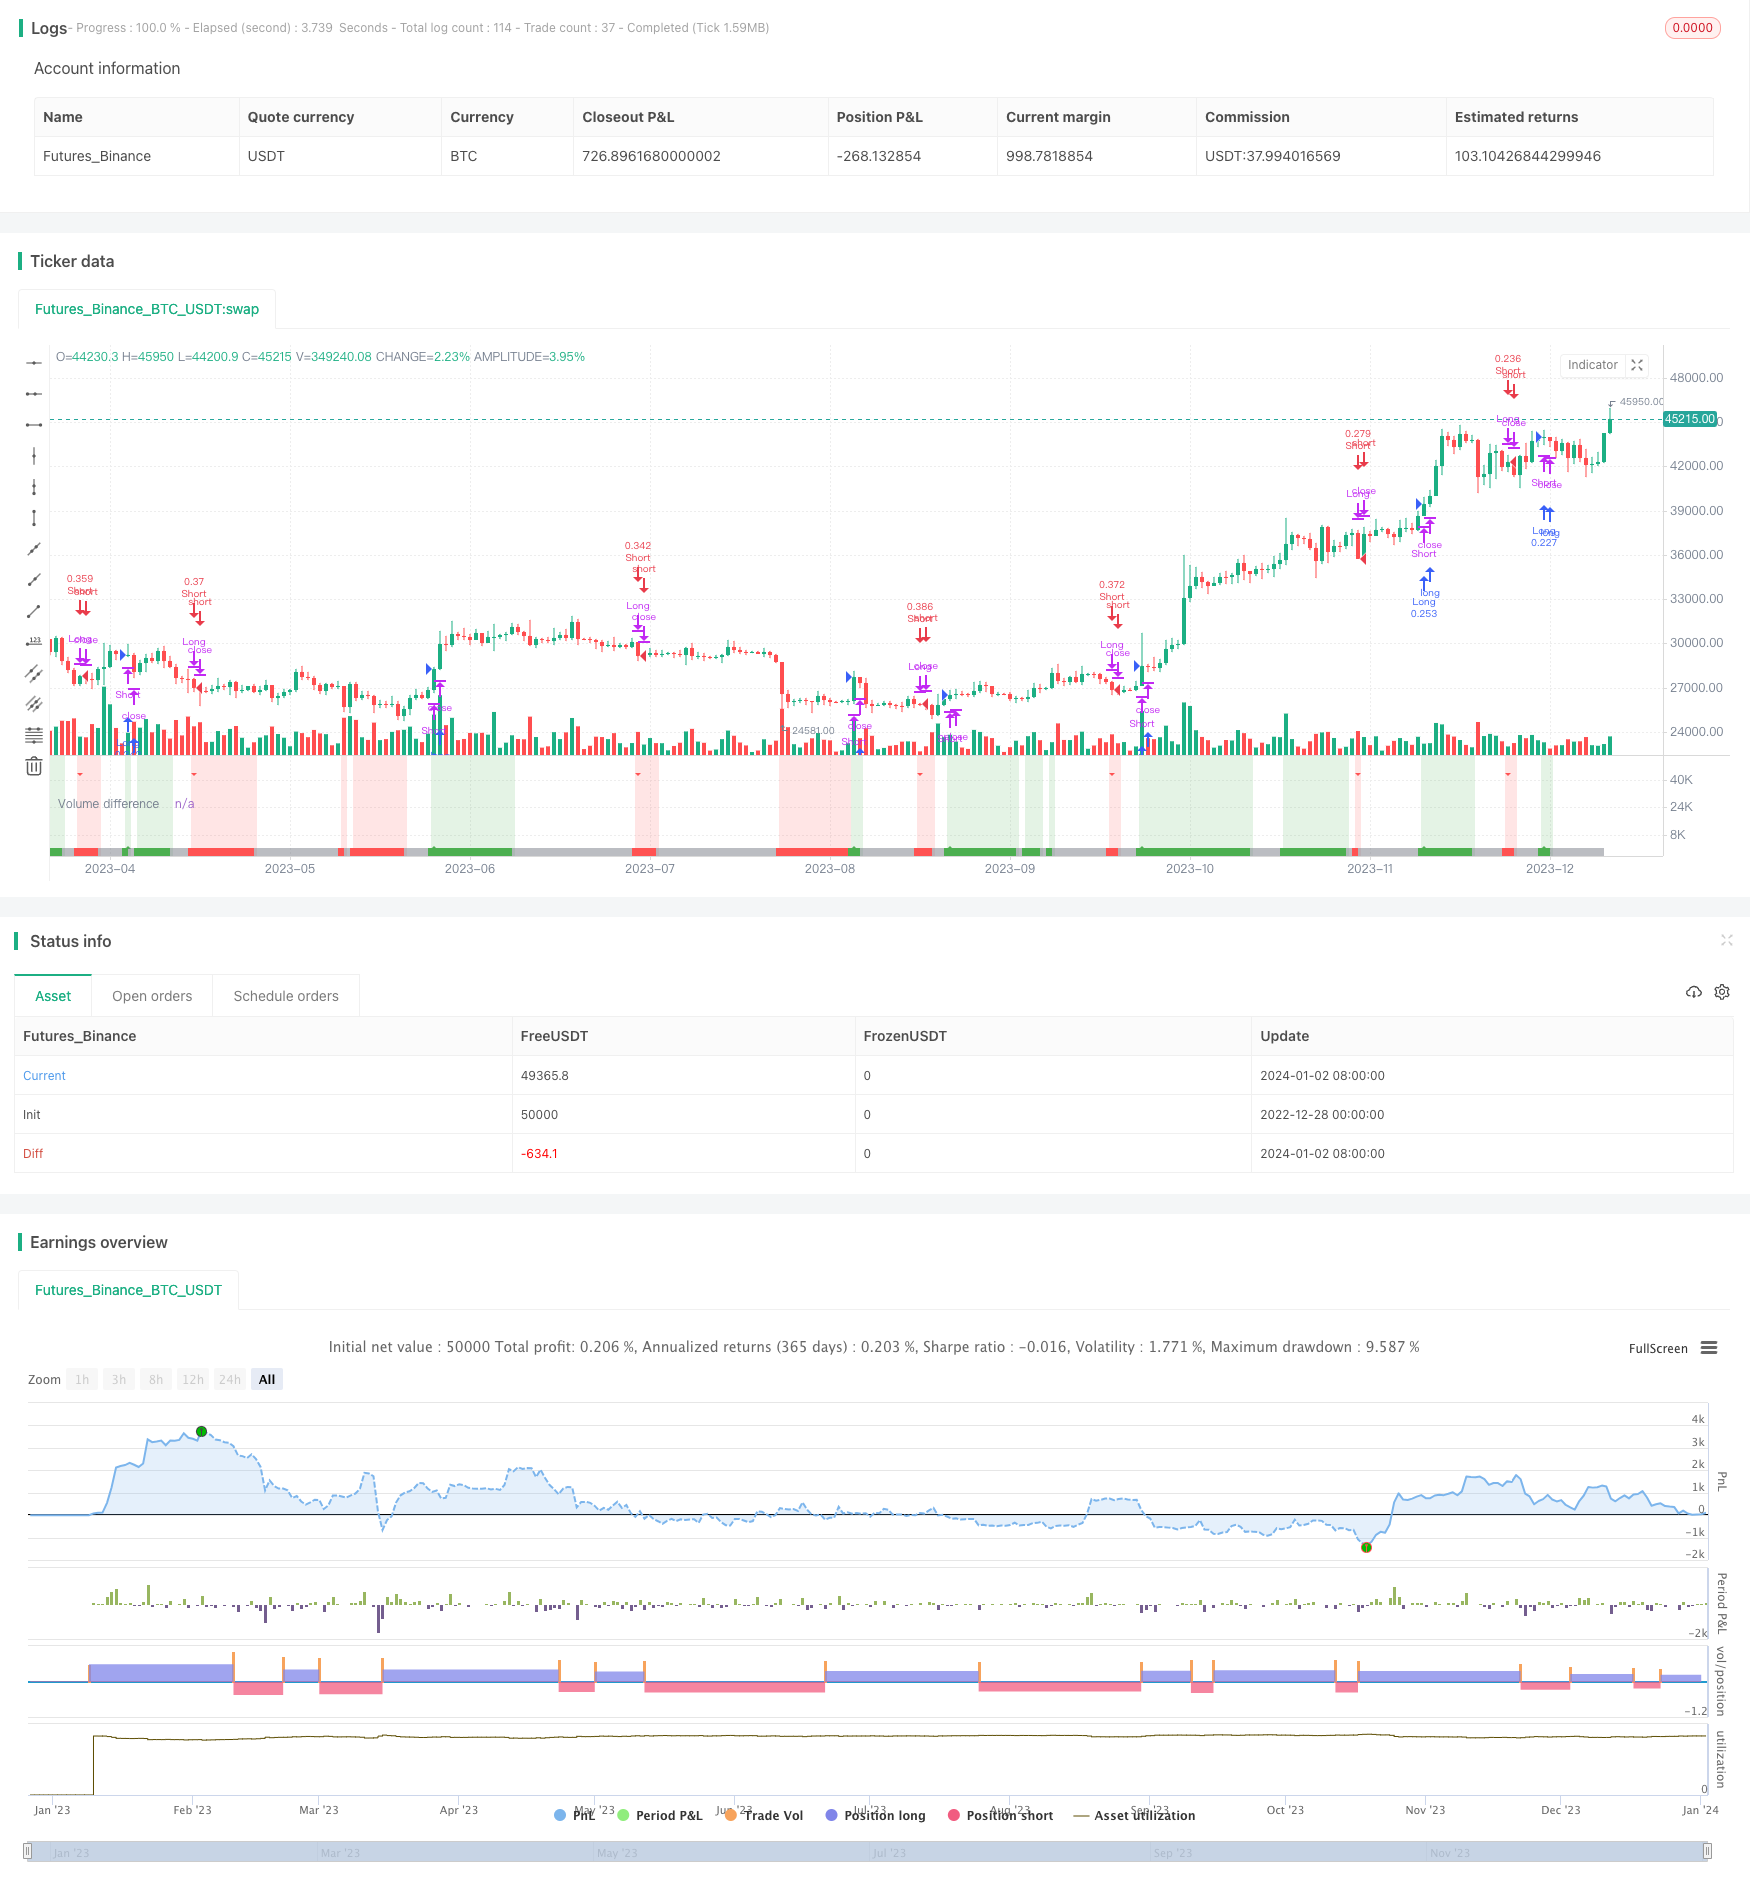
ボリュームエネルギー駆動戦略は,取引量の変化を分析することによって市場参加者の感情の変化を判断する.取引量を上昇するボリュームと下降するボリュームに分割し,それらの重度の移動平均を計算し,上昇するボリュームが優勢であるときに上昇信号を生成し,下降するボリュームが優勢であるときに下降信号を生成する.
戦略の論理
戦略は,まず,閉店価格と開店価格の関係に基づいて,各キャンドルスタイクの取引量を上昇値と下落値に分割する.閉店価格が開店価格よりも大きい場合,キャンドルスタイクの取引量は全体的に上昇値である.閉店価格が開店価格よりも低い場合,上昇値は (最高価格 - オープニング価格) / (最高価格 - 最低価格) の比率に基づいて計算され,残りは下落値である.
順番に最後のn個のキャンドルスタイクの上昇し,下落するボリュームの加重移動平均を計算します.上昇し,下落するボリュームの移動平均が上昇し,上昇し,下落するボリュームの差が設定された限界値よりも大きい場合,上昇信号が生成されます.低下する信号を生成するルールは類似しています.
konsolide ゾーンを特定するために平均取引量でベースラインを設定します.もし,bullish と bearish の間で有意な差がない場合,それは現在市場が konsolide されていることを示します.
利点分析
- 市場参加者の感情を理論的根拠で判断するために,量に関する情報を利用する
- 重要な信号を逃さないように,統合ゾーンを自動的に識別します.
- パーソナライズ可能なパラメータは,異なる取引製品とタイムフレームに適応する
- 上向きと下向きのシグナルを別々に識別したり,片側だけを追いかける
リスク分析
- 取引量データは操作可能
- デフォルトパラメータはすべての製品に適合しない可能性があります.最適化が必要です.
- 不適切な統合識別パラメータは信号を逃す可能性があります.
- 短期間で誤った信号が出る可能性があります
パラメータ最適化や他の指標との組み合わせのような方法がリスクを減らすのに役立ちます
オプティマイゼーションの方向性
- 取引量を計算する異なる方法をテストする
- EMA,SMMAなどなど,様々な種類の移動平均を試してください.
- 平均量の計算期間を最適化する
- 統合を特定するためのパラメータを最適化
- 信号をフィルターするために他の技術指標と組み合わせる
概要
ボリュームエネルギー駆動戦略は,市場情勢とトレンド変化を決定するために,上昇と下落の取引量の分布を賢く判断します.単独または他の戦略と組み合わせて使用できます.パラメータ最適化と指標組み合わせを通じて安定性と収益性のさらなる改善を達成できます.
/*backtest
start: 2022-12-28 00:00:00
end: 2024-01-03 00:00:00
period: 1d
basePeriod: 1h
exchanges: [{"eid":"Futures_Binance","currency":"BTC_USDT"}]
*/

// This source code is subject to the terms of the Mozilla Public License 2.0 at https://mozilla.org/MPL/2.0/
// © Shuttle_Club
//@version=5

strategy('Volume fight strategy', default_qty_type=strategy.cash, default_qty_value=10000, currency='USD', commission_value=0.04, calc_on_order_fills=false, calc_on_every_tick=false, initial_capital=10000)

direction = input.string('ANY', 'Direction', options=['LONG', 'SHORT', 'ANY'], tooltip='Select the direction of trade.\n\nВыберите направление торговли.')
ma = input.int(11, 'Search_range', minval=1, tooltip='The range of estimation of the predominance of bullish or bearish volume (quantity bars). The smaller the TF, the higher the range value should be used to filter out false signals.\n\nДиапазон оценки преобладания бычьего или медвежьего объема (количество баров). Чем меньше ТФ, тем выше следует использовать значение диапазона, чтобы отфильтровать ложные сигналы.')
delta = input.float(15, 'Smoothing_for_flat,%', step=0.5, minval=0, tooltip='Smoothing to reduce false signals and highlight the flat zone. If you set the percentage to zero, the flat zones will not be highlighted, but there will be much more false signals, since the indicator becomes very sensitive when the smoothing percentage decreases.\n\nСглаживание для уменьшения ложных сигналов и выделения зоны флета. Если выставить процент равным нулю, то зоны флета выделяться не будут, но будет гораздо больше ложных сигналов, так как индикатор становится очень чувствительным при снижении процента сглаживания')
bgshow = input.bool(true, 'Show background zones', tooltip='Show the color background of the current trading zone.\n\nПоказывать цветовой фон текущей торговой зоны.')
all_signal_show = input.bool(false, 'Show each setup in zone', tooltip='Show every signals into trading zone.\n\nПоказывать каждый сигнал внутри торговой зоны.')

/////   CALCULATION
bull_vol = open < close ? volume : volume * (high - open) / (high - low)  //determine the share of bullish volume
bear_vol = open > close ? volume : volume * (open - low) / (high - low)  //determine the share of bearish volume
avg_bull_vol = ta.vwma(bull_vol, ma)  //determine vwma
avg_bear_vol = ta.vwma(bear_vol, ma)
diff_vol = ta.sma(avg_bull_vol / volume - 1 - (avg_bear_vol / volume - 1), ma)  //normalize and smooth the values
vol_flat = math.abs(avg_bull_vol + avg_bear_vol) / 2  //determine average value for calculation flat-filter

/////   SIGNALS
up = int(na), up := nz(up[1])
dn = int(na), dn := nz(dn[1])
bull = avg_bull_vol > avg_bear_vol and vol_flat / avg_bull_vol < 1 - delta / 100  //determine up zones
bear = avg_bull_vol < avg_bear_vol and vol_flat / avg_bear_vol < 1 - delta / 100  //determine dn zones

if bull
    up += 1, dn := 0
    dn
if bear
    dn += 1, up := 0
    up
if not bull and not bear and all_signal_show
    up := 0, dn := 0
    dn

/////   PLOTTING
plotshape(bull and up == 1, 'UP', location=location.bottom, style=shape.triangleup, color=color.new(color.green, 0), size=size.tiny)
plotshape(bear and dn == 1, 'DN', location=location.top, style=shape.triangledown, color=color.new(color.red, 0), size=size.tiny)
bgcolor(title='Trading zones', color=bgshow and avg_bull_vol > avg_bear_vol and vol_flat / avg_bull_vol < 1 - delta / 100 ? color.new(color.green, 85) : bgshow and avg_bull_vol < avg_bear_vol and vol_flat / avg_bear_vol < 1 - delta / 100 ? color.new(color.red, 85) : na)
plot(diff_vol, 'Volume difference', style=plot.style_area, color=avg_bull_vol > avg_bear_vol and vol_flat / avg_bull_vol < 1 - delta / 100 ? color.new(color.green, 0) : avg_bull_vol < avg_bear_vol and vol_flat / avg_bear_vol < 1 - delta / 100 ? color.new(color.red, 0) : color.new(color.gray, 50))

strategy.close('Short', comment='close', when=bull and up == 1)
strategy.close('Long', comment='close', when=bear and dn == 1)
strategy.entry('Long', strategy.long, when=direction != 'SHORT' and bull and up == 1)
strategy.entry('Short', strategy.short, when=direction != 'LONG' and bear and dn == 1)

if bull and up==1
    alert('Bullish movement! LONG trading zone', alert.freq_once_per_bar_close)
if bear and dn==1
    alert('Bearish movement! SHORT trading zone', alert.freq_once_per_bar_close)
もっと
- 双重逆転RSI ヒストアラート戦略
- ADXフィルターでモメントブレイク戦略
- ダイナミック平均コスト ドル平均コスト 複合戦略
- マルチEMAクロスオーバートレンド 戦略をフォローする
- カマリラ・ピボット・ブレークアウト戦略
- アダプティブ・ボトベンコ指標 ロング・ショート戦略
- ボリンジャーバンドとVWAPベースの定量取引戦略
- モメントボリンガーバンドのブレイクストラテジー
- 双向移動平均のクロスオーバー逆動向追跡戦略
- 量子光 移動平均 トレンド追跡 最適化戦略
- HMAのモメンタムブレークスルー戦略
- ATRと波動指数に基づくトレンド追跡戦略
- モメント トレンド トラッキング 戦略
- 戦略をフォローする量子トレンド
- ハルフ・フィルター移動平均戦略
- 熊の力戦略
- 2つの移動平均のクロスオーバー戦略
- 二重逆転のCMOの量子戦略
- RSIとSMAのクロスオーバー戦略
- ボリンジャー・バンド・ブレークアウト戦略