概述
多重EMA均线交叉趋势跟踪策略通过组合使用多组不同参数的EMA均线,在较短周期EMA上形成金叉时做多,形成死叉时做空,实现趋势跟踪交易。该策略同时使用7组EMA均线,包括12、26、50、100、200、89和144周期,通过比较这些EMA的交叉情况来判断趋势方向。
策略原理
该策略的核心逻辑是基于EMA均线的交叉原理。EMA均线中,周期较短的EMA对价格变化更为敏感,可以反映最近期的价格趋势;而周期较长的EMA对价格变化不那么敏感,可以反映长期趋势。当短周期EMA从下方上穿一个长周期EMA时,形成所谓的“金叉”,表示短期趋势转 bullish,可以设置做多订单。相反,当短周期EMA从上方下穿一个长周期EMA时,形成“死叉”,表示短期趋势转 bearish,可以设置做空订单。
该策略使用了7组EMA均线,包括12&26、12&50、12&100、12&200、12&89以及12&144。策略会同时比较这7组EMA的交叉情况。例如,当12日EMA上穿26日EMA形成金叉时,就会打开做多头寸;当发生死叉时就会平掉该做多头寸。策略对其他6组EMA均线也采用同样的逻辑。
优势分析
该策略最大的优势在于可以同时捕捉多个时间尺度上的趋势。通过组合使用多个EMA均线,策略既可以捕捉短期趋势,又可以跟踪长期趋势,实现多时间轴的趋势跟踪。此外,该策略可以通过调整不同EMA的参数来优化表现。
风险分析
该策略的主要风险在于多重EMA均线组合使用时可能出现交叉信号过于频繁的情况。例如,12日EMA和26日EMA之间交叉次数要比12日EMA和200日EMA之间交叉次数更频繁,如果不能控制开仓和平仓的频率,则会增加交易成本和滑点损失。此外,EMA均线本身对价格变化有滞后性,可能导致信号产生不及时。
为降低上述风险,可以适当优化EMA的周期参数,使其交叉频率处于合适区间;另外可以适当限制单日开仓次数或设置止损来控制风险。
优化方向
该策略的优化空间主要集中在EMA均线的参数调整。可以尝试更多不同周期的参数组合;此外也可以试验其他类型的移动平均线如SMA。另外,策略可以加入附加条件来过滤信号,例如成交量指标、波动率指标等,从而提高信号质量。加入止损策略也可以进一步优化,降低市场剧烈波动的影响。
总结
多重EMA均线交叉趋势跟踪策略通过比较多个EMA的交叉情况判断趋势方向,实现多时间尺度的趋势跟踪,是一种常见的趋势跟踪策略。该策略优势在于可以灵活调整参数,捕捉不同级别的趋势;劣势在于信号可能过于频繁,增加交易成本。通过参数优化以及加入辅助条件可以进一步提升策略表现。
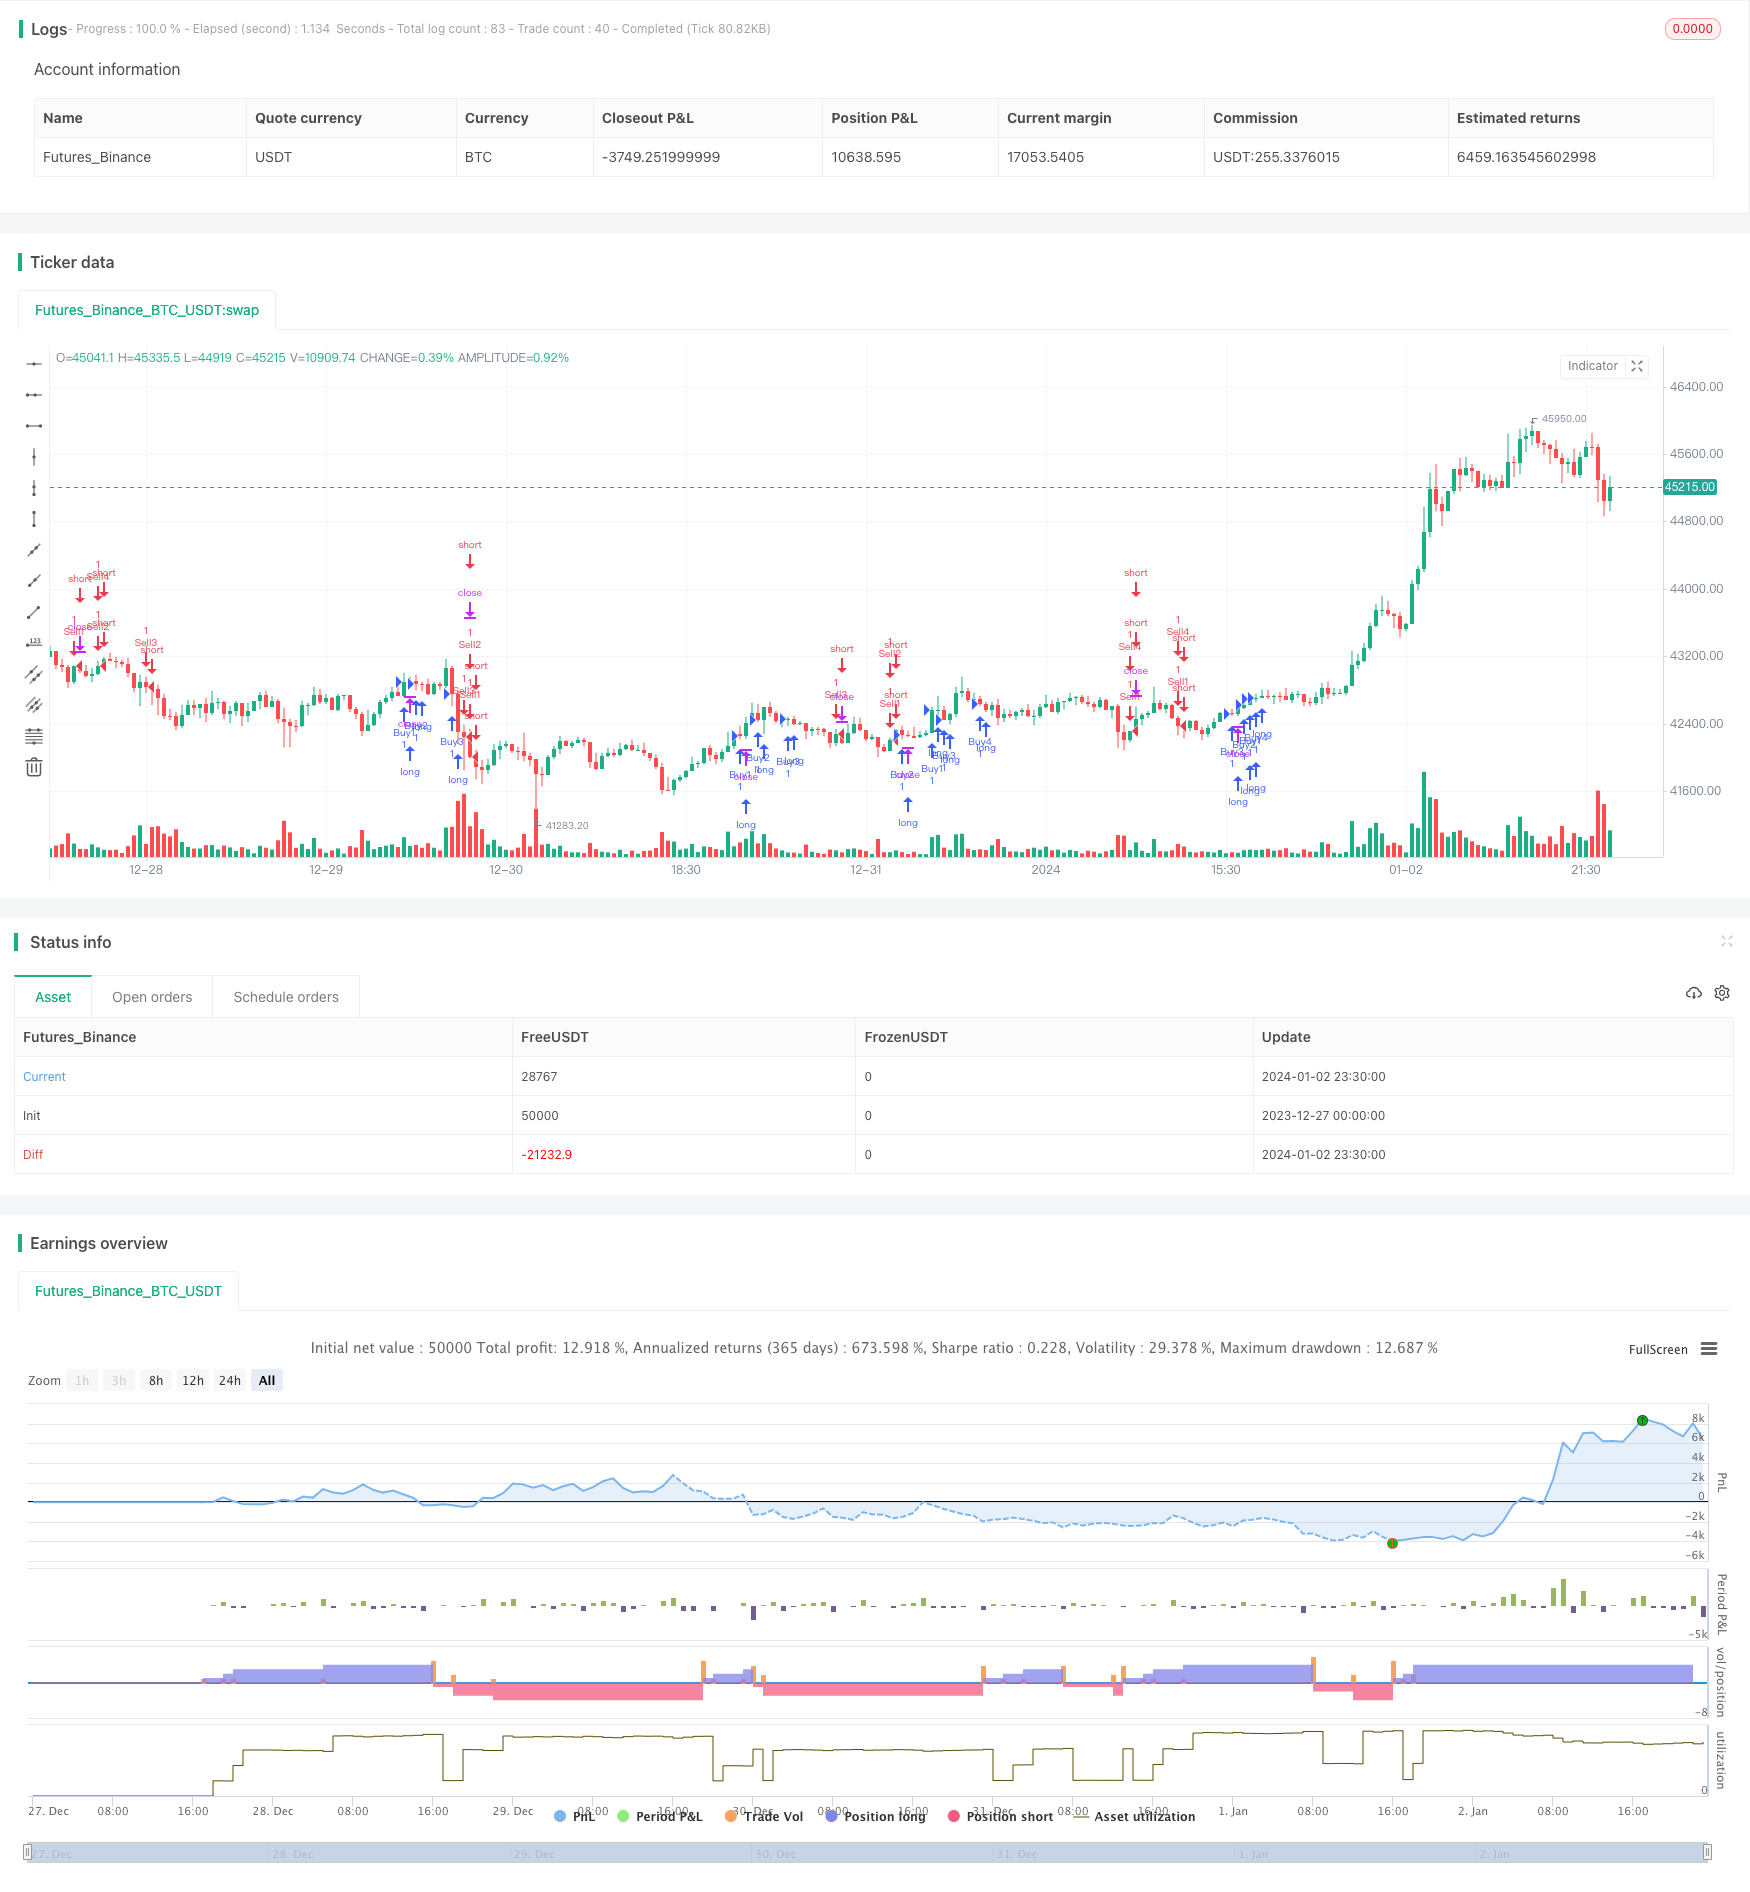
/*backtest
start: 2023-12-27 00:00:00
end: 2024-01-03 00:00:00
period: 30m
basePeriod: 15m
exchanges: [{"eid":"Futures_Binance","currency":"BTC_USDT"}]
*/

//@version=2
strategy("EMA Trades", overlay=true, pyramiding=4)

src = input(close, title="Source")

shortestLine = input(12, minval=1, title="Shortest Line")
shorterLine = input(26, minval=1, title="Shorter Line")
shortLine = input(50, minval=1, title="Short Line")
middleLine = input(100, minval=1, title="Middle Line")
longLine = input(200, minval=1, title="Long Line")
longerLine = input(89, minval=1, title="Longer Line")
longestLine = input(144, minval=1, title="Longest Line")

shortestLineOutput = ema(src, shortestLine)
shorterLineOutput = ema(src, shorterLine)
shortLineOutput = ema(src, shortLine)
middleLineOutput = ema(src, middleLine)
longLineOutput = ema(src, longLine)
longerLineOutput = ema(src, longerLine)
longestLineOutput = ema(src, longestLine)

//plot(shortestLineOutput, title="Shortest EMA", color=#ffffff)
//plot(shorterLineOutput, title="Shorter EMA", color=#e54fe6)
//plot(shortLineOutput, title="Short EMA", color=#4e6bc3)
//plot(middleLineOutput, title="Middle EMA", color=#1dd6d8)
//plot(longLineOutput, title="Long EMA", color=#d0de10)
//plot(longerLineOutput, title="Longer EMA", color=#ef6a1a)
//plot(longestLineOutput, title="Longest EMA", color=#ff0e0e)

longEnrtyCondition_1 = crossover(shortestLineOutput[1], shorterLineOutput[1]) and shortestLineOutput > shorterLineOutput
longEntryCondition_2 = crossover(shortestLineOutput[1], shortLineOutput[1]) and shortestLineOutput > shortLineOutput
longEnrtyCondition_3 = crossover(shortestLineOutput[1], middleLineOutput[1]) and shortestLineOutput > middleLineOutput
longEntryCondition_4 = crossover(shortestLineOutput[1], longLineOutput[1]) and shortestLineOutput > longLineOutput

shortEnrtyCondition_1 = crossunder(shortestLineOutput[1], shorterLineOutput[1]) and shortestLineOutput < shorterLineOutput
shortEntryCondition_2 = crossunder(shortestLineOutput[1], shortLineOutput[1]) and shortestLineOutput < shortLineOutput
shortEnrtyCondition_3 = crossunder(shortestLineOutput[1], middleLineOutput[1]) and shortestLineOutput < middleLineOutput
shortEntryCondition_4 = crossunder(shortestLineOutput[1], longLineOutput[1]) and shortestLineOutput < longLineOutput

if (longEnrtyCondition_1)
    strategy.entry("Buy1", strategy.long)
    strategy.exit("Sell1")

if (longEntryCondition_2)
    strategy.entry("Buy2", strategy.long)
    strategy.exit("Sell2")

if (longEnrtyCondition_3)
    strategy.entry("Buy3", strategy.long)
    strategy.exit("Sell3")

if (longEntryCondition_4)
    strategy.entry("Buy4", strategy.long)
    strategy.exit("Sell4")

if (shortEnrtyCondition_1)
    strategy.entry("Sell1", strategy.short)
    strategy.exit("Buy1")

if (shortEntryCondition_2)
    strategy.entry("Sell2", strategy.short)
    strategy.exit("Buy2")

if (shortEnrtyCondition_3)
    strategy.entry("Sell3", strategy.short)
    strategy.exit("Buy3")

if (shortEntryCondition_4)
    strategy.entry("Sell4", strategy.short)
    strategy.exit("Buy4")