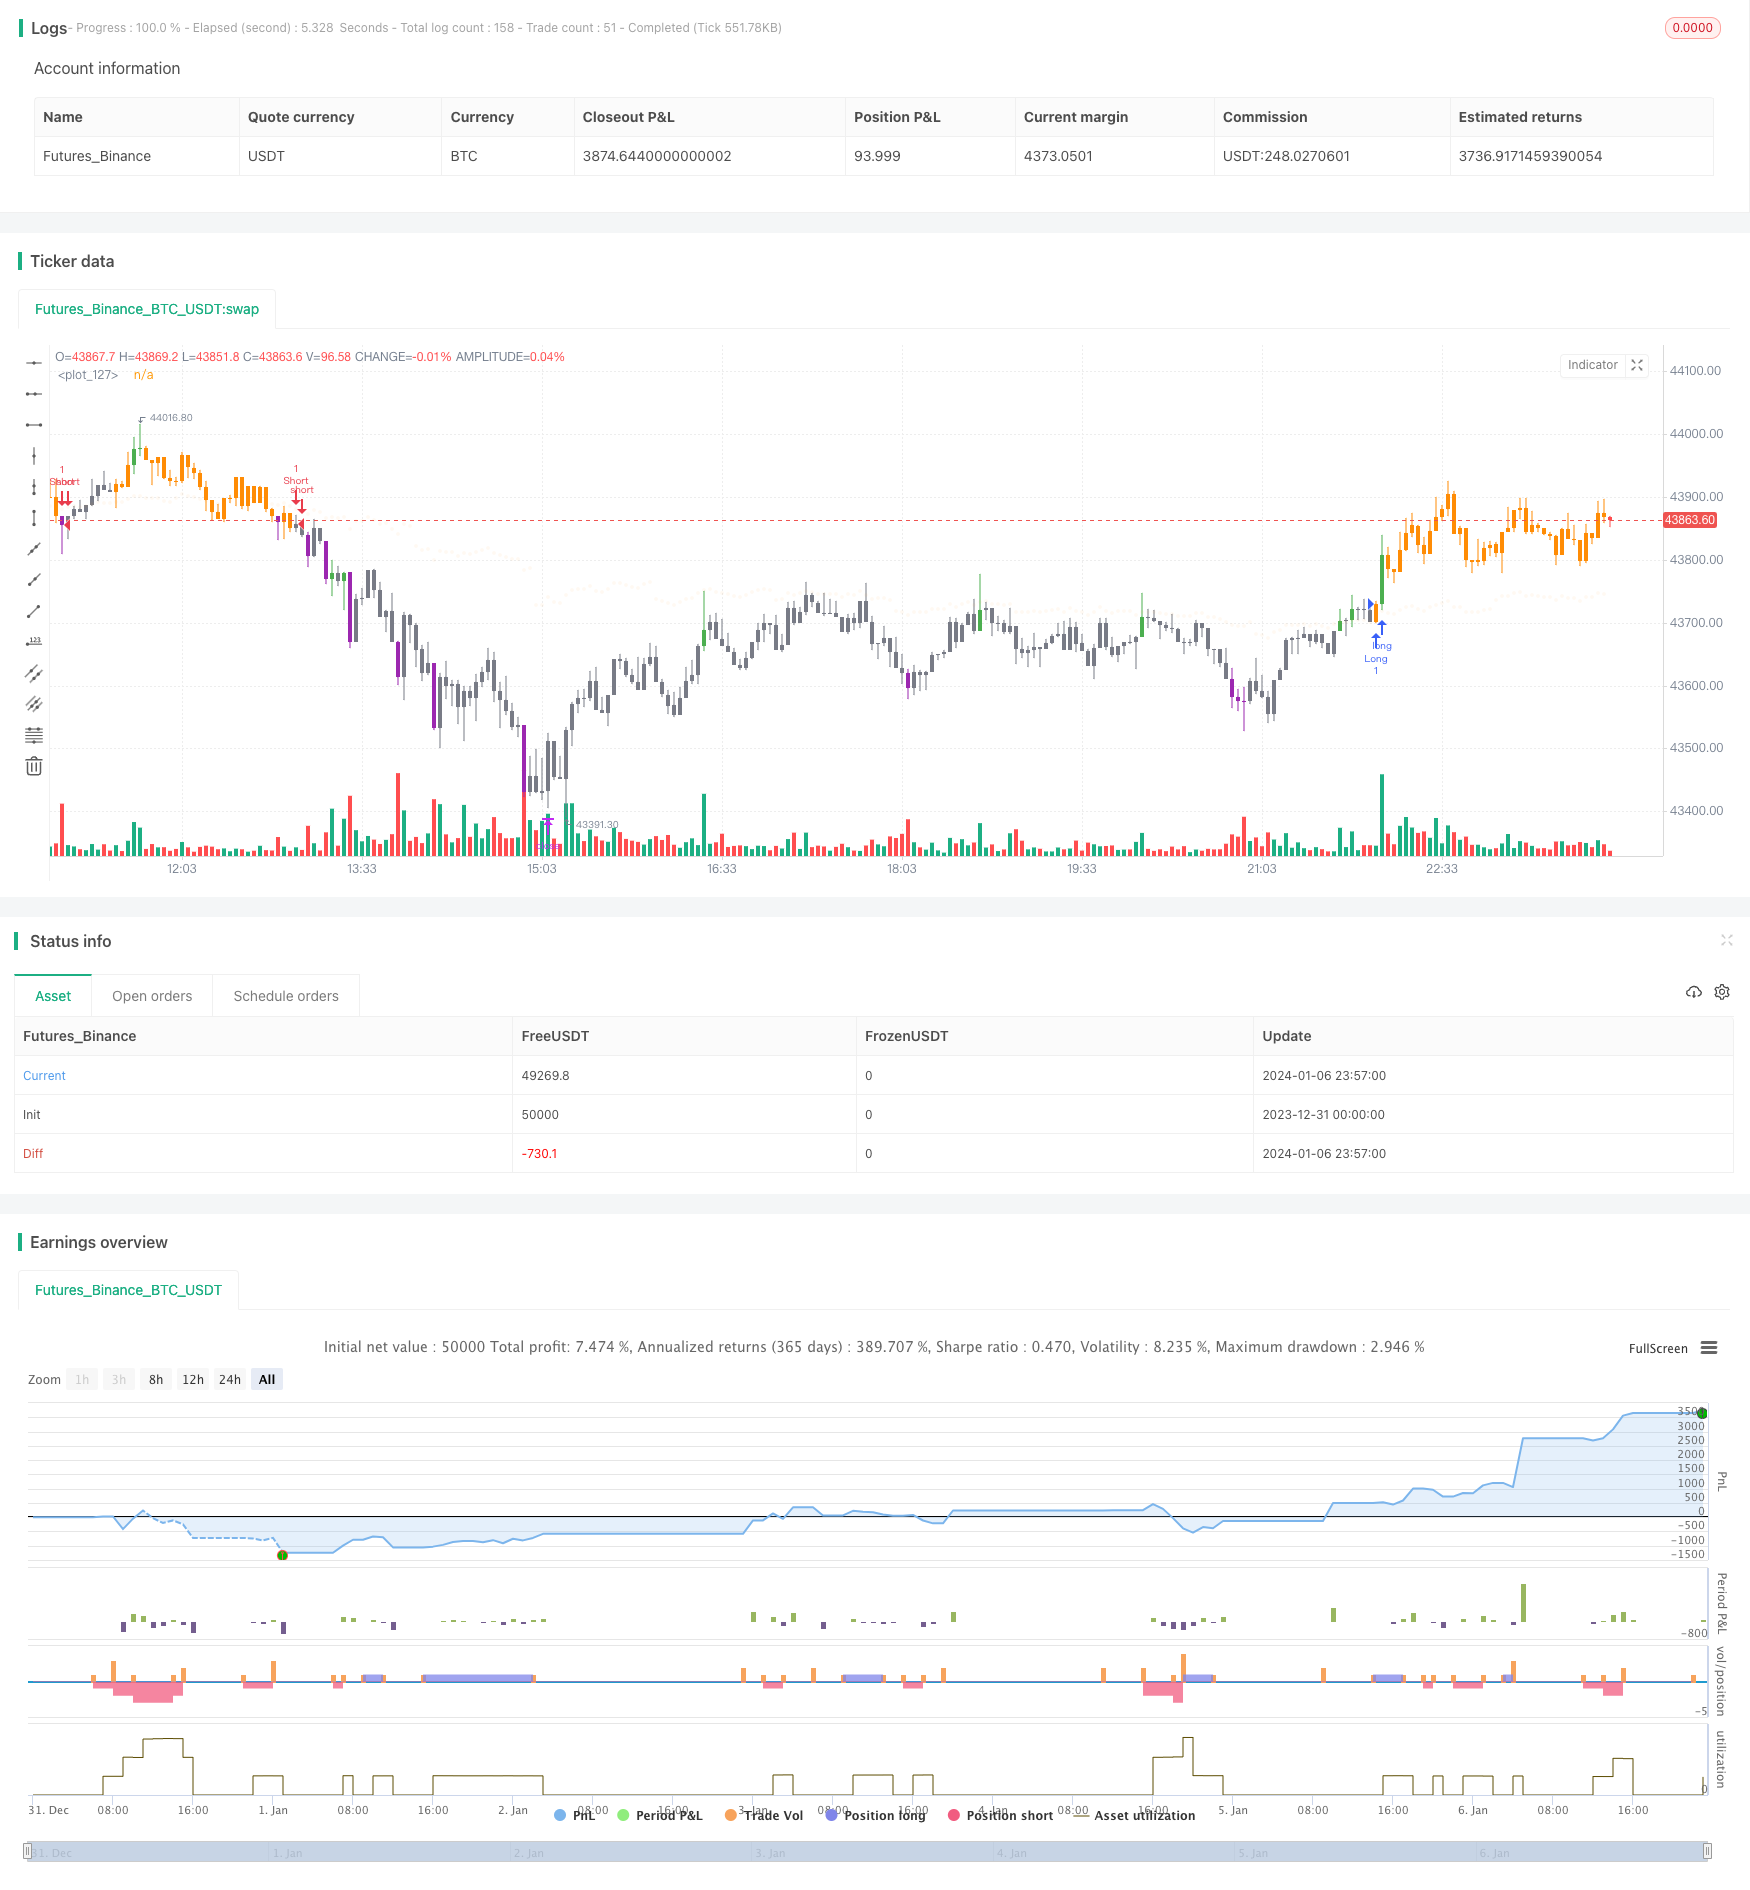
二重移動平均に基づくスイングトレード戦略

概要
この戦略は双平線に基づく振動取引戦略である.これは,快速移動平均と遅い移動平均の交差を買入と売却の信号として使用する.快速移動平均が,下から遅い移動平均を横切るときに買入の信号を生成する.快速移動平均が,上から下から遅い移動平均を横切るときに売出の信号を生成する.この戦略は,振動の状況に適用され,価格の短期的な波動から利益を得ることができる.
戦略原則
この戦略は,速行移動平均として長さ6のRMA,遅行移動平均として長さ4のHMAを使用する.戦略は,速行と遅行の交差によって価格の傾向を判断し,取引信号を生成する.
速い線が下からゆっくりとした線を横切るときは,価格が短期間に転向して下向きに転がり,チップ変換の時間であることを示し,戦略はこの時点で買い信号を生成する.速い線が上からゆっくりとした線を横切るときは,価格が短期間に転向して下向きに転がり,チップ変換の時間であることを示し,戦略はこの時点で売り信号を生成する.
さらに,戦略は長期のトレンド判断を検知し,逆向きの取引を避ける. 長期のトレンド判断が同時にその信号を好む場合にのみ,実際の買入と売却の信号を生成する.
戦略的優位性
この戦略の利点は以下の通りです.
- 双均線交差判断を用いて,短期的な価格逆転点を効果的に識別することができる.
- 速線と遅線の長さが合理的に組み合わせられ,より正確な取引信号を生成することができる.
- 長期的・短期的トレンド判断と組み合わせると,多くのノイズ取引信号をフィルターできます.
- ストップ・ストップ・ロズロジックが実装され,リスクを積極的に回避できます.
- 簡単に理解し,実行し,量子取引の初心者に適しています.
リスクと解決策
この戦略にはいくつかのリスクがあります.
双均線戦略は,小さな利益を何度も生み出すが,大きな損失を一度に発生させる容易な状況である. 解決策は,適切な停止停止損失レベルを調整することです.
動揺した状況で取引シグナルが頻繁に発生し,過剰取引を引き起こす可能性があります. 解決策は,取引条件を適切に緩和し,トランザクションを減らすことです.
策略パラメータは過度に最適化されやすいため,実力的な効果が悪くなる可能性がある. 解決策はパラメータの安定性テストである.
策略はトレンド状況でうまく機能しない. 解決策は,トレンド判断モジュールを追加するか,トレンド策略と組み合わせて使用することです.
最適化の方向
この戦略の改善の方向は以下の通りです.
平均線指標を更新し,カルマンなどの自己適応フィルターを使用する.
機械学習モジュールを追加し,AIを活用して取引先を判断する.
資金管理モジュールを追加し,リスク管理をさらに自動化します.
高い周波数と組み合わせると,より強力な取引信号が発見されます.
複数の品種を対象に 市場間でのアベレート
要約する
この双均線振動戦略は,全体的に典型的で実用的な量化取引戦略である.それは強い適応性を持ち,初心者は,戦略開発に関する知識を大量に学ぶことができます.同時に,それはさらに多くの量化技を組み合わせて,より良い戦略効果を得るために最適化することができる大きな改善の余地もあります.
/*backtest
start: 2023-12-31 00:00:00
end: 2024-01-07 00:00:00
period: 3m
basePeriod: 1m
exchanges: [{"eid":"Futures_Binance","currency":"BTC_USDT"}]
*/

// This source code is subject to the terms of the Mozilla Public License 2.0 at https://mozilla.org/MPL/2.0/
// © dc_analytics
// https://datacryptoanalytics.com/


//@version=5
strategy("Scalping Trading", overlay=true)

//  INPUTS  //
bar_color       = input(true, title='Bar Color', group='⚙ Settings',tooltip='Color chart bars.', inline = "1")
mostrar         = input(true, 'Show Alerts', group='⚙ Settings', inline = "1")
tempo           = input.timeframe('60', group='⚙ Settings', title='🕗 Timeframe', options=['1', '5', '15', '30', '60', '120', '240', '360', '720', 'D', 'W'])

i_position      = input.string("Bottom Center", title = "⚙ D-Panel Location",
 options = ["Top Right", "Bottom Center", "Bottom Right"], group='⚙ D-Panel Settings️',
 tooltip='Choose the location of the information table on the chart.(D-Panel) ')

position        = i_position == "Top Right" ? position.top_right : i_position == "Bottom Center" ? position.bottom_center : position.bottom_right

i_tam           = input.string('Big', title = '⚙ D-Painel Size',
 options = ["Tiny", "Small", "Big"], group='⚙ D-Panel Settings️',tooltip='Choose the size of the information panel (D-Panel).')

tamanho         = i_tam == "Tiny" ? size.tiny : i_tam == "Small" ? size.small : size.normal

show_tp_sl      = input(true, title='Show Take Profit/Stop Loss', group='⚙ Settings',tooltip='Show Take Profit/Stop Loss.')
TP              = input.float(defval=4500, title='Take Profit:',group='⚙ Risk Management',tooltip='Choose amount of profit')
SL              = input.float(defval=2500, title='Stop Loss:', group='⚙ Risk Management',tooltip='Choose amount of loss')
//  END INPUTS  //


//  DECLARATIONS  //
t_up    = '📈'
t_down  = '📉'

c_buy   = 'Long ⇡'
c_sell  = 'Short ⇣'

// _DECLARATION TREND
t_sma       = ta.hma(close, 200)
tend_sma    = ta.sma(close, 12)

tendencia   = request.security(syminfo.tickerid, timeframe.period, t_sma, barmerge.gaps_off, barmerge.lookahead_off)
tend_tabela = request.security(syminfo.tickerid, timeframe.period, tend_sma, barmerge.gaps_off, barmerge.lookahead_off)
// _END DECLARATION TREND

circle = plot.style_circles
//  END DECLARATIONS  //


//  COLORS  //
color gray   = color.gray
color red    = color.new(#ff8c05, 0)
color orange = color.new(#ff8c05, 0)
color silver = color.silver
color up_vol = color.new(color.green, 0)
color dn_vol = color.new(color.purple, 0)

color orange_tranp  = color.new(#ff8c05, 95)
// END COLORS //

//  SCANNER MARKET MAKERS  //
periodo  = input.int(20, 'Period Volume', group='⚙️ Scanner Market Makers Settings')
fator    = input.float(1.85, 'Proportion to the mean: (1.25 = 125% of the mean)', minval=0, group='⚙️ Scanner Market Makers Settings')
vol_up   = close > open
vol_down = open > close
vol      = volume
pesado   = volume > ta.ema(volume, periodo) * fator

palette  = pesado and vol_up ? gray : pesado and vol_down ? orange : vol_up ? silver : gray
//  END SCANNER MARKET MAKERS  //


//  LOGIC ONE  //
s = ta.rma(close, 6)
v = ta.hma(close, 4)

//  TREND
t_baixa     = tendencia > tendencia[1]
t_alta      = tendencia < tendencia[1]

te_d        = tend_tabela > tend_tabela[1]
trend       = te_d ? t_up : t_down
//  END TREND

a = request.security(syminfo.tickerid, tempo, s)
b = request.security(syminfo.tickerid, tempo, ohlc4)

c_dn   = a > b and a[1] < b[1]
c_up   = b > a and b[1] < a[1]

compra = mostrar and c_up ? a : na
venda  = mostrar and c_dn ? a : na

s_sell = venda and t_alta
s_buy  = compra and t_baixa
c_vela = b > a and te_d ? gray : orange

s_up = false
s_dw = false

b_sinal = not s_up and s_buy
s_sinal = not s_dw and s_sell

if b_sinal
    s_dw := false
    s_up := true
    s_up

if s_sinal
    s_dw := true
    s_up := false
    s_up

// END LOGIC ONE //


//  DATA TABLE  //
c = b > a ? orange : gray
c_sinal = b > a ? c_buy : c_sell
//  END DATA TABLE  //


//  PLOT/BARCOLOR  //
c_barcolor = pesado and vol_up ? up_vol : pesado and vol_down ? dn_vol : vol_up ? c : c

barcolor(bar_color ? c_barcolor : na)
plot(a, color=orange_tranp, style=circle)
//  END PLOT/BARCOLOR  //


//  TABLE  //
var dash = table.new(position=position, columns=2, rows=3, border_width=1)
if barstate.islast
    table.cell(table_id=dash, column=1, row=2, text='Scalping DCA', bgcolor=orange)
    table.cell(table_id=dash, column=1, row=0, text='Trade: ' + c_sinal)
    table.cell(table_id=dash, column=1, row=1, text='Trend: ' + trend)
//  END TABLE  //


//  SETTINGS STRATEGY  //
exitPrice = strategy.closedtrades.exit_price(strategy.closedtrades - 1)

// OPEN ORDER
if (b_sinal)
    strategy.order("Long", strategy.long , comment = "Entry: " + str.tostring(close, "#.####"))
//    strategy.exit("EXIT", trail_points = 1000, trail_offset = 0, comment_trailing = "Close with Profit: " + str.tostring(close, "#.####"))
//    strategy.entry("long", strategy.long)

if (s_sinal)
    strategy.order("Short", strategy.short , comment = "Entry: " + str.tostring(close, "#.####"))
//    strategy.exit("EXIT", trail_points = 1000, trail_offset = 0, comment_trailing = "Close with Profit: " + str.tostring(close, "#.####"))
//    strategy.entry("short", strategy.short)

//  TP/SL ORDERS
if strategy.position_size > 0
    strategy.exit('Long_Close', 'Long',profit = TP , loss=SL, qty_percent=100, comment_profit = "Profit Long: " + str.tostring(exitPrice, "#.####"), comment_loss = "Stop Long: " + str.tostring(exitPrice, "#.####"))
//if  strategy.position_size > 0
//    strategy.exit("Long", "Long", stop = longSL, limit = longTP, comment_profit = "Profit Long: " + str.tostring(exitPrice, "#.####"), comment_loss = "Stop Long: " + str.tostring(exitPrice, "#.####"))

if strategy.position_size < 0
    strategy.exit('Short_Close', 'Short',profit = TP, loss=SL, qty_percent=100, comment_profit = "Profit Short: " + str.tostring(exitPrice, "#.####"), comment_loss = "Stop Short: " + str.tostring(exitPrice, "#.####"))
//if strategy.position_size < 0
//    strategy.exit("Short", "Short", stop = shortSL, limit = shortTP, comment_profit = "Profit Short: "+ str.tostring(exitPrice, "#.####"), comment_loss = "Stop Short: " + str.tostring(exitPrice, "#.####"))

//  END SETTINGS STRATEGY  //

// LOGS
// if strategy.opentrades > 10
//     log.warning("{0} positions opened in the same direction in a row. Try adjusting `bracketTickSizeInput`", strategy.opentrades)

// last10Perc = strategy.initial_capital / 10 > strategy.equity
// if (last10Perc and not last10Perc[1])
//     log.error("The strategy has lost 90% of the initial capital!")