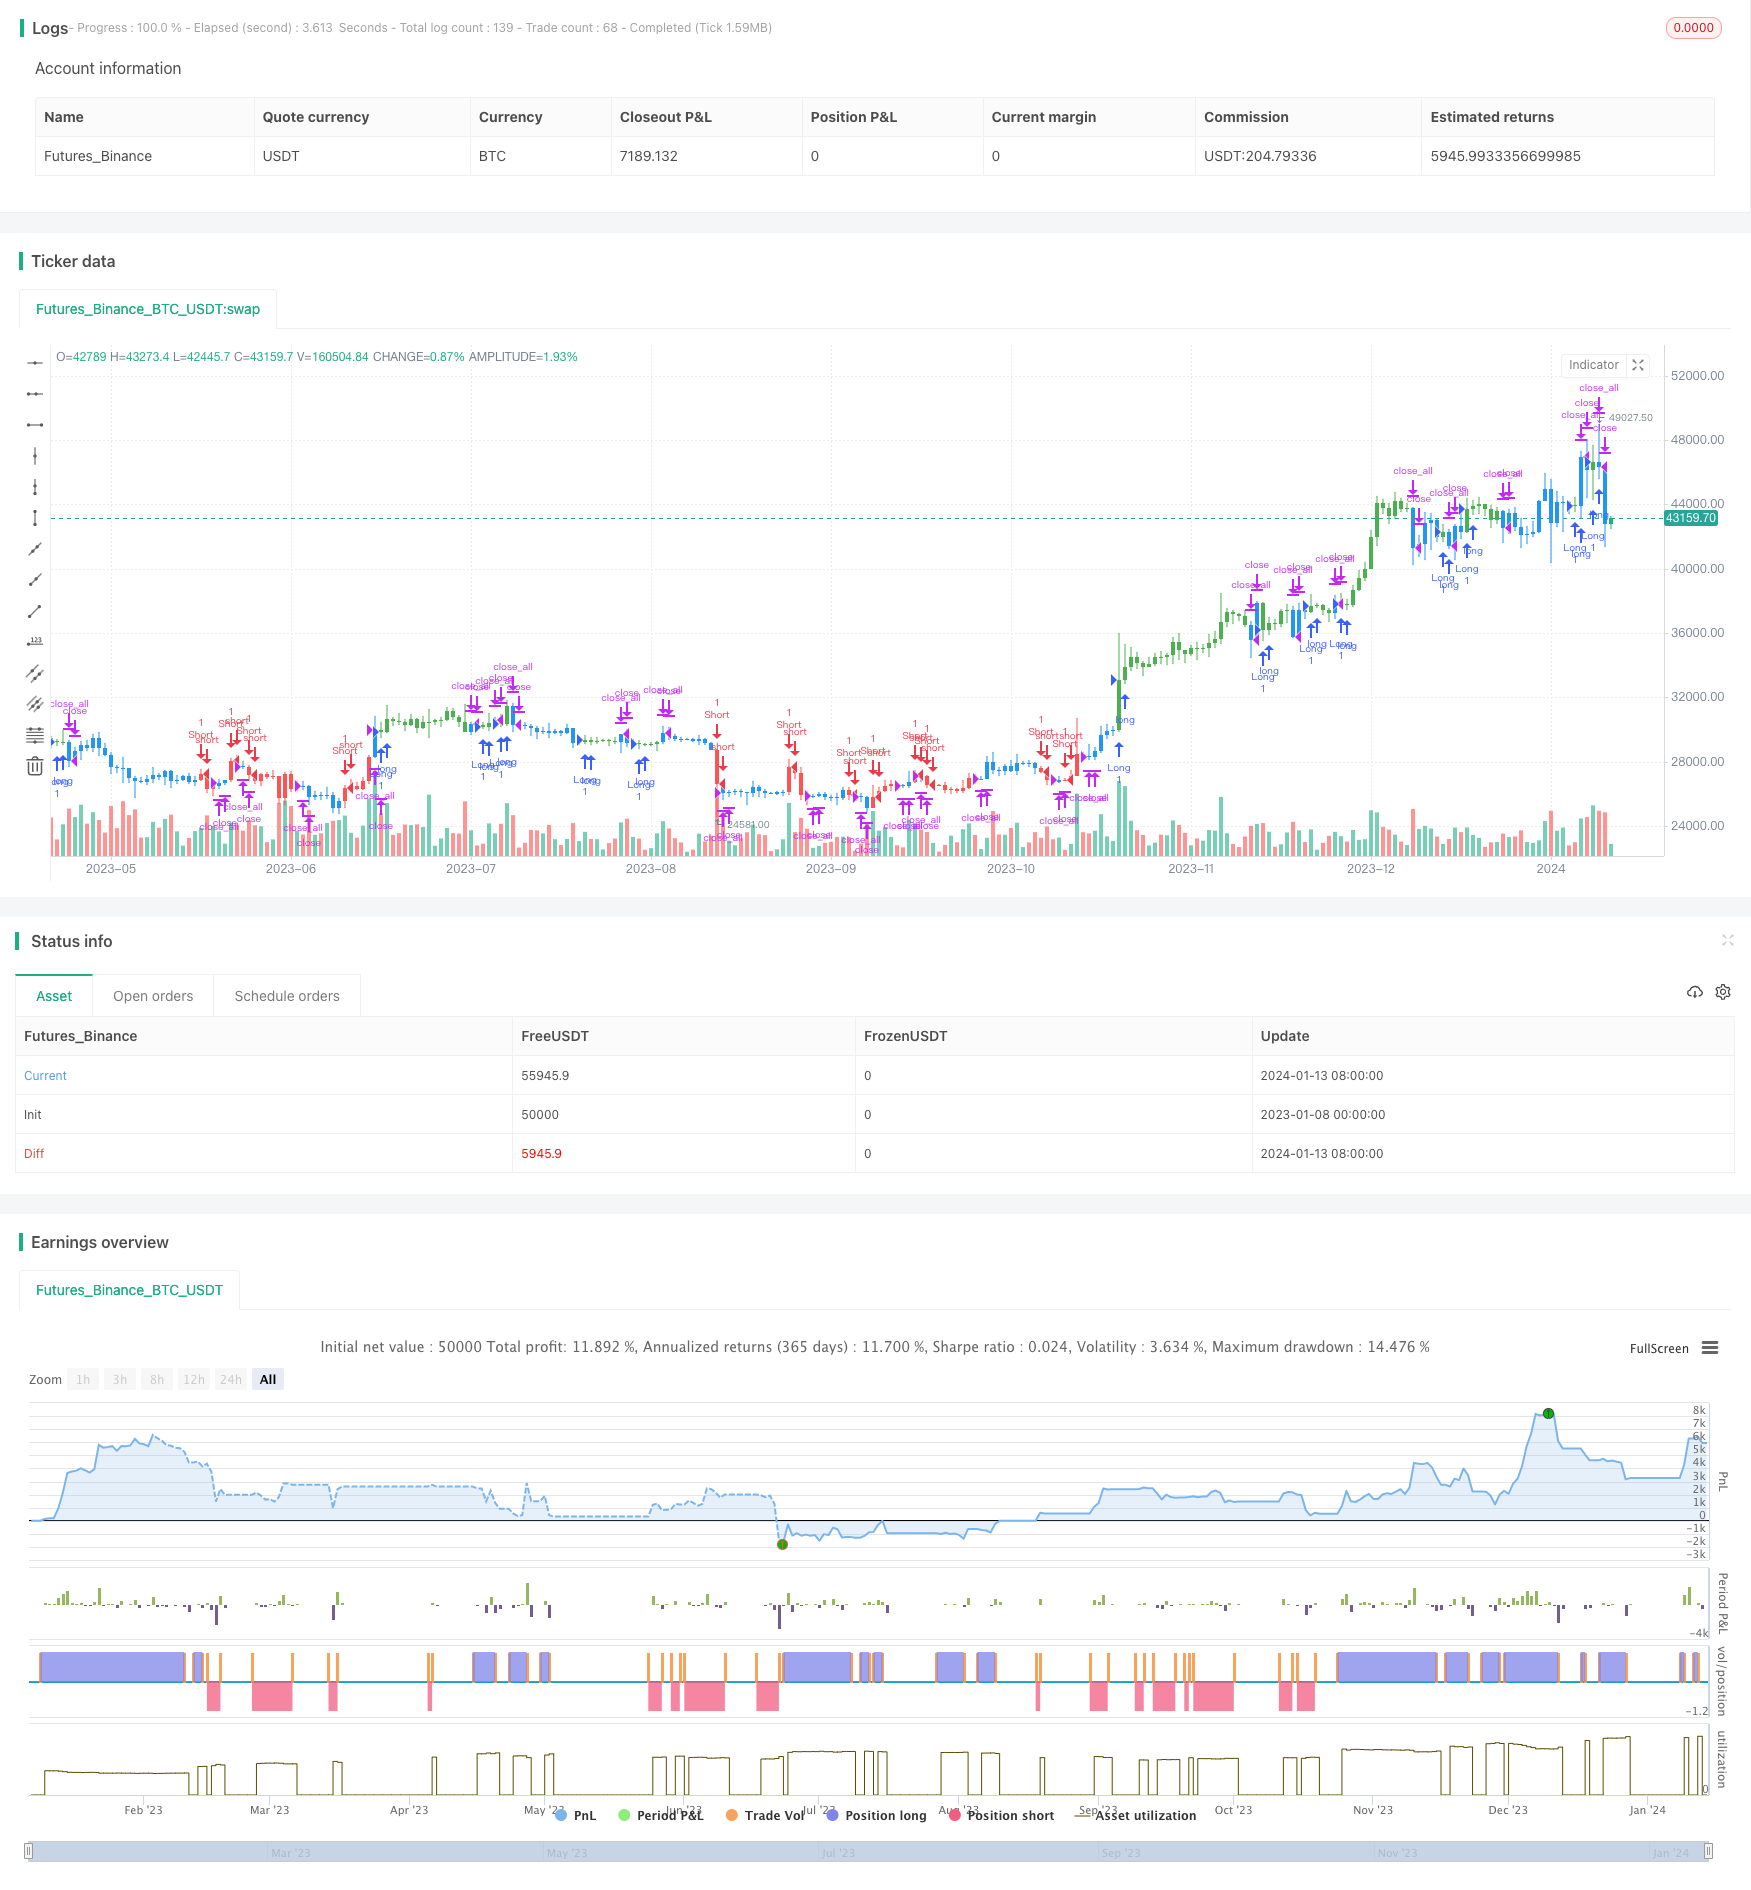
二重移動平均反転取引戦略

概要
双均線反転取引戦略は,ブリン線反転取引戦略と双指数移動平均取引戦略を組み合わせて,総合的な信号判断の取引戦略を設計する.これは株式,外貨,暗号通貨などの市場で使用できます.
戦略原則
この戦略は2つの部分から構成されています.
- ブリンラインの反転取引戦略
ブリンライン指標の2つの線 - %K線と%D線を使用します. 閉盘価格が前日より2日連続で低く,%K線が%D線より高いときは多めにします. 閉盘価格が前日より2日連続で高く,%K線が%D線より低いときは空白します.
- 双指数移動平均戦略
20日と20日に*2の双指数移動平均. 価格が上から下を穿い,または下から双指数移動平均を穿いるとき,取引シグナルが生成されます.
統合信号判定規則:二つの戦略の取引信号が一致するときに,実際の取引信号が生成される.
優位分析
この組み合わせ戦略の最大の利点は,高い信頼性であり,偽信号はほとんどありません.これは,2つの異なるタイプの戦略の信号を同時に誘発し,単一の戦略で発生するいくつかの誤った信号をフィルターします.
また,逆転策とトレンド策の組み合わせにより,短期逆転と中期トレンドを標識された証券価格に捉えることができます.
リスク分析
この戦略の主なリスクは,市場が長期にわたって振動的な調整をしているとき,二つの戦略が一致したシグナルを生成できない可能性があり,その結果,無効な市場状態を引き起こすというものである.この場合,トレーダーは,明瞭なトレンドが形成されるまで,この戦略の使用を一時停止する必要がある.
さらに,二指数移動平均は中長線指標として,短線が急速な反転したときに失敗することも可能である.これは,トレーダーがより多くの指標と組み合わせて大盤の動きを判断する必要がある.
最適化の方向
この戦略は以下の点で最適化できます.
ストップポイントやストップ幅の移動など,より多くのパラメータを追加して,戦略をより制御できるようにします.
複数のフィルタリング条件を形成し,より多くのノイズ取引を排除する. MACD,KDなどの他の指標を組み合わせるなど.
ブリンライン周期,移動平均周期などのパラメータの調整を最適化して,最適なパラメータの組み合わせを探します.
戦略の効果を異なる品種 (株式,外貨,暗号通貨など) でそれぞれテストし,最も適した品種を選択します.
要約する
双均線反転戦略は,反転戦略とトレンド戦略を組み合わせて,比較的に信頼性の高い総合的な取引信号を形成する.これは,証券価格の短期反転と中期トレンドの両方に興味のあるトレーダーに適用されます.しかし,長期の揺れ動いている状況でこの戦略は失敗する可能性があることに注意してください.パラメータの最適化とより多くの指標の追加により,この戦略の実用性をさらに高めることができます.
/*backtest
start: 2023-01-08 00:00:00
end: 2024-01-14 00:00:00
period: 1d
basePeriod: 1h
exchanges: [{"eid":"Futures_Binance","currency":"BTC_USDT"}]
*/

//@version=3
////////////////////////////////////////////////////////////
//  Copyright by HPotter v1.0 12/04/2019
// This is combo strategies for get
// a cumulative signal. Result signal will return 1 if two strategies
// is long, -1 if all strategies is short and 0 if signals of strategies is not equal.
//
// First strategy
// This System was created from the Book "How I Tripled My Money In The
// Futures Market" by Ulf Jensen, Page 183. This is reverse type of strategies.
// The strategy buys at market, if close price is higher than the previous close
// during 2 days and the meaning of 9-days Stochastic Slow Oscillator is lower than 50.
// The strategy sells at market, if close price is lower than the previous close price
// during 2 days and the meaning of 9-days Stochastic Fast Oscillator is higher than 50.
//
// Secon strategy
// This indicator plots 2/20 exponential moving average. For the Mov
// Avg X 2/20 Indicator, the EMA bar will be painted when the Alert criteria is met.
// Please, use it only for learning or paper trading. Do not for real trading.
//
// WARNING:
// - For purpose educate only
// - This script to change bars colors.
////////////////////////////////////////////////////////////
Reversal123(Length, KSmoothing, DLength, Level) =>
    vFast = sma(stoch(close, high, low, Length), KSmoothing)
    vSlow = sma(vFast, DLength)
    pos = 0.0
    pos := iff(close[2] < close[1] and close > close[1] and vFast < vSlow and vFast > Level, 1,
	         iff(close[2] > close[1] and close < close[1] and vFast > vSlow and vFast < Level, -1, nz(pos[1], 0)))
	pos

EMA2_20(MA_Length, MA_xPrice) =>
    xXA = ema(MA_xPrice, MA_Length)
    nHH = max(high, high[1])
    nLL = min(low, low[1])
    nXS = iff((nLL > xXA)or(nHH < xXA), nLL, nHH)
    pos = 0.0
    pos := iff(nXS > close[1] , -1, iff(nXS < close[1] , 1, nz(pos[1], 0)))
    pos

strategy(title="Combo Backtest 123 Reversal and 2/20 EMA", shorttitle="Combo Backtest", overlay = true)
Length = input(14, minval=1)
KSmoothing = input(1, minval=1)
DLength = input(3, minval=1)
Level = input(50, minval=1)
MA_Length = input(20, minval=1)
reverse = input(false, title="Trade reverse")
MA_xPrice = close
posReversal123 = Reversal123(Length, KSmoothing, DLength, Level)
posEMA2_20 = EMA2_20(MA_Length, MA_xPrice)
pos = iff(posReversal123 == 1 and posEMA2_20 == 1 , 1,
	   iff(posReversal123 == -1 and posEMA2_20 == -1, -1, 0))
possig = iff(reverse and pos == 1, -1,
          iff(reverse and pos == -1, 1, pos))
if (possig == 1)
    strategy.entry("Long", strategy.long)
if (possig == -1)
    strategy.entry("Short", strategy.short)
if (possig == 0)
    strategy.close_all()
barcolor(possig == -1 ? red: possig == 1 ? green : blue )