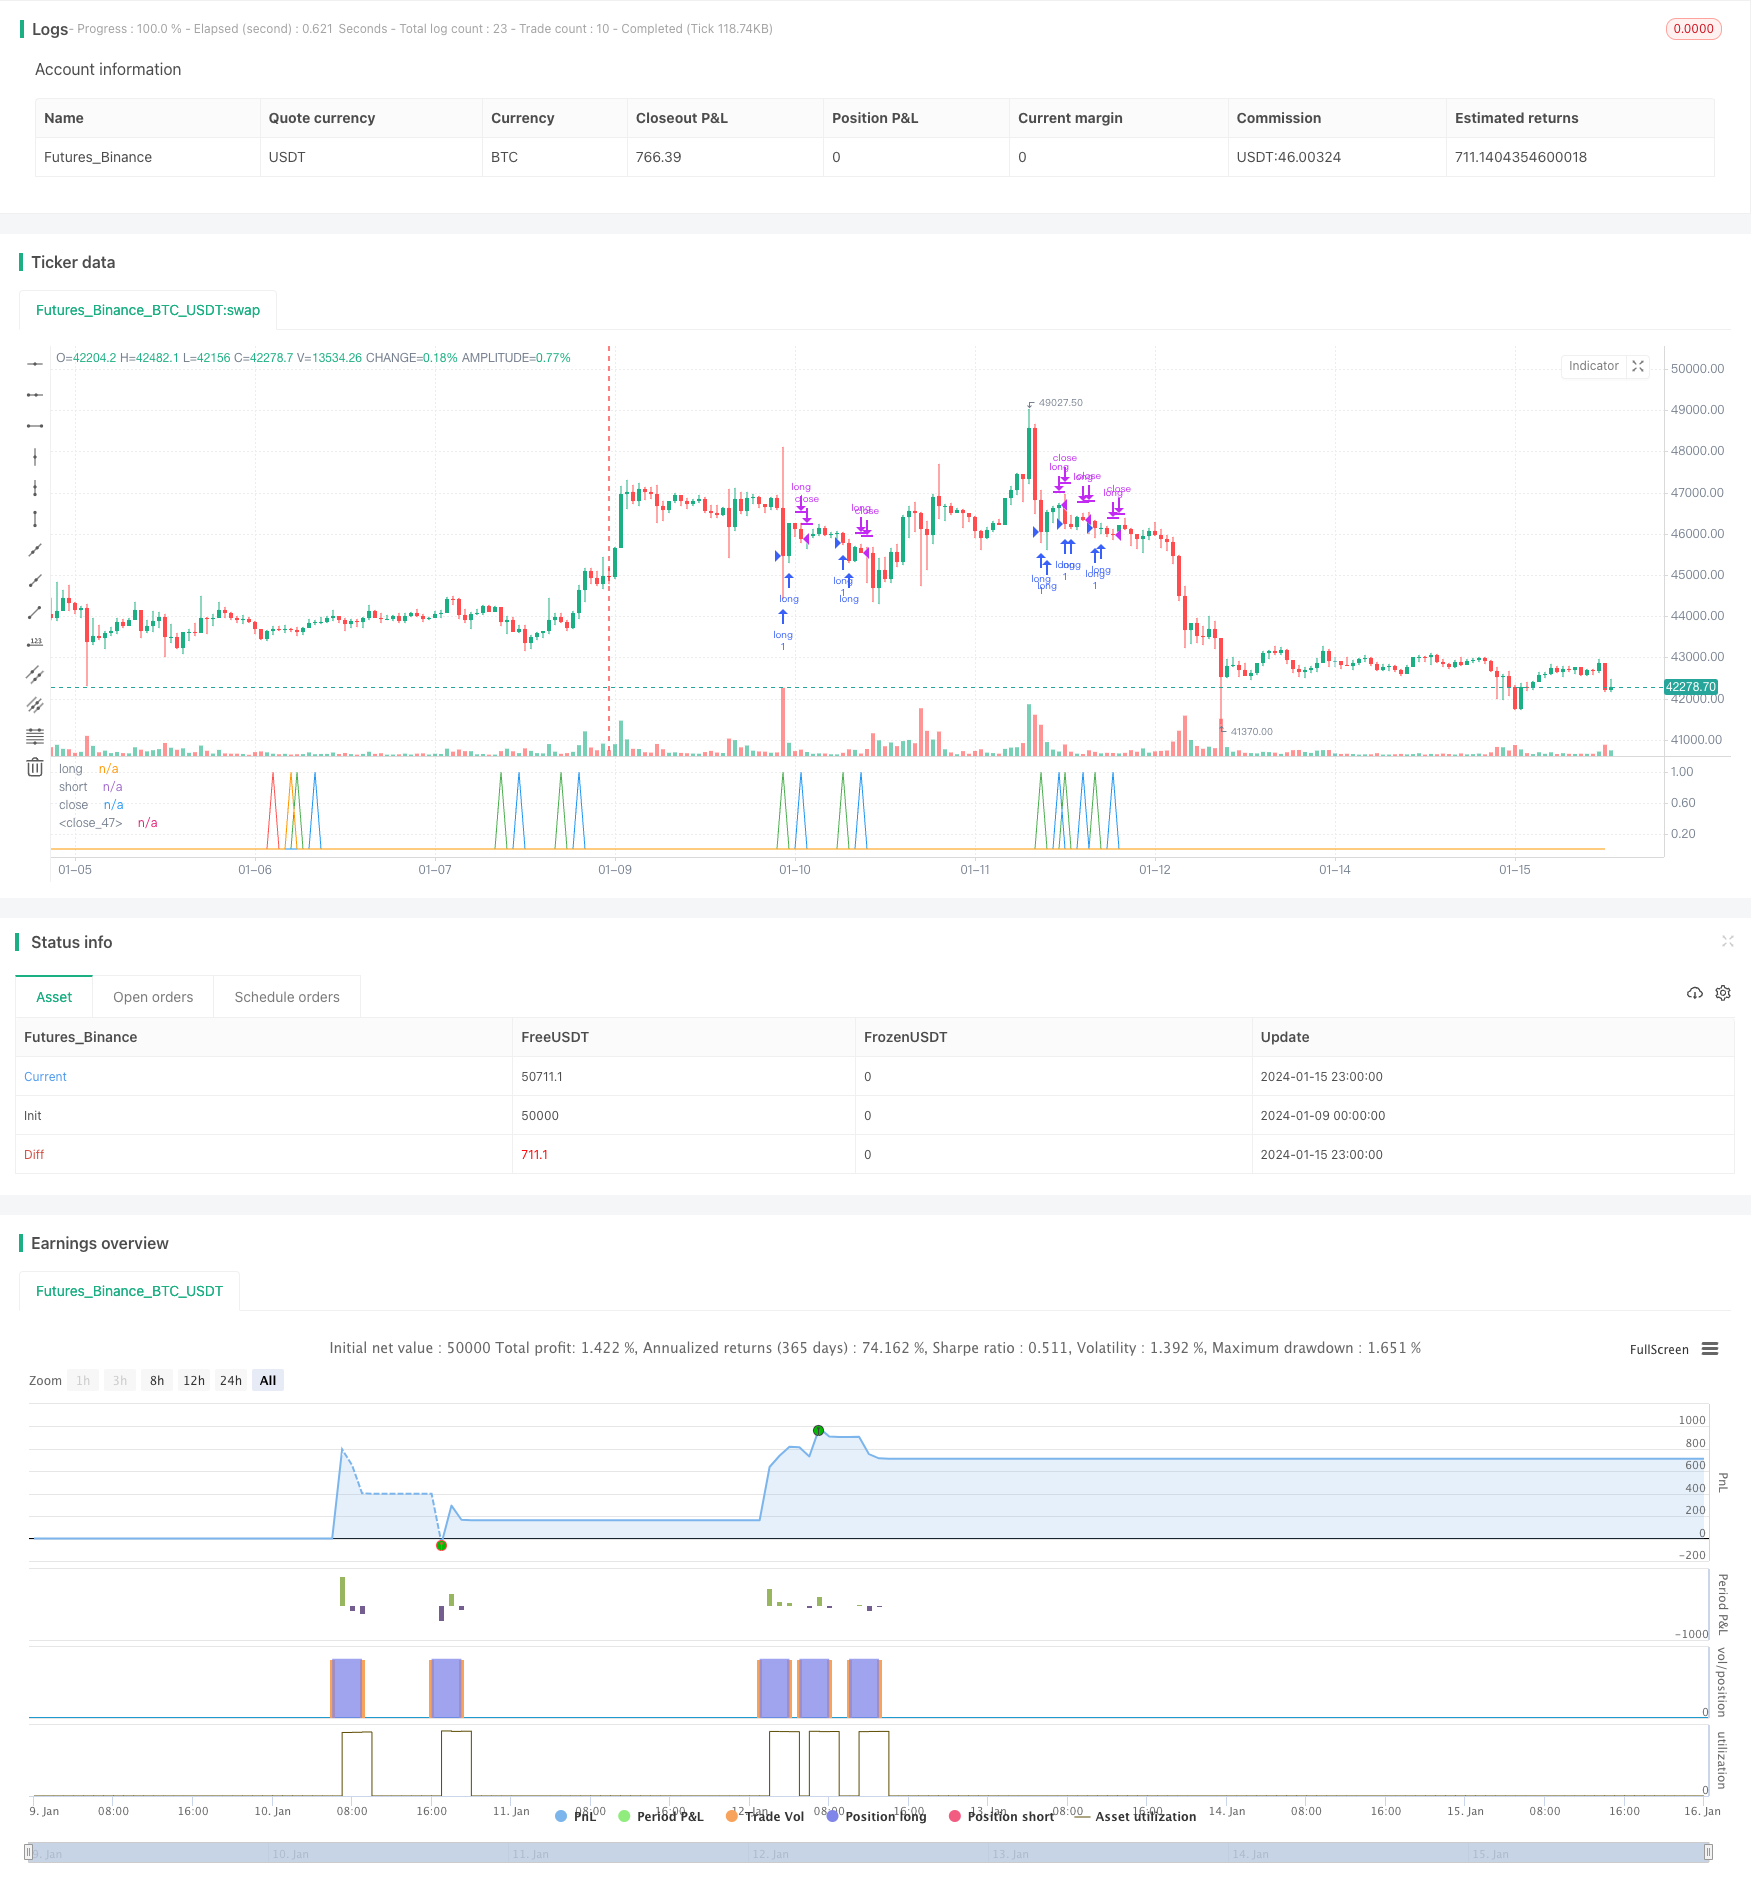
ダブル移動平均ゴールデンクロス戦略

概要
双移動平均線ゴールドクロス戦略は,移動平均線に基づく定量取引戦略である.この戦略は,異なる周期の移動平均を計算することによって,市場動向と買入のタイミングを判断する.短期移動平均線の上を長期移動平均線を横切ると,買い信号としてゴールドクロスが生じ,短期移動平均線の下を長期移動平均線を横切ると,売り信号としてデッドクロスが生じます.
戦略原則
双移動平均線金十字戦略の核心論理は,移動平均線の平滑性に基づいている.移動平均線は,市場騒音を効果的にフィルターし,大まかなトレンドの方向を示す.短期移動平均線は,価格変化に敏感で,最近の一段の価格変動情報を捉えることができる.長期移動平均線は,最近の価格変化に反応が遅いため,市場の一段のトレンドを反映することができる.短期移動平均線の上部に長期移動平均線を突破すると,市場が新たな上昇傾向を形成していることを示し,短期移動平均線を下部に長期移動平均線を突破すると,上昇が終了していることを示し,脱出を検討する必要がある.
双移動平均線戦略のもう一つの重要なポイントは,RSI指標である. RSIは,市場が超買い超売状態にあるかどうかを効果的に判断できる. RSIと組み合わせると,市場の転換点の近くで誤った取引が回避される. この戦略は,RSI指標が条件を満たしている場合にのみ,買入と売却のシグナルを生成する.
具体的には,この戦略の取引決定の論理は以下の通りです.
- 20サイクル,50サイクル,および100サイクル移動平均を計算する
- 20周期移動平均が50周期および100周期の移動平均を横切っているかどうかを判断し,満たされた場合,トレンドの上昇段階に入ることができる
- RSIが50未満の場合は,超買い領域に入っていないことを示す.
- この3つの条件が同時に満たされた場合,購入シグナルが生成されます.
- 20周期移動平均が50周期および100周期の移動平均を貫通しているかどうかを判断し,それが満たされれば,トレンドダウン段階に入る可能性があります
- RSIが48.5を超えているか確認し,超売り領域に入っていないことを示します.
- この3つの条件が同時に満たされると, 売り込みシグナルが生成されます.
この戦略は,複数のパラメータを組み合わせることで,偽の信号を効果的にフィルターし,取引決定の正確性を向上させています.
戦略的優位性
双移動均線金交差策には以下の利点がある.
- 戦略はシンプルで明確で,理解し,実行しやすい.
- パラメータの最適化 柔軟性 移動平均の周期を調整して異なる市場に対応する
- 移動平均とRSI指標の組み合わせを使用し,ノイズを効果的にフィルターし,市場の実際のトレンドを評価します.
- この戦略の収益は安定し,撤退は少ないと反省データから示されています.
- 戦略パラメータをさらに最適化するために,機械学習などの高度な技術を統合できます.
戦略リスク
双移動均線金交差策には以下のリスクもあります.
- 市場が急激に波動すると,移動平均は遅滞し,ベストバイ・ビッドポイントを逃す可能性があります.
- 戦略はパラメータに依存し,パラメータが正しく設定されていない場合,戦略の収益に大きな影響を与える
- 市場構造が変化し,移動平均とRSIのパラメータを調整する必要があります.
- 自動化取引戦略は,市場転換時に集中してポジションを保持しやすく,リスクが高い.
リスクを下げるには,以下の方法で最適化できます.
- 波動率指数などの波動率と波動幅を評価し,移動平均周期を動的に調整する
- パラメータを動的に最適化する機械学習モデルを追加
- ストップ・ストップ条件を設定し,単一の損失を過大にしないようにします.
- ポジション管理システムを導入し,市場状況に応じてポジションの規模を調整し,集中ポジションのリスクを低減する
戦略最適化の方向性
双移動均線金交差策にはさらに最適化できる余地があります.
- 取引量,ブリン帯などの他の指標のフィルタリング信号を追加し,戦略の安定性を向上させる
- マシン・ラーニングによるパラメータの動的最適化により,戦略をより賢くする
- 市場構造の変化に応じてパラメータを調整する,自主的な移動平均周期設定プログラムを設計
- 高級リスク管理システムと連携し,ポジションを動的に調整し,戦略的リスクを低減する
- アルゴリズム取引ポートフォリオを構築し,複数の取引戦略を統合し,安定性を向上させる
要約する
双移動均線金交差戦略は,非常に古典的な規則型定量取引戦略である.それは,簡単に実行しやすく,パラメータ最適化が柔軟であり,収益パフォーマンスは優れている.初心者入門定量取引の良い選択である.しかし,この戦略には一定の制限がある.さらなる研究と最適化により,より高い知能と安定性に向かって前進させ,真に持続的に収益性を持つことができる.
/*backtest
start: 2024-01-09 00:00:00
end: 2024-01-16 00:00:00
period: 1h
basePeriod: 15m
exchanges: [{"eid":"Futures_Binance","currency":"BTC_USDT"}]
*/

//@version=4
//Based on Larry Connors RSI-2 Strategy - Lower RSI
strategy(title="EA_3Minute_MagnetStrat", shorttitle="EA_3Minute_MagnetStrat", overlay=false)
src = close,
//RSI CODE
up = rma(max(change(src), 0), 30)
down = rma(-min(change(src), 0), 30)
rsi = down == 0 ? 100 : up == 0 ? 0 : 100 - (100 / (1 + up / down))
//Criteria for Moving Avg rules
ma20= vwma(close,20)
ma50 = vwma(close,50)
ma100= vwma(close,100)

//Rule for RSI Color
//col = ma30 > ma50 > ma200 and rsi <=53?lime: ma50 < ma200  and rsi >= 60?red : silver
long1 = ma20 > ma50 and ma50 > ma100 and rsi < 50
short1 = ma20 < ma50 and ma50 < ma100 and rsi > 48.5
//plot(rsi, title="RSI", style=line, linewidth=1,color=col)
//plot(100, title="Upper Line 100",style=line, linewidth=3, color=aqua)
//plot(0, title="Lower Line 0",style=line, linewidth=3, color=aqua)

//band1 = plot(60, title="Upper Line 60",style=line, linewidth=1, color=aqua)
//band0 = plot(44, title="Lower Line 40",style=line, linewidth=1, color=aqua)
//fill(band1, band0, color=silver, transp=90)
//strategy.entry ("buy", strategy.long, when=long)
//strategy.entry ("sell", strategy.short, when=short)
//plot(long,"long",color=green,linewidth=1)
//plot(short,"short",color=red,linewidth=1)
//
long = long1[1] == 0 and long1 == 1
short = short1[1] == 0 and short1 == 1
longclose = long[3] == 1
shortclose = short[3] == 1

//Alert

strategy.entry("short", strategy.short,qty = 1, when=short)
strategy.entry("long", strategy.long,qty=1, when=long)
plot(long,"long",color=green,linewidth=1)
plot(short,"short",color=red,linewidth=1)
strategy.close("long",when=longclose)
strategy.close("short",when=shortclose)

//strategy.exit(id="long",qty = 100000,when=longclose)
//strategy.exit(id="short",qty = 100000,when=shortclose)
plot(longclose,"close",color=blue,linewidth=1)
plot(shortclose,"close",color=orange,linewidth=1)
//strategy.exit(id="Stop", profit = 20, loss = 100)