Bollinger Band と RSI を DCA 戦略と混ぜる
作者: リン・ハーンチャオチャン開催日:2024年1月18日11時23分15秒タグ:

概要
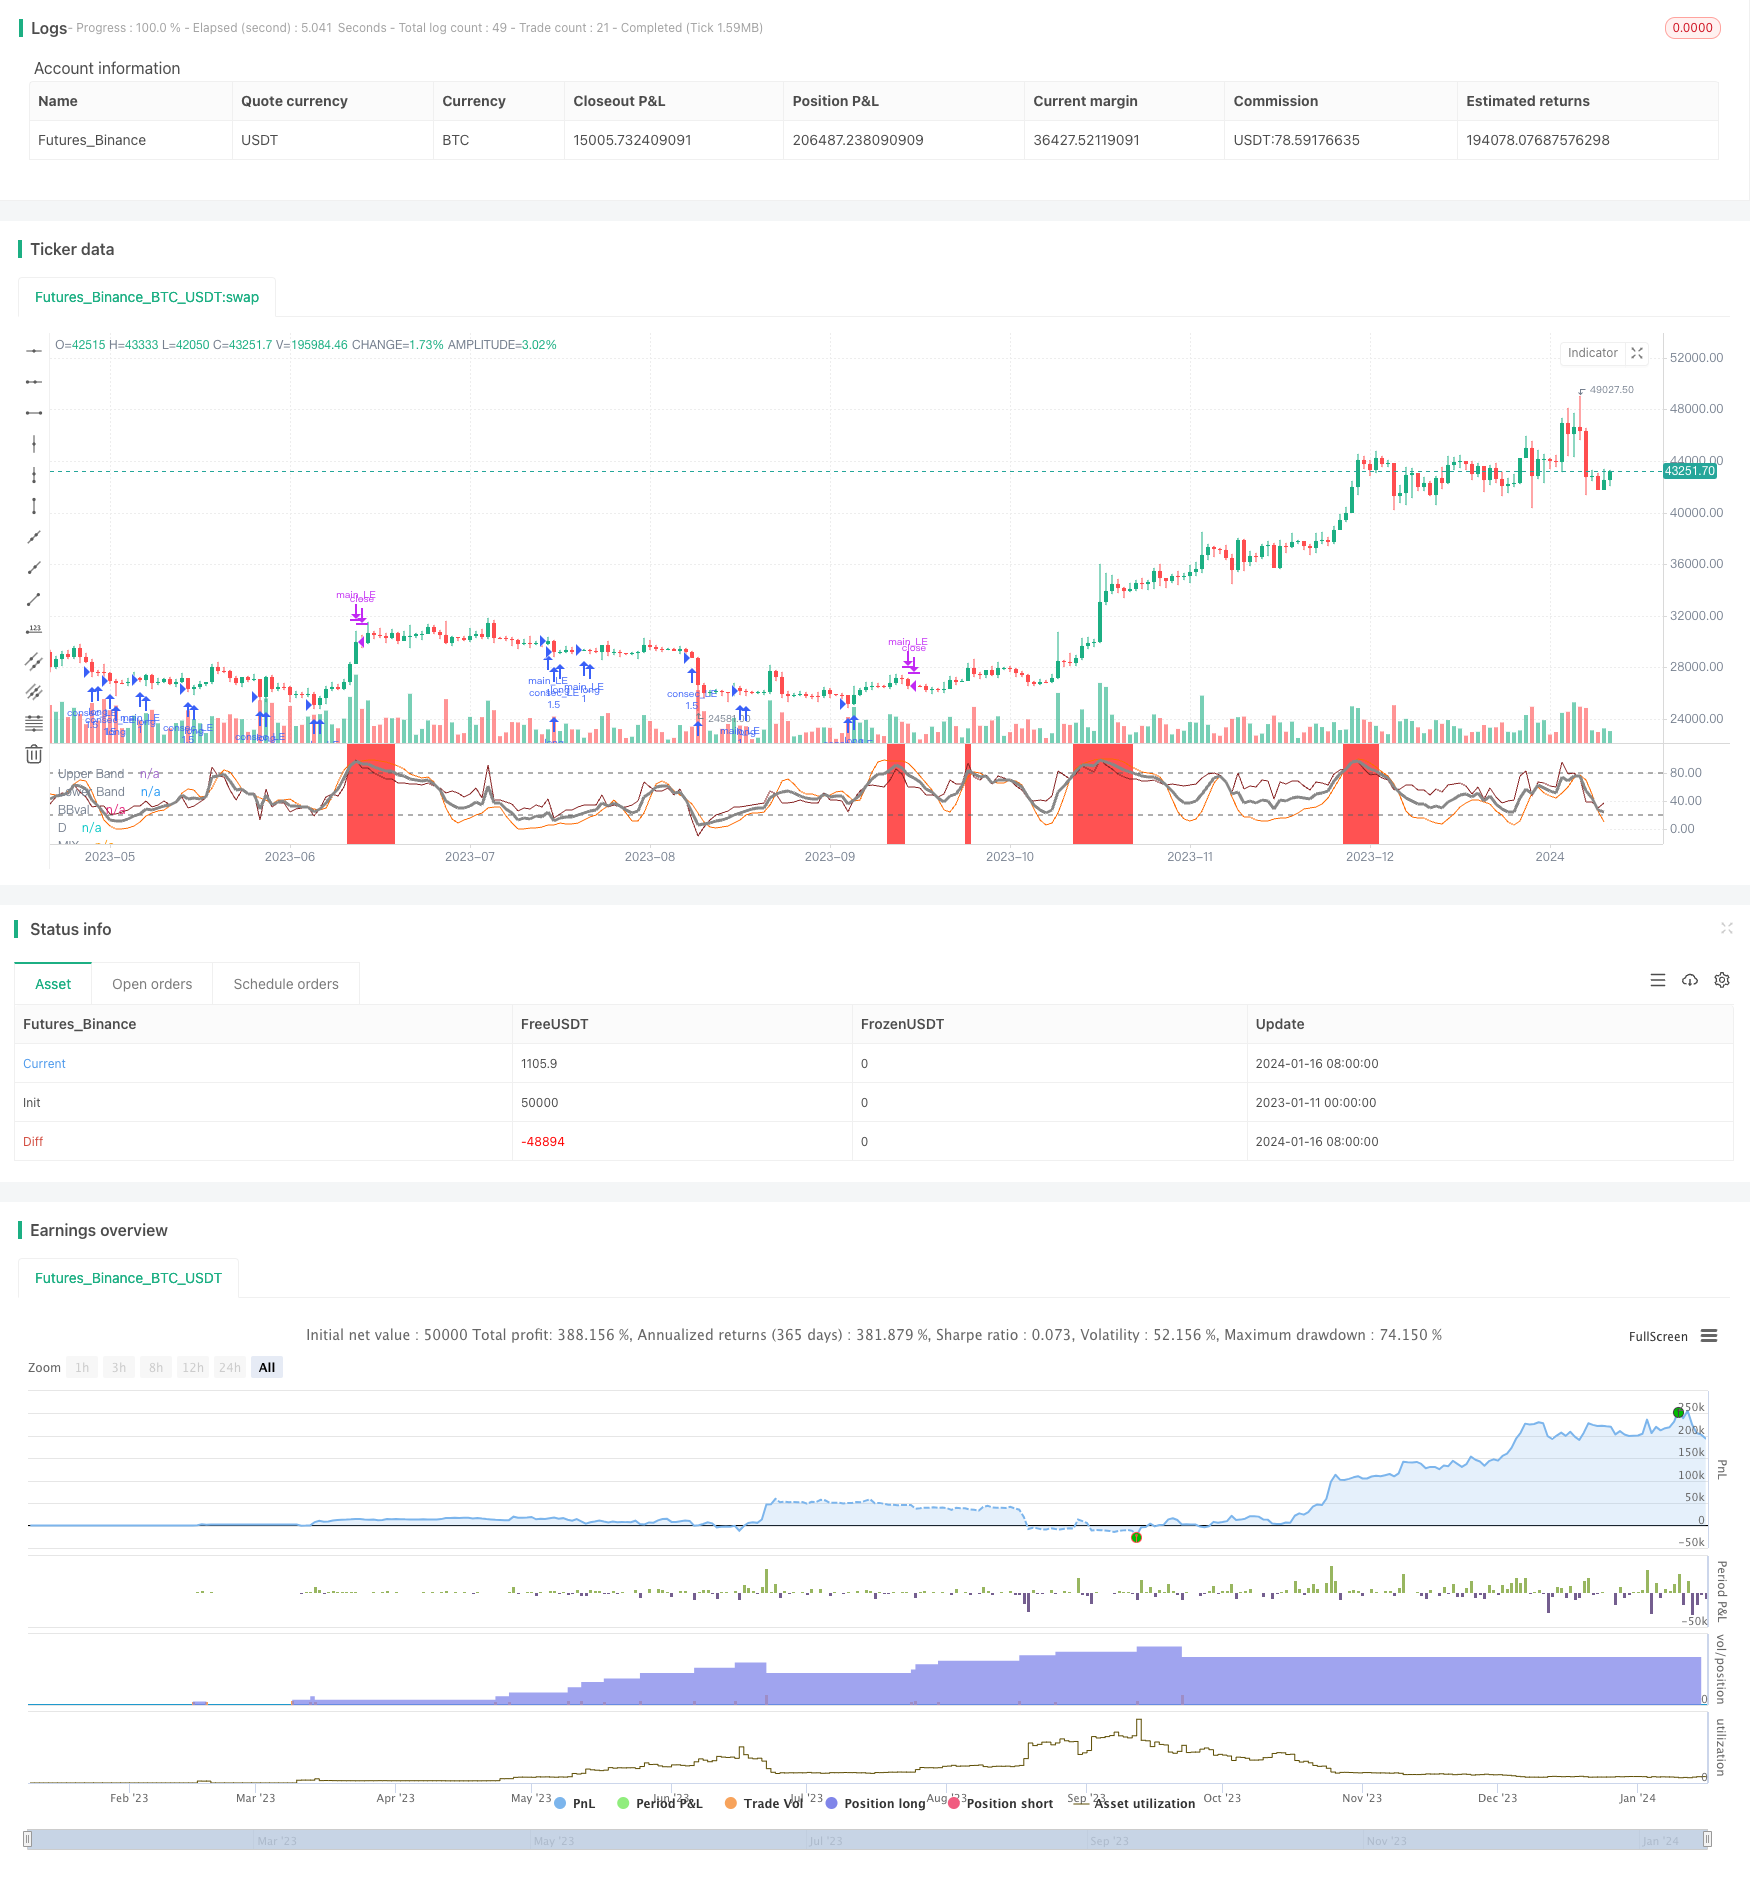
この戦略は,ボリンジャーバンドとRSIをDCAと混合する
戦略原則
この戦略は,ボリンジャーバンドとRSIインジケーターを統合している.ボリンジャーバンドは,中間帯の上は牛市場,下は熊市場を意味する傾向を明確に判断する.RSIはオーバーバイ・オーバーセール状況を示す.この戦略は,ボリンジャーバンド偏差とRSIのK値を重量化することによってMIXインジケーターを構築する.MIXインジケーターが下から20を突破すると,ロング信号が生成される.
進行型DCAの部分では,MIXが20を突破すると初期ポジションが開かれ,価格が一定の割合で下落するたびに,額定額で追加ポジションが追加されます.最大ポジションに達するか,ストップ損失/テイク・プロフィートがトリガーされるまで継続されます.市場低点のポジションを複数回追加することで,平均コストは徐々に低下することができます.
戦略 の 利点
-
2つの指標を組み合わせると,より明確なトレンド判断によって信号の正確性が向上します.
-
漸進的なDCAは,減少時のコストベースを下げ,損失リスクを軽減し,利益範囲を拡大します.
-
利益とストップ・ロスの条件は リスクを迅速に制御し 部分的な利益を固定します
-
追加された日付範囲フィルタにより,特定の期間を対象としたバックテストと最適化が可能になります.
リスク と 解決策
-
ボリンジャー帯とRSIの両方が失敗する可能性があります. 信号の正確さを最大限に高めるために異なるパラメータの組み合わせをテストすることができます.
-
進歩的なDCAは,ポジションを継続的に追加することで,大きなクラッシュ時の損失を増加させることができます.リスク制御のために適切なストップ損失レベルとともに最大エントリを設定することができます.
-
ブラック・スワン・イベントや異常な価格動向は予測できない.主要指数を用いたシステムリスクフィルターは異常期間の回避に役立つ.
オプティマイゼーションの方向性
-
MIX指標のパラメータをテストし最適化することで,より正確な取引信号を得ることができます.
-
ストップ・ロスを最適化して 利潤のパラメータを 取ることで 最良の利潤/損失比を得る
-
最適な組み合わせを見つけるために 異なる加算位置サイズと周波数をテストします
-
取引量管理モジュールを,取引量条件に基づく開閉戦略に追加することを検討する.
概要
/*backtest
start: 2023-01-11 00:00:00
end: 2024-01-17 00:00:00
period: 1d
basePeriod: 1h
exchanges: [{"eid":"Futures_Binance","currency":"BTC_USDT"}]
*/

// © lagobrian23
//@version=4
strategy(title = 'Bollinger Bands and RSI mix with DCA', shorttitle = 'BB/RSI with DCA',pyramiding = 20, calc_on_every_tick = true, overlay = false )
source=close
smoothK = input(3, "K", minval=1)
smoothD = input(3, "D", minval=1)
lengthRSI = input(14, "RSI Length", minval=1)
lengthStoch = input(14, "Stochastic Length", minval=1)
src = input(close, title="RSI Source")
rsi1 = rsi(src, lengthRSI)
k = sma(stoch(rsi1, rsi1, rsi1, lengthStoch), smoothK)
d = sma(k, smoothD)

// Bollinger Band

length = input(20,title = 'BB lookback length', minval=1)
mult = input(2.0, minval=0.001, maxval=50, title="StdDev")
basis = sma(src, length)
dev = mult * stdev(src, length)
upper = basis + dev
lower = basis - dev
BBval = (src - basis)/dev*30+50
offset = input(0, title = "Offset", type = input.integer, minval = -500, maxval = 500)
mix=(d + BBval)/2

//plot
//plot(k, "K", color=#606060)
plot(BBval, "BBval", color=#872323, offset = offset)
plot(d, "D", color=#FF6A00)
h0 = hline(80, "Upper Band", color=#606060)
h1 = hline(20, "Lower Band", color=#606060)
plot(mix, "MIX", color=#888888, linewidth=3)

//background MIX
bgcolor(mix < 20 ? color.green : color.white, transp=50)
bgcolor(mix > 80 ? color.red : color.white, transp=50)

// Choosing the date range
fromMonth = input(defval = 1,    title = "From Month",      type = input.integer, minval = 1, maxval = 12)
fromDay   = input(defval = 1,    title = "From Day",        type = input.integer, minval = 1, maxval = 31)
fromYear  = input(defval = 2020, title = "From Year",       type = input.integer, minval = 1970)
toMonth = input(defval = 1,    title = "To Month",      type = input.integer, minval = 1, maxval = 12)
toDay   = input(defval = 1,    title = "To Day",        type = input.integer, minval = 1, maxval = 31)
toYear  = input(defval = 2112, title = "To Year",       type = input.integer, minval = 1970)

start     = timestamp(fromYear, fromMonth, fromDay, 00, 00)        // backtest start window
finish    = timestamp(toYear, toMonth, toDay, 23, 59)        // backtest finish window
window()  => true

// Initializing the strategy paraeters

P = input(defval = 1, title = 'Amount (P)' , type = input.integer, minval = 1, maxval = 100)
X = input(defval = 2, title = '% Price drop for consecutive entries(X)', type = input.float, minval = 1, maxval = 100)
B_tp = input(defval = 10, title = '% Level for Take Profit (B)', type = input.float , minval = 1, maxval = 100)
D_sl = input(defval = 10, title = '% Level for Stop Loss (D)', type = input.float, minval = 1, maxval = 100)
A = input(defval = 5, title = 'Max consecutive entries (A)', type = input.integer, minval = 2, maxval = 20)
Z = input(defval = 0.5, title = 'Z', type = input.float , minval = 0, maxval = 10)

// Declaring key DCA variables
entry_price = 0.0
entry_price := na(entry_price[1]) ? na : entry_price[1]
new_entry = 0.0
consec_entryCondition = false
// Implementing the strategy
longEntry = crossover(mix,20)
exitLongs = crossunder(mix, 80)

if(longEntry)
    entry_price := close
    strategy.entry('main_LE', strategy.long , P, when = window() and longEntry)

// Exiting conditions
stoploss = strategy.position_avg_price*(1-(D_sl/100))
takeprofit = strategy.position_avg_price*(1+(B_tp/100))
slCondition = crossunder(close, stoploss)
tpCondition = crossover(close, takeprofit)

// We want to exit if the 'mix' indicator crosses 80, take profit is attained or stop loss is tagged.
exitConditions = exitLongs or slCondition or tpCondition

// Consecutive entries upto A times
// strategy.risk.max_intraday_filled_orders(A)

//Dollar-Cost-Averaging
// Enter long whenever price goes down X%: amount set to (P+Y)*Z
newAmount = (P+X)*Z
// If we haven't reached max open trades, buy newAmount immediately price crosses under X% lower the previous entry price
new_entry := entry_price - ((X/100)*entry_price)
consec_entryCondition := crossunder(close, new_entry)
if(consec_entryCondition and strategy.opentrades != A)
    strategy.entry('consec_LE', strategy.long, newAmount, oca_name = 'consecLongs', when = window() and consec_entryCondition)
    entry_price := close

// Exiting
// The main trade is closed only when the  main exit conditions are satisfied
strategy.close('main_LE', comment = 'Main Long Closed', when = window() and exitConditions)

// A consective long is closed only when tp or sl is tagged
strategy.exit('ext a consec', 'consec_LE', loss = D_sl*strategy.position_avg_price , profit = B_tp*strategy.position_avg_price, oca_name =  'consecLongs')
- パラボリック SAR トレンド トラッキング 戦略
- ボリンジャー・バンドのブレイクアウト戦略
- 多要素移動平均傾向 戦略に従った
- 多期トレンド追跡戦略
- 週間の突破移動平均取引戦略
- RSI+ボリンジャー・バンドス ブレイクストラテジー ローワーエリア
- パラボリックSAR,ストックおよび証券指標に基づく多期数値取引戦略
- ゴールドの急速な突破 EMA取引戦略
- 2つの要素によるモメント追跡逆転戦略
- モメント・リバーサル・トレーディング・戦略
- エマ・プルバック ショート戦略
- ノロバンドのモメンタムポジション戦略
- 二重確認逆転傾向追跡戦略
- MACD インディケーター駆動型 OBV 量子取引戦略
- ダウントレンド戦略後のドルコスト平均値
- 三重指標 感情を駆使した脱出戦略
- 移動平均値,価格パターン,および量に基づいたトレンド逆転戦略
- 2重移動平均戦略
- モメント・ムービング・平均クロスオーバー・トレード戦略
- 二重移動平均金十字戦略