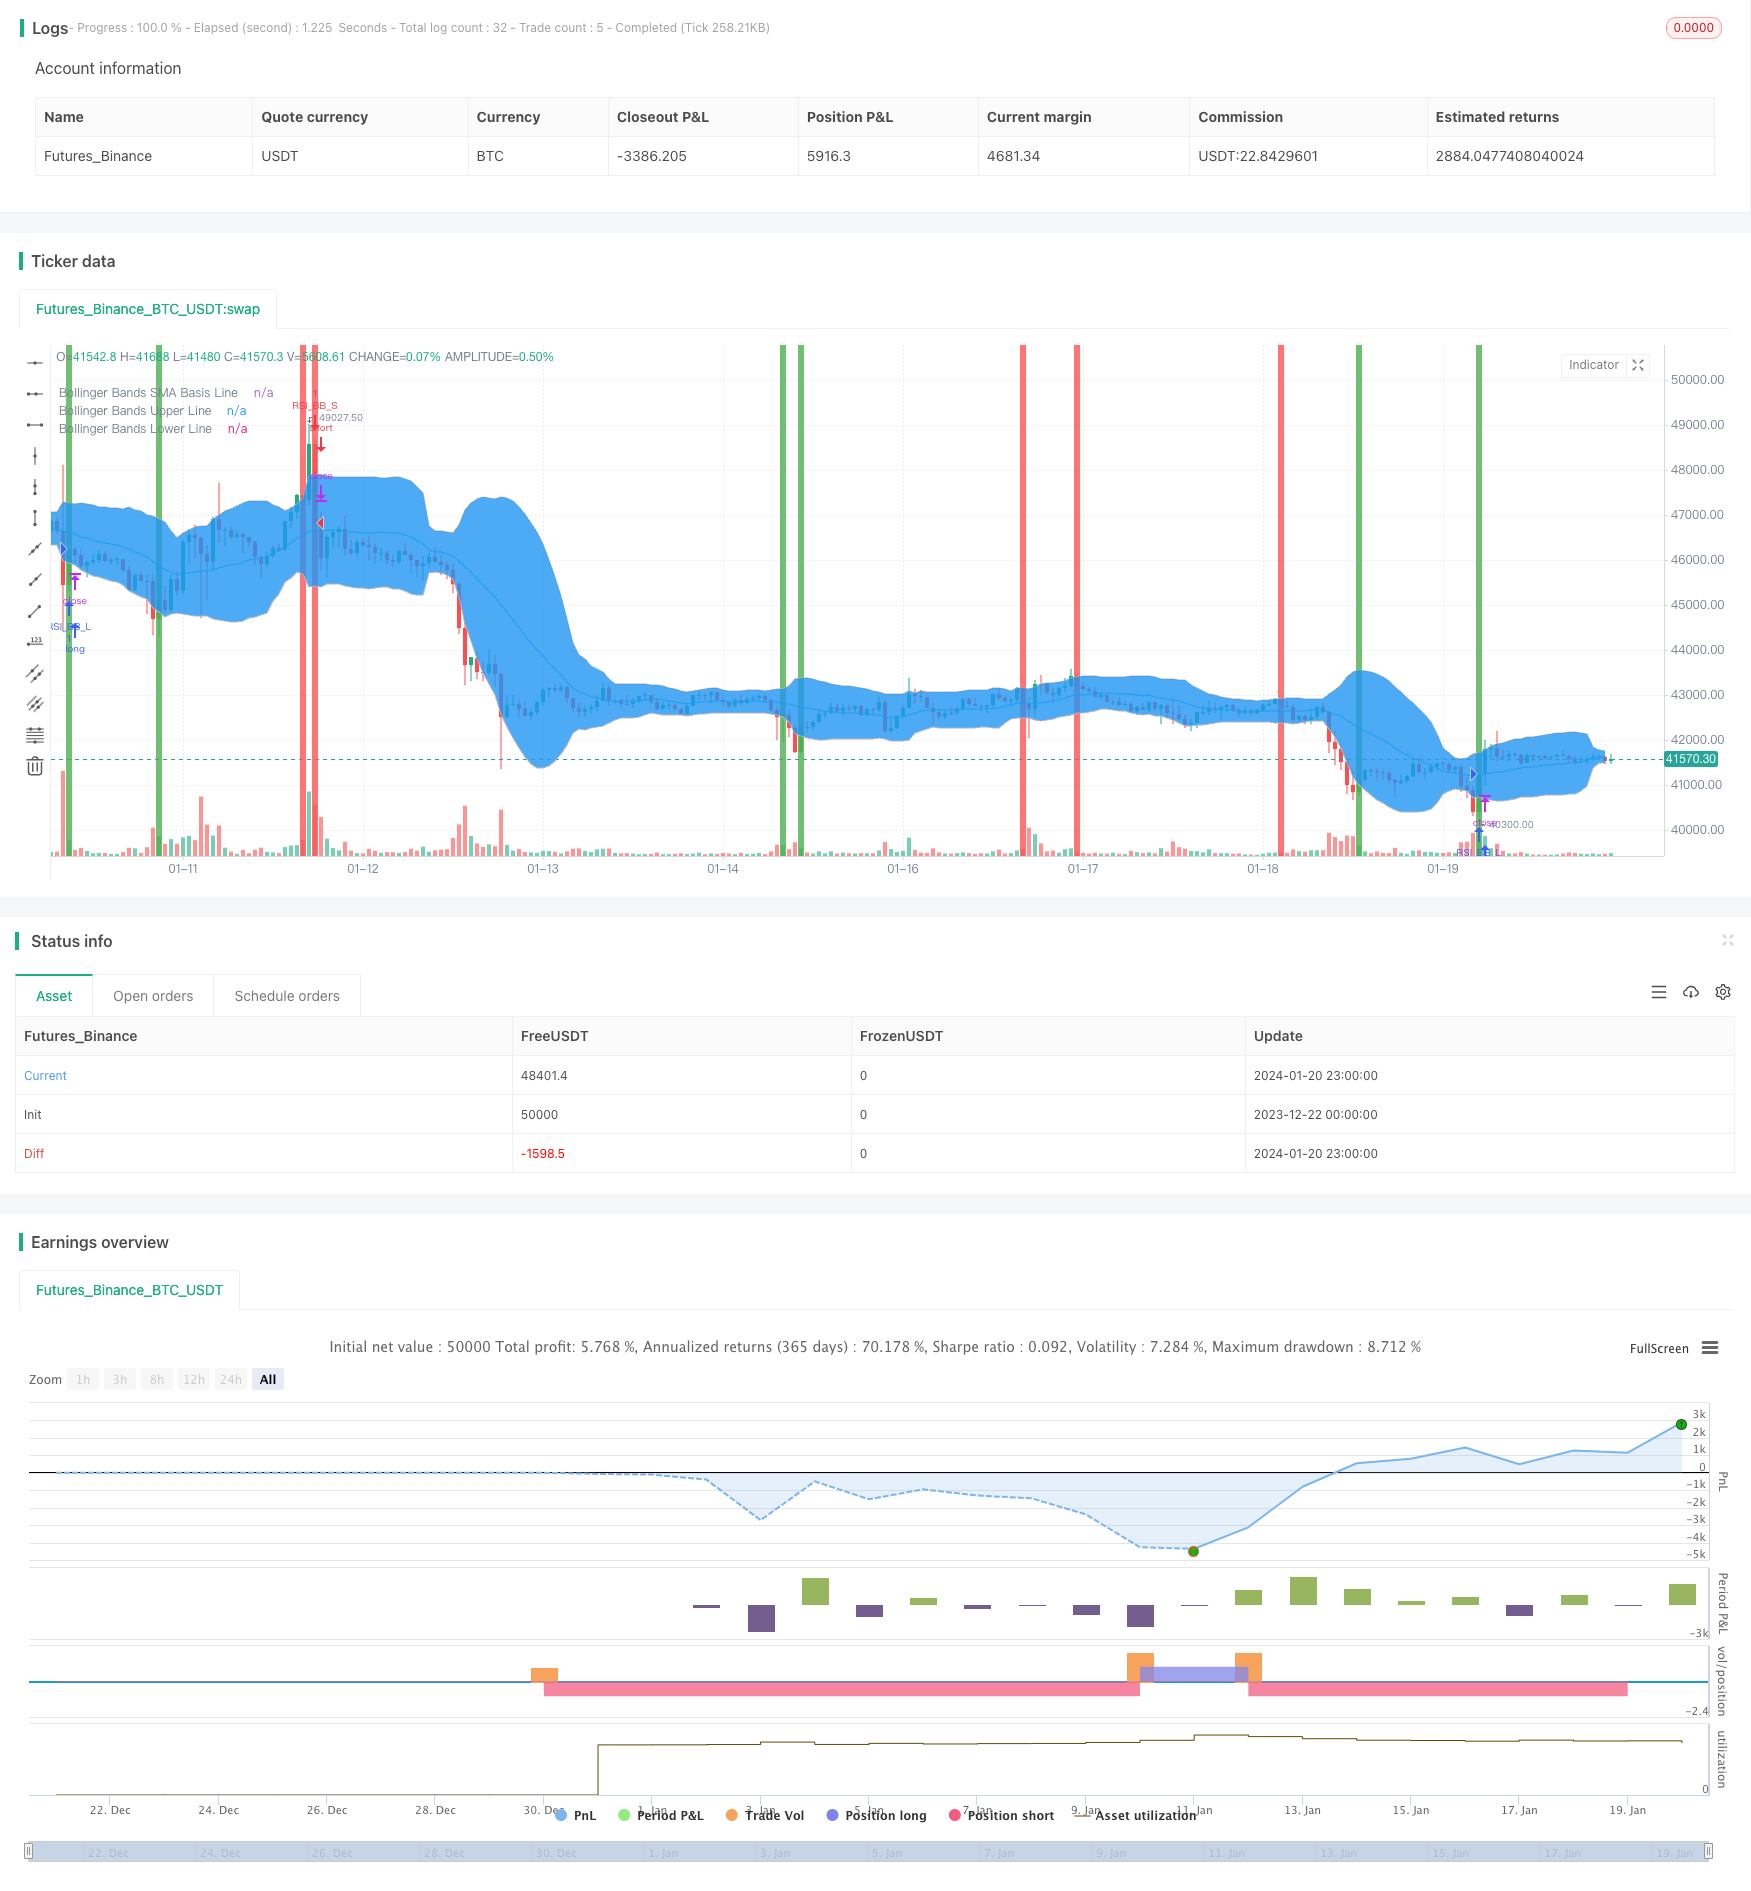
モメンタムとトレンドフォローのデュアル戦略

概要
この戦略は,相対的に強い弱い指数 ((RSI) とブリン帯の2つの指標を組み合わせて,二重確認の開場ポジションと平和ポジションロジックを実現する. RSIとブリン帯が同時にオーバーバイまたはオーバーセールシグナルを示しているときに,この戦略は取引シグナルを発信する. これは,偽の信号を効果的に軽減し,戦略の安定性を向上させる.
戦略原則
- RSIの判断論理
- RSIが45を突破すると,超売り信号として考えられます.
- RSIが55を突破すると,オーバーバイの信号になります.
- ブルインの判断の論理
- 価格が上昇し,ブリンが下落すると,超売りとみなされる.
- 価格を下げてブリンを履くと,超買いだと考えられる.
- 双重確認の論理
- RSIとブリン帯が同時にオーバーセール信号を発したときにのみ,オーバーポジションを入れます.
- RSIとブリン帯が同時にオーバーバイの信号を発したときにのみ,空きポジションを開きます.
この論理は,安定した二重確認の平準化策を実現する.
優位分析
二重確認メカニズムは,多くのノイズ取引をフィルターし,不必要な取引を回避し,取引コストを削減し,利潤率を向上させます.
RSIはトレンドと逆転を効果的に識別し,ブリン帯はサポートとレジスタンスを効果的に判断します.
パラメータ設定は柔軟で,異なる品種と取引の好みに合わせて調整できます.
リスク分析
波動的な状況では,RSIとブリン帯の指標は同時に誤信号を発し,不必要な損失を引き起こす可能性があります.パラメータを最適化することで誤判の可能性を減らすことができます.
二重確認メカニズムは,入場遅延をわずかに高め,非常に短いラインの取引機会を逃す可能性があります. 遅延に非常に敏感な戦略には適していません.
この戦略はパラメータに非常に敏感であり,不適切なパラメータ設定は,収益率を大幅に低下させることがあります.最適なパラメータの組み合わせを見つけるために十分な反省と復元が必要です.
最適化の方向
異なる周期のRSI指標をテストして,最もマッチする周期パラメータを見つけ,指標の効果を向上させることができます.
ストップロジックは,合理的な移動ストップまたは固定ストップを設定し,単一の損失リスクを制御することができます.
ブリン帯の通路幅のパラメータをテストし,通路範囲を最適化し,ブリン帯の識別効果を向上させることができる.
策略の安定性を高めるために最適な価格の入力を探すために,閉盘価格,最高価格,最低価格など,異なる価格の入力をテストすることができます.
要約する
この戦略は,RSI指標とブリン帯の指標を組み合わせて,二重確認の論理を実現し,十分な取引機会を保証し,ノイズ取引を効果的に軽減します.合理的なパラメータの最適化とリスク管理により,この戦略は,非常に安定した信頼性の高いトレンド追跡と取引戦略になります.
/*backtest
start: 2023-12-22 00:00:00
end: 2024-01-21 00:00:00
period: 1h
basePeriod: 15m
exchanges: [{"eid":"Futures_Binance","currency":"BTC_USDT"}]
*/

//@version=2
strategy("Bollinger + RSI, Double Strategy (by ChartArt)", shorttitle="CA_-_RSI_Bol_Strat", overlay=true)

// ChartArt's RSI + Bollinger Bands, Double Strategy
//
// Version 1.0
// Idea by ChartArt on January 14, 2015.
//
// This strategy uses a modfied RSI to sell
// when the RSI increases over the value of 55
// (or to buy when the value falls below 45),
// with the classic Bollinger Bands strategy
// to sell when the price is above the
// upper Bollinger Band (and to buy when
// this value is below the lower band).
//
// This simple strategy only triggers when
// both the RSI and the Bollinger Bands
// indicators are at the same time in
// a overbought or oversold condition.
//
// List of my work:
// https://www.tradingview.com/u/ChartArt/
//
//  __             __  ___       __  ___
// /  ` |__|  /\  |__)  |   /\  |__)  |
// \__, |  | /~~\ |  \  |  /~~\ |  \  |
//
//


///////////// RSI
RSIlength = input( 16 ,title="RSI Period Length")
RSIvalue = input( 45 ,title="RSI Value Range")
RSIoverSold = 0 + RSIvalue
RSIoverBought = 100 - RSIvalue
price = close
vrsi = rsi(price, RSIlength)


///////////// Bollinger Bands
BBlength = input(20, minval=1,title="Bollinger Bands SMA Period Length")
BBmult = input(2.0, minval=0.001, maxval=50,title="Bollinger Bands Standard Deviation")
BBbasis = sma(price, BBlength)
BBdev = BBmult * stdev(price, BBlength)
BBupper = BBbasis + BBdev
BBlower = BBbasis - BBdev
source = close
buyEntry = crossover(source, BBlower)
sellEntry = crossunder(source, BBupper)
plot(BBbasis, color=aqua,title="Bollinger Bands SMA Basis Line")
p1 = plot(BBupper, color=silver,title="Bollinger Bands Upper Line")
p2 = plot(BBlower, color=silver,title="Bollinger Bands Lower Line")
fill(p1, p2)


///////////// Colors
switch1=input(true, title="Enable Bar Color?")
switch2=input(true, title="Enable Background Color?")
TrendColor = RSIoverBought and (price[1] > BBupper and price < BBupper) ? red : RSIoverSold and (price[1] < BBlower and price > BBlower)  ? green : na
barcolor(switch1?TrendColor:na)
bgcolor(switch2?TrendColor:na,transp=50)


///////////// RSI + Bollinger Bands Strategy
if (not na(vrsi))

    if (crossover(vrsi, RSIoverSold) and crossover(source, BBlower))
        strategy.entry("RSI_BB_L", strategy.long, stop=BBlower,  comment="RSI_BB_L")
    else
        strategy.cancel(id="RSI_BB_L")

    if (crossunder(vrsi, RSIoverBought) and crossunder(source, BBupper))
        strategy.entry("RSI_BB_S", strategy.short, stop=BBupper, comment="RSI_BB_S")
    else
        strategy.cancel(id="RSI_BB_S")

//plot(strategy.equity, title="equity", color=red, linewidth=2, style=areabr)