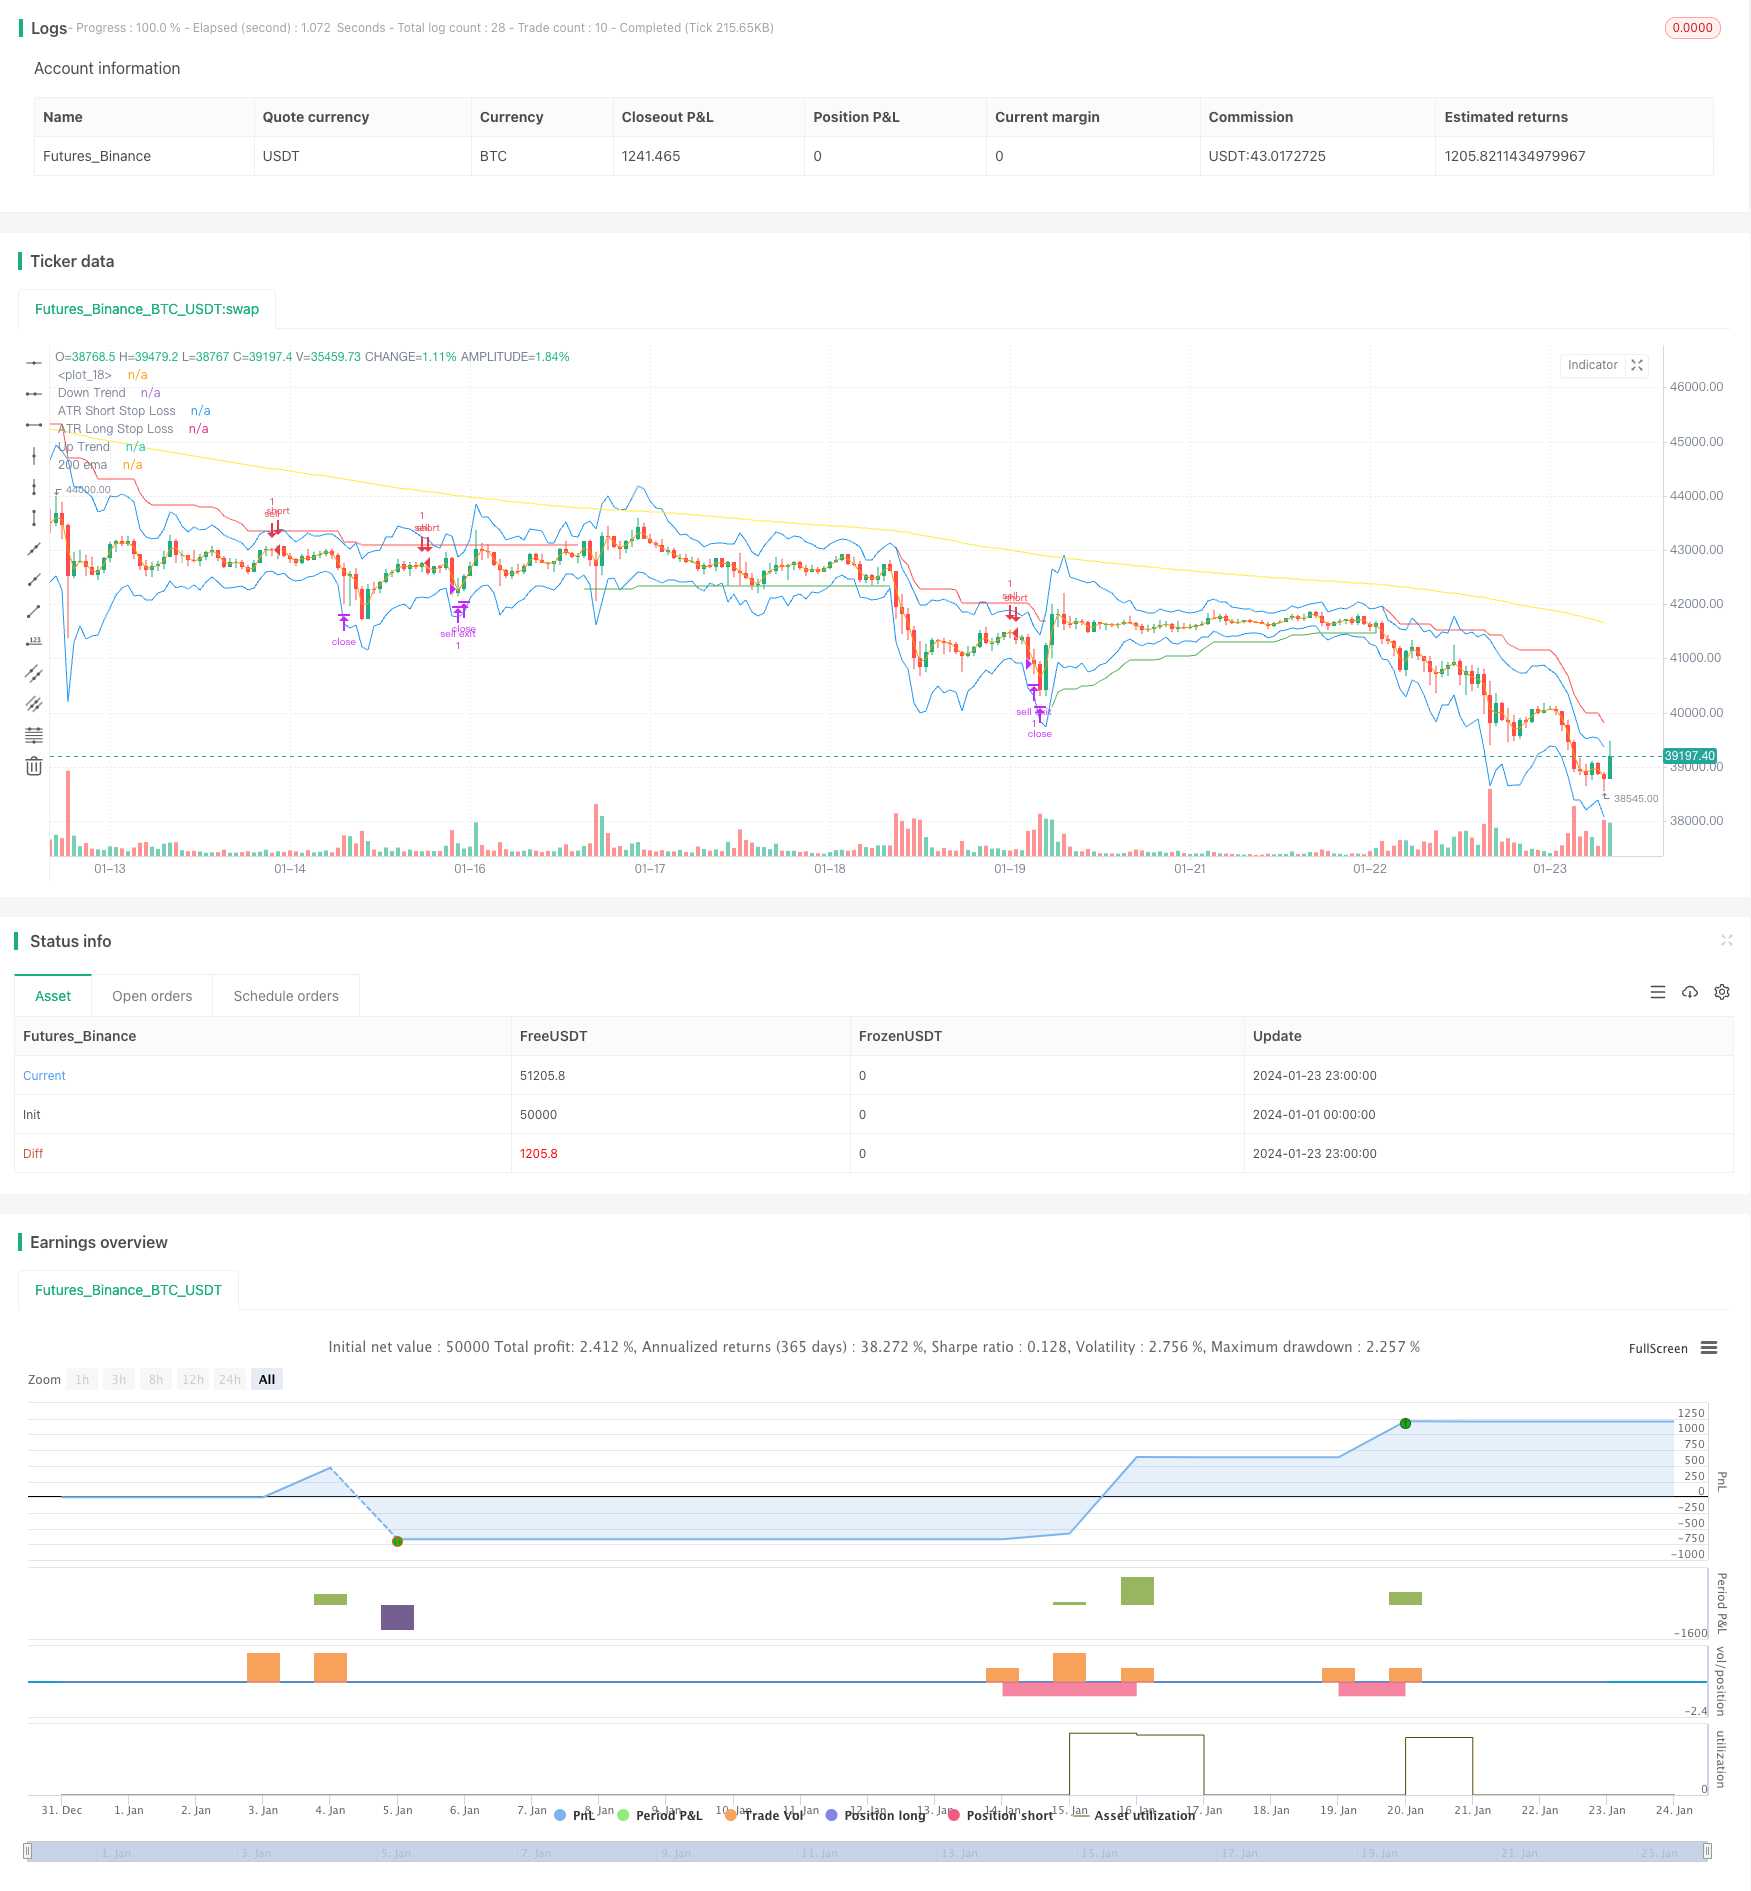
ストキャスティクス スーパートレンド トレーリング ストップ トレーディング戦略

概要
これは,複数の技術指標を組み合わせた追跡ストップトレード戦略である.この戦略は,取引シグナルを識別し,ストップロスを設定するために,主にSupertrend,Stochastic,200日移動平均およびATRストップを使用する.この戦略は,中長期トレンドトレードに適しており,リスクを効果的に制御できます.
戦略原則
ストキャスティックK線が超買区から下落し,スーパートレンドがトレンドを上向きに指示し,価格が200日移動平均を突破したときに,多めに; ストキャスティックK線が超売り区から上向きに指示し,スーパートレンドがトレンドを下向きに指示し,価格が200日移動平均を突破したときに,空白に.取引後にATR指数を使用して動的にストップロスを設定する.
具体的には,ストキャスティックK値が80を超えると,超買い信号とみなされ,ストキャスティックK値が20を超えると,超売り信号とみなされる.スーパートレンド指標は価格のトレンド方向を決定し,スーパートレンドが上向きに指示すると,価格は上昇傾向にあり,スーパートレンドが下向きに指示すると,価格は下向きの傾向にあることを意味する.ATR指標は,実際の波幅を計算するために使用される.
複数のシグナルをトリガーする条件:ストキャスティックK線が超買区から下落 ((<80)),スーパートレンドが上方指示,価格が200日移動平均より上である。
空気信号のトリガー条件:ストキャスティックK線が超売り区から上昇 (<20以上),スーパートレンドは下方を指し,価格は200日移動平均より低い.
入場後,価格変動制御リスクを追跡するためにATRストップを設定します. 多単位のストップは最低価格減算ATR値の倍数; 空券ストップは最高価格加算ATR値の倍数です.
戦略的優位性
この戦略は,トレンドの方向と入場時刻を判断する複数の指標と組み合わせて,偽の信号を効果的にフィルターすることができます.同時に,ATRの動的なストップロスを採用することで,市場の変動状況に応じてリスクを制御し,資金を最大限に保存することができます.
単純移動平均などのトレンド追跡戦略よりも,この戦略は転換点をよりうまく捉えることができる.単一のストップ方法と比較して,このATR動的ストップはより柔軟である.したがって,この戦略は全体的にリスクと利益の比率が優れている.
戦略リスク
この戦略は,主に指標判断に依存し,指標が誤った信号を発した場合は,逆操作による損失を引き起こす可能性がある.また,震動の状況では,止損は,頻繁に誘発され,損失をもたらす可能性がある.
さらに,ATRのストップは,変動に応じてストップを調整できるが,ストップが打ち破られる確率を完全に回避することはできません.価格が飛躍すると,ストップシートは直接触発される可能性があります.
戦略の最適化
この戦略は,以下の側面から最適化できます.
指数のパラメータを調整し,買い売り信号の精度を最適化する.例えば,異なるパラメータをテストできるストキャスティック指数,またはスーパートレンド指数のATR周期と倍数パラメータを調整する.
他の止損方法の効果をテストする.例えば,ATR止損よりも柔軟な自己適応性のあるスマート止損アルゴリズムを試すか,または止損が移動止損位に付随することを考慮する.
フィルタリング条件を追加し,より信頼性の高い状況で入場する.例えば,取引量エネルギー指標などのフィルタを追加して,量力が不足しているときに指標に基づいて誤って入場するのを避ける.
ポジションの動的調整など,資金管理戦略の最適化
要約する
ストキャスティック・スーパートレンドは,トレンドの方向性を判断する複数の指標を適用し,ATRのスマート・トラッキングを使用してリスクを制御するストキャスティック・スーパートレンドのストップトレンド戦略を統合しています.この戦略は,ノイズを効果的にフィルターし,リスク・リターン比率が優れています.この戦略は,パラメータを調整し,ストップ方法を変更し,フィルタリング条件を追加するなど,この戦略を継続的に最適化して,より複雑な市場環境に適応できるようにすることができます.
/*backtest
start: 2024-01-01 00:00:00
end: 2024-01-24 00:00:00
period: 1h
basePeriod: 15m
exchanges: [{"eid":"Futures_Binance","currency":"BTC_USDT"}]
*/

// This source code is subject to the terms of the Mozilla Public License 2.0 at https://mozilla.org/MPL/2.0/
// © araamas

//@version=5
strategy("stoch supertrd atr 200ma", overlay=true, process_orders_on_close=true)
var B = 0
if strategy.position_size > 0 //to figure out how many bars away did buy order happen
    B += 1

if strategy.position_size == 0
    B := 0

atrPeriod = input(10, "ATR Length")
factor = input.float(3.0, "Factor", step = 0.01)

[supertrend, direction] = ta.supertrend(factor, atrPeriod)

bodyMiddle = plot((open + close) / 2, display=display.none)
upTrend = plot(direction < 0 ? supertrend : na, "Up Trend", color = color.green, style=plot.style_linebr)
downTrend = plot(direction < 0? na : supertrend, "Down Trend", color = color.red, style=plot.style_linebr)

ema = ta.ema(close, 200)
plot(ema, title="200 ema", color=color.yellow)

b = input.int(defval=14, title="length k%")
d = input.int(defval=3, title="smoothing k%")
s = input.int(defval=3, title="smoothing d%")
smooth_k = ta.sma(ta.stoch(close, high, low, b), d)
smooth_d = ta.sma(smooth_k, s)

////////////////////////////////////////////////////////////////////////////////
length = input.int(title="Length", defval=12, minval=1)
smoothing = input.string(title="Smoothing", defval="SMA", options=["RMA", "SMA", "EMA", "WMA"])
m = input(1.5, "Multiplier")
src1 = input(high)
src2 = input(low)
pline = input(true, "Show Price Lines")
col1 = input(color.blue, "ATR Text Color")
col2 = input(color.teal, "Low Text Color",inline ="1")
col3 = input(color.red, "High Text Color",inline ="2")

collong = input(color.teal, "Low Line Color",inline ="1")
colshort = input(color.red, "High Line Color",inline ="2")

ma_function(source, length) =>
	if smoothing == "RMA"
		ta.rma(source, length)
	else
		if smoothing == "SMA"
			ta.sma(source, length)
		else
			if smoothing == "EMA"
				ta.ema(source, length)
			else
				ta.wma(source, length)

a = ma_function(ta.tr(true), length) * m
x = ma_function(ta.tr(true), length) * m + src1
x2 = src2 - ma_function(ta.tr(true), length) * m

p1 = plot(x, title = "ATR Short Stop Loss", color=color.blue)
p2 = plot(x2, title = "ATR Long Stop Loss", color= color.blue)


///////////////////////////////////////////////////////////////////////////////////////////////

shortCondition = high < ema and direction == 1 and smooth_k > 80
if (shortCondition) and strategy.position_size == 0
    strategy.entry("sell", strategy.short)

longCondition = low > ema and direction == -1 and smooth_k < 20
if (longCondition) and strategy.position_size == 0
    strategy.entry("buy", strategy.long)

g = (strategy.opentrades.entry_price(0)-x2) * 2
k = (x - strategy.opentrades.entry_price(0)) * 2

if strategy.position_size > 0
    strategy.exit(id="buy exit", from_entry="buy",limit=strategy.opentrades.entry_price(0) + g, stop=x2)

if strategy.position_size < 0
    strategy.exit(id="sell exit", from_entry="sell",limit=strategy.opentrades.entry_price(0) - k, stop=x)

//plot(strategy.opentrades.entry_price(0) - k, color=color.yellow)
//plot(strategy.opentrades.entry_price(0) + g, color=color.red)