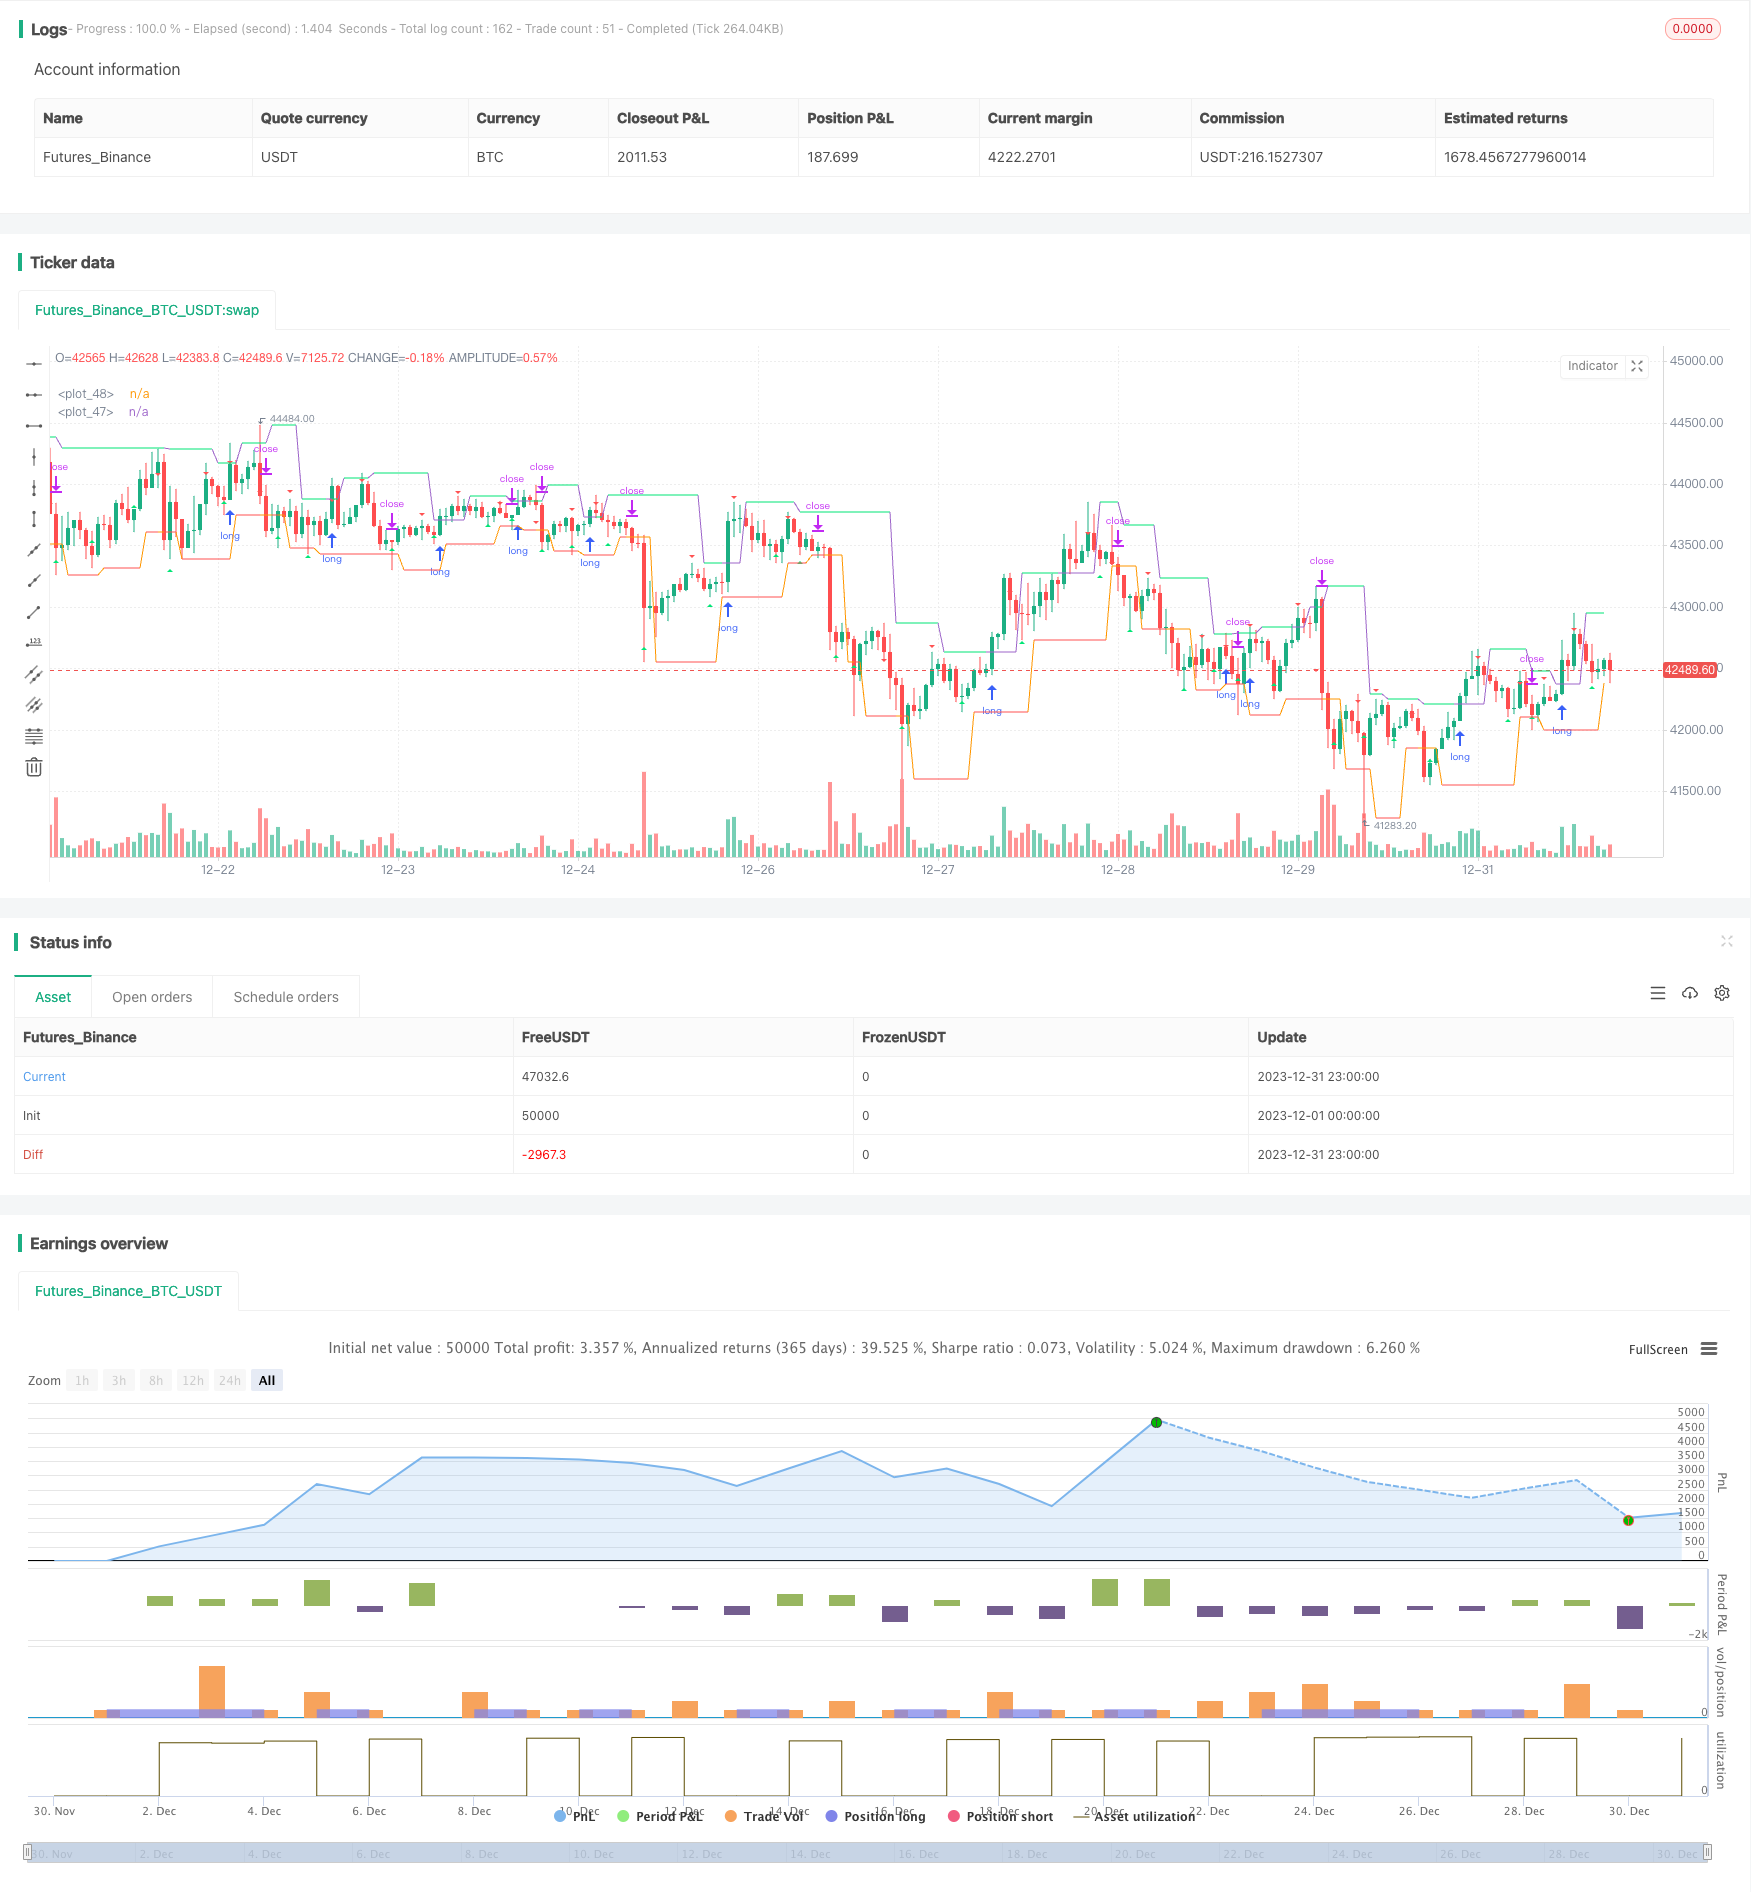
ウィリアムズフラクタルとZZインジケーターを組み合わせた定量取引戦略

概要
これは,ビル・ウィリアムズの分岐理論とZZ指数を使用した量化取引戦略である.この戦略は,ウィリアムズ分岐を計算して市場の傾向を判断し,ZZ指数と組み合わせて,潜在的突破点を発見するために,サポート抵抗線を描画し,トレンド追跡取引を実現する.
戦略原則
この戦略は,最初にウィリアムズ分子を計算して,現在の上昇分子が上昇分数か下降分数かを判断する.上昇分子があれば,現在の上昇傾向にあると考え,下降分子があれば,現在の下降傾向にあると考えます.
そして,分岐点に基づいてZZ指標のサポートラインとレジスタンスラインを描画します. 価格が上昇分岐の対応するレジスタンスラインを突破した場合,多めにします. 価格が下降分岐の対応するサポートラインを突破した場合,空っぽにします.
この組み合わせにより,トレンドが変化した時に,トレンド追跡取引を可能にし,タイムリーに捕捉することができます.
戦略的優位分析
この戦略は,より多くの取引機会を掘り出すために,ウィリアムズ分岐とZZ指数の2つの異なる技術分析方法を使用しています.
市場トレンドの転換を早期に判断し,良いストップ・ストップ条件を設定することで,主要トレンドの方向を把握するのに役立ちます.また,ZZ指数は,部分的な偽突破をフィルターして,不要な損失を防ぐことができます.
総じて,この戦略は,トレンドの判断と,特定の入場点の選択の両方を考慮し,リスクと利益のバランスを取っています.
戦略的リスク分析
この戦略の最大のリスクは,分岐判断とZZ指数が間違った取引信号を発信し,不必要な損失を引き起こす可能性があることです.例えば,抵抗線を破った後,価格はすぐに下がり,継続的に上昇することができません.
さらに,分形計算法は,時間周期の設定が不適切であるため,判断に誤りがあるかもしれない.時間周期が短すぎれば,偽突破の確率が増加する.
これらのリスクを軽減するために,分形の計算パラメータを適切に調整することも,フィルタリング条件を追加することで誤信号を減らすこともできる.さらに,単一損失を制御するために,より大きな止損幅を設定することもできる.
戦略最適化の方向性
この戦略は,以下の方法でさらに最適化できます.
MACDやブリン帯の指標のような動力指標のフィルターを追加することで,部分的な偽突破を防ぐことができる.
分形参数設定を最適化し,高低点の計算方法を調整し,より正確な傾向判断を得るために時間周期を縮小する.
機械学習アルゴリズムのトレンド判断の精度を高め,AIの判断力を活用して人工設定の限界を回避する.
市場変動に応じて調整できる自己適応のストップ・メカニズムを追加する.
ディープ・ラーニング・アルゴリズムを使用して,全体的なパラメータ設定を最適化します.
要約する
この戦略は,ウィリアムズ分岐理論とZZ指標の巧妙な組み合わせにより,市場のトレンドの変化をタイムリーに判断し,捕捉することが可能である.それは高い勝利率を維持し,長期的に安定した超利益を得ることを期待している.次のステップは,より多くのフィルタリング手段とAI判断を導入することによって,戦略の安定性と収益率をさらに向上させることを期待している.
/*backtest
start: 2023-12-01 00:00:00
end: 2023-12-31 23:59:59
period: 1h
basePeriod: 15m
exchanges: [{"eid":"Futures_Binance","currency":"BTC_USDT"}]
*/

//@version=4
strategy(title = "robotrading ZZ-8 fractals", shorttitle = "ZZ-8", overlay = true, default_qty_type = strategy.percent_of_equity, initial_capital = 100, default_qty_value = 100, commission_value = 0.1)

//Settings
needlong  = input(true, defval = true, title = "Long")
needshort = input(false, defval = true, title = "Short")
filterBW = input(false, title="filter Bill Williams Fractals")
showll = input(true, title = "Show levels")
showff = input(true, title = "Show fractals (repaint!)")
showdd = input(true, title = "Show dots (repaint!)")
showbg = input(false, title = "Show background")
showlb = input(false, title = "Show drawdown")
startTime = input(defval = timestamp("01 Jan 2000 00:00 +0000"), title = "Start Time", type = input.time, inline = "time1")
finalTime = input(defval = timestamp("31 Dec 2099 23:59 +0000"), title = "Final Time", type = input.time, inline = "time1")

//Variables
loss = 0.0
maxloss = 0.0
equity = 0.0
truetime = true

//Fractals
isRegularFractal(mode) =>
    ret = mode == 1 ? high[4] < high[3] and high[3] < high[2] and high[2] > high[1] and high[1] > high[0] : mode == -1 ? low[4] > low[3] and low[3] > low[2] and low[2] < low[1] and low[1] < low[0] : false
isBWFractal(mode) =>
    ret = mode == 1 ? high[4] < high[2] and high[3] <= high[2] and high[2] >= high[1] and high[2] > high[0] : mode == -1 ? low[4] > low[2] and low[3] >= low[2] and low[2] <= low[1] and low[2] < low[0] : false
filteredtopf = filterBW ? isRegularFractal(1) : isBWFractal(1)
filteredbotf = filterBW ? isRegularFractal(-1) : isBWFractal(-1)

//Triangles
plotshape(filteredtopf and showff, title='Filtered Top Fractals', style=shape.triangledown, location=location.abovebar, color= color.red, offset=-2)
plotshape(filteredbotf and showff, title='Filtered Bottom Fractals', style=shape.triangleup, location=location.belowbar, color= color.lime, offset=-2)

//Levels
hh = 0.0
ll = 0.0
hh := filteredtopf ? high[2] : hh[1]
ll := filteredbotf ? low[2] : ll[1]

//Trend
trend = 0
trend := high >= hh[1] ? 1 : low <= ll[1] ? -1 : trend[1]

//Lines
hcol = showll and hh == hh[1] and close < hh ? color.lime : na
lcol = showll and ll == ll[1] and close > ll ? color.red : na
plot(hh, color = hcol)
plot(ll, color = lcol)

//Dots
// var line hline = na
// if hh != hh[1] and showdd
//     hline := line.new(bar_index - 0, hh[0], bar_index - 2, hh[0], xloc = xloc.bar_index, extend = extend.none, style = line.style_dotted, color = color.lime, width = 1)
// var line lline = na
// if ll != ll[1] and showdd
//     lline := line.new(bar_index - 0, ll[0] - syminfo.mintick, bar_index - 2, ll[0] - syminfo.mintick, xloc = xloc.bar_index, extend = extend.none, style = line.style_dotted, color = color.red, width = 1)

//Background
bgcol = showbg == false ? na : trend == 1 ? color.lime : trend == -1 ? color.red : na
bgcolor(bgcol, transp = 80)

//Orders
if hh > 0 and needlong
    strategy.entry("Long", strategy.long, na, stop = hh, when = needlong and truetime)
    strategy.exit("Exit Long", "Long", stop = ll, when = needshort == false)
if ll > 0 and startTime
    strategy.entry("Short", strategy.short, na, stop = ll, when = needshort and truetime)
    strategy.exit("Exit Short", "Short", stop = hh, when = needlong == false)
if time > finalTime
    strategy.close_all()
    strategy.cancel("Long")
    strategy.cancel("Short")

if showlb

    //Drawdown
    max = 0.0
    max := max(strategy.equity, nz(max[1]))
    dd = (strategy.equity / max - 1) * 100
    min = 100.0
    min := min(dd, nz(min[1]))

    //Max loss size
    equity := strategy.position_size != strategy.position_size[1] ? strategy.equity : equity[1]
    loss := equity < equity[1] ? ((equity / equity[1]) - 1) * 100 : 0
    maxloss := min(nz(maxloss[1]), loss)

    //Label
    min := round(min * 100) / 100
    maxloss := round(maxloss * 100) / 100
    labeltext = "Drawdown: " + tostring(min) + "%" + "\nMax.loss " + tostring(maxloss) + "%"
    var label la = na
    label.delete(la)
    tc = min > -100 ? color.white : color.red
    osx = timenow + round(change(time)*50)
    osy = highest(100)
    la := label.new(x = osx, y = osy, text = labeltext, xloc = xloc.bar_time, yloc = yloc.price, color = color.black, style = label.style_labelup, textcolor = tc)