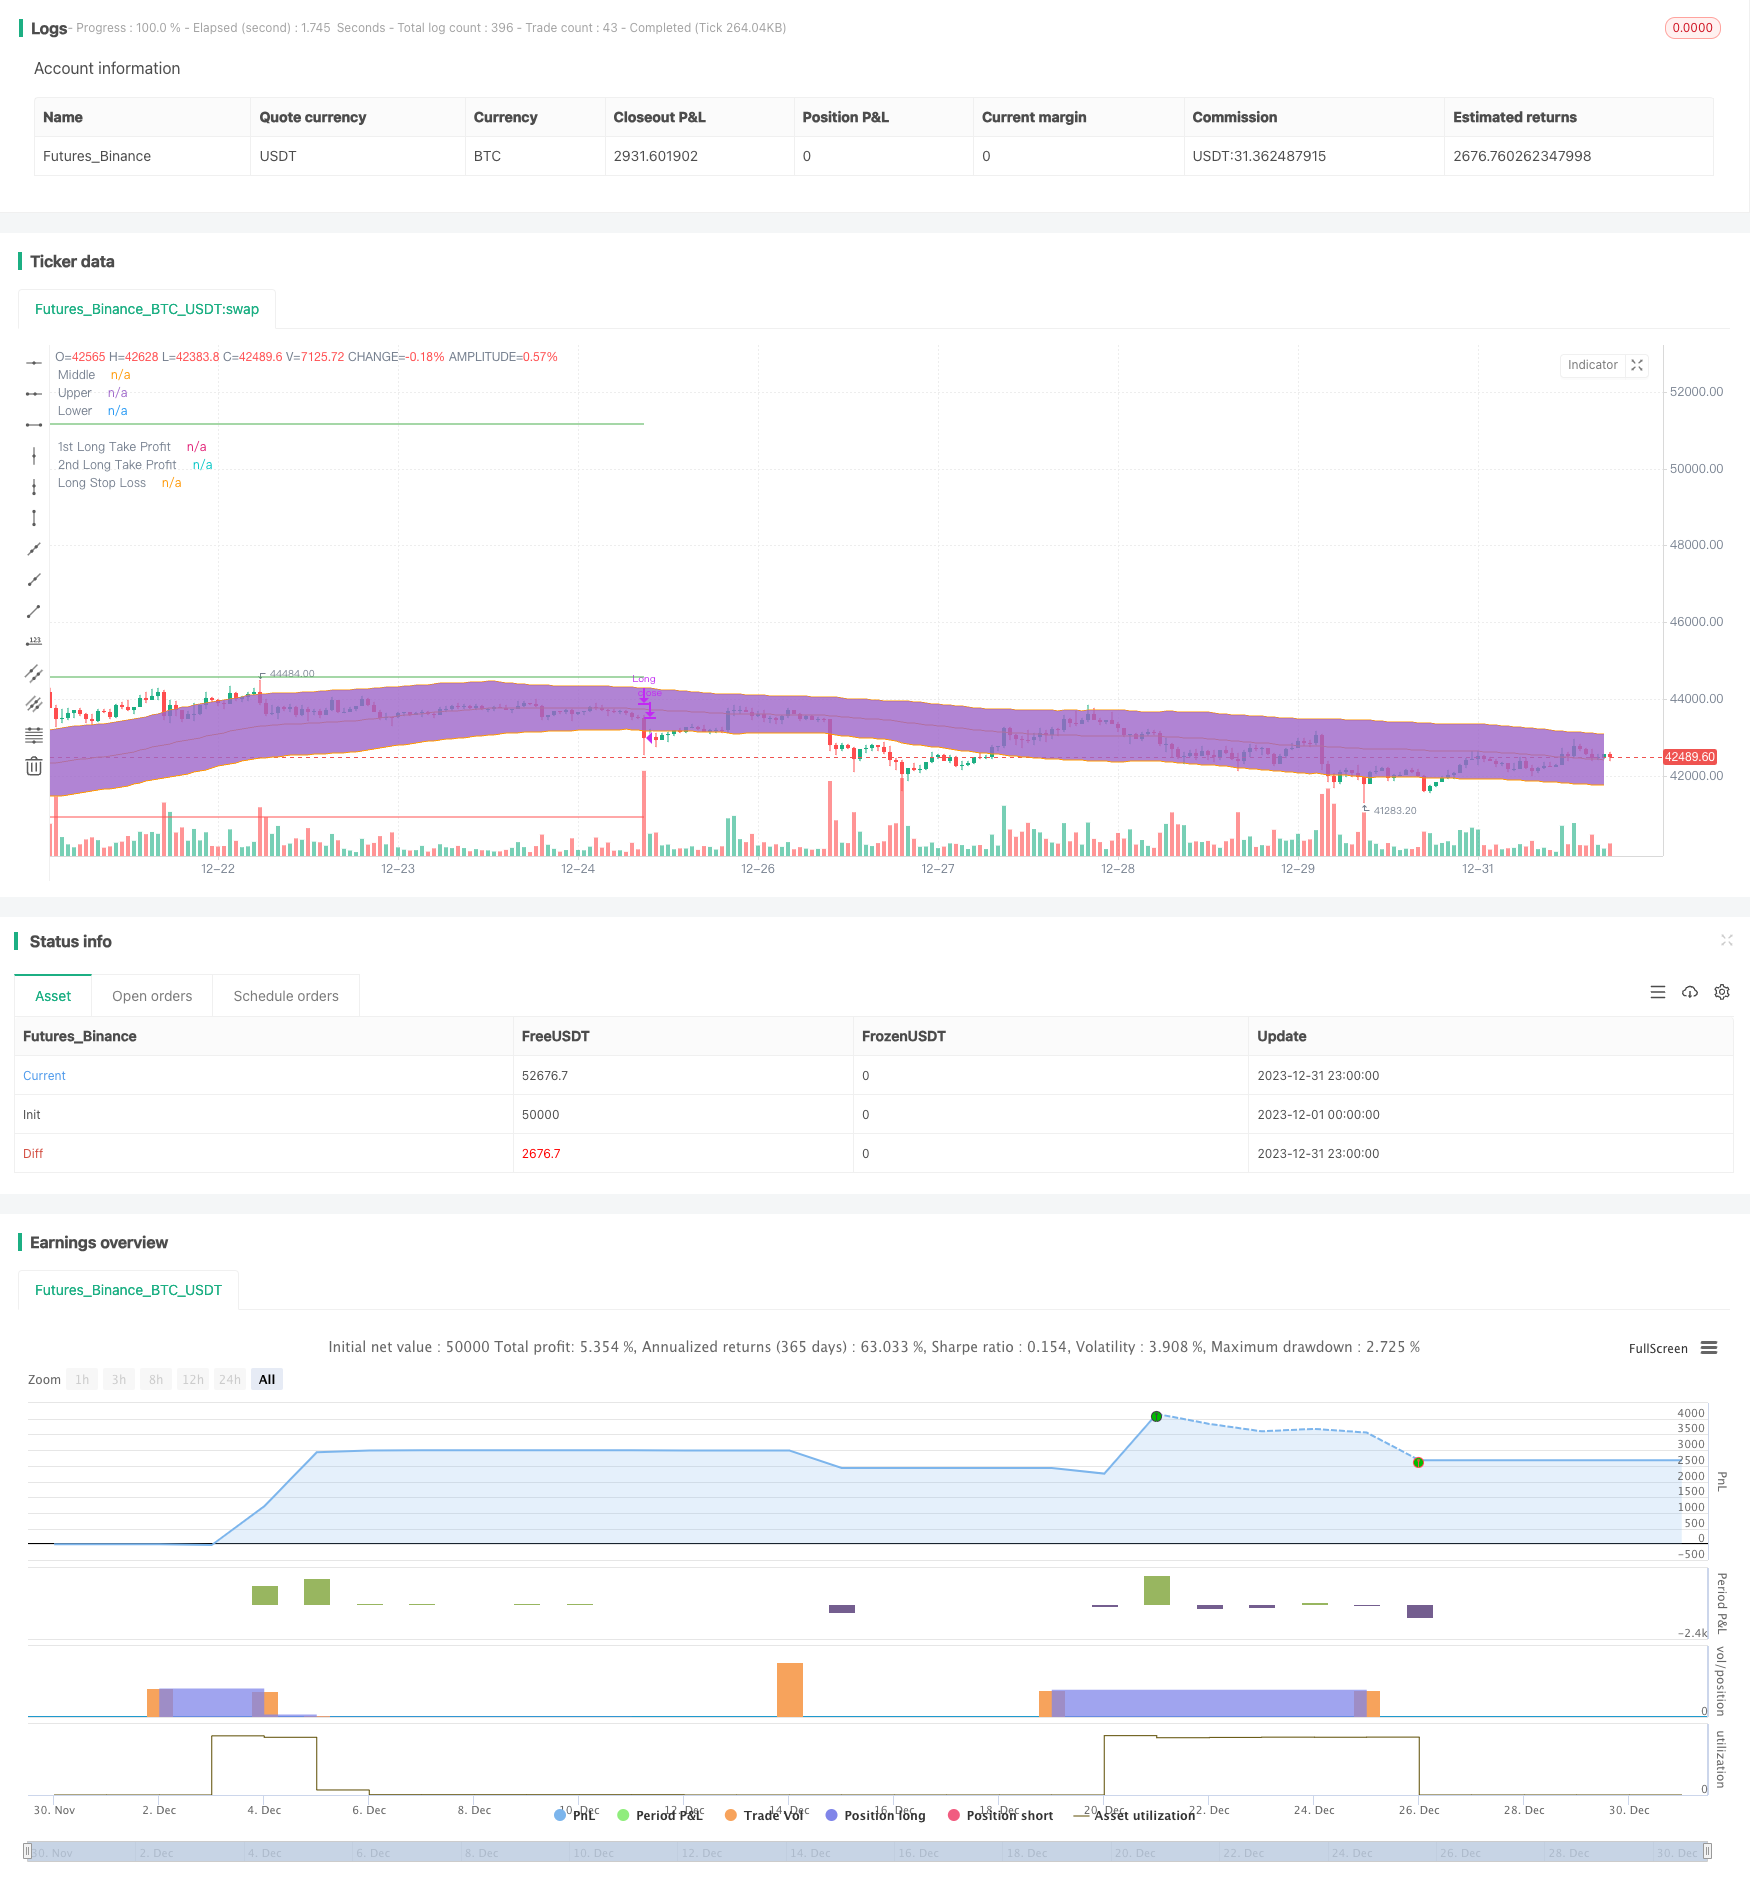
二国間突破K線変動チャネル戦略

概要
双面突破K線波動チャネル戦略は,チャネルの中間軌道,上線,下線を計算し,トレンド指標と量値指標と組み合わせて,市場の方向と強さを判断し,チャネルの両側で同時に突破信号を設定し,低買い高売りを実現する主な目的である.
戦略原則
この戦略の核心指標は,統計学に基づくK線波動チャネルである.チャネルの中線は平均線アルゴリズムを採用し,上下線は平均実波幅の計算方法を採用し,価格変動の境界を動的に捉える.同時に,戦略はDMIと取引量の判断ルールを加え,偽の突破を避けるために損失をもたらす.
具体的には,価格が下線からチャネルに突破すると,DMIの+DI線が-DI線と設定されたADX基准線を上回り,取引量が拡大すると買入シグナルが生じます.反対に,価格が上線から下線に突破すると,判断規則は上述とは逆で,売り出しシグナルが生じます.
優位分析
この戦略の最大の利点は,価格の主要な突破方向を捕捉することであり,双方向の突破判断を適用することで,調節と振動の状況を効果的に回避し,ストップを減らすことができます.Kチャネル突破判断は,単純な移動平均戦略と比較して,価格の変動に適応性があります.
さらに,補助指標であるDMIと取引量の導入は,偽信号を避けるために良いフィルタリング作用もします.
リスク分析
双方向突破策の最大のリスクは,市場の逆転を判断できないことであり,市場がV型逆転した場合,ストロップ・ロスは容易にトリガーされる可能性がある.また,パラメータの設定が不適切であることも取引システムに負の影響を及ぼします.
リスクに対して,指標パラメータをさらに最適化して,ストップロスを縮小することでリスクを軽減することができます. もちろん,取引システムは決して完全に損失を回避することはできません. リスクを管理することが重要です.
最適化の方向
この戦略は,以下のような分野において改善の余地があり,最適化の可能性も大きい.
DMIのDIとADXの長さ,K線通路の周期と倍数設定などの最適化パラメータを微調整する
MACDなどの他の指標と組み合わせたフィルタリング条件を追加し,偽突破を避ける
ストップ・ストップ・損失の自動追跡を実現し,リスクをさらに制御する
異なる品種のパラメータ設定とフィルタリングルールに最適化
要約する
双方向突破K線波動チャネル戦略は,全体として有効な突破システムである.それは,主要なトレンドの方向と強さを効果的に判断することができ,最適化とリスク管理の観点からも大きな潜在性がある.この戦略は,体系的に改善と最適化が行われれば,長期にわたって安定した利益をもたらすことができる.
/*backtest
start: 2023-12-01 00:00:00
end: 2023-12-31 23:59:59
period: 1h
basePeriod: 15m
exchanges: [{"eid":"Futures_Binance","currency":"BTC_USDT"}]
*/

//Original Idea by: Wunderbit Trading

//@version=5
strategy('Keltner Channel ETH/USDT 1H', overlay=true, initial_capital=1000, pyramiding=0, currency='USD', default_qty_type=strategy.percent_of_equity, default_qty_value=100, commission_type=strategy.commission.percent, commission_value=0.07)


/// TREND
ribbon_period = input.int(46, 'Period', step=1)

leadLine1 = ta.ema(close, ribbon_period)
leadLine2 = ta.sma(close, ribbon_period)

// p3 = plot(leadLine1, color= #53b987, title="EMA", transp = 50, linewidth = 1)
// p4 = plot(leadLine2, color= #eb4d5c, title="SMA", transp = 50, linewidth = 1)
// fill(p3, p4, transp = 60, color = leadLine1 > leadLine2 ? #53b987 : #eb4d5c)

//Upward Trend
UT = leadLine2 < leadLine1
DT = leadLine2 > leadLine1

///////////////////////////////////////INDICATORS

// KELTNER //
source = close
useTrueRange = input(true)
length = input.int(81, step=1, minval=1)
mult = input.float(2.5, step=0.1)

// Calculate Keltner Channel
ma = ta.sma(source, length)
range_1 = useTrueRange ? ta.tr : high - low
rangema = ta.sma(range_1, length)
upper = ma + rangema * mult
lower = ma - rangema * mult

plot(ma, title='Middle', color=color.new(color.orange, 0))
p1 = plot(upper, title='Upper', color=color.new(color.orange, 0))
p2 = plot(lower, title='Lower', color=color.new(color.orange, 0))
fill(p1, p2, transp=90)


// DMI INDICATOR //
adxlen = 10  // input(10, title="ADX Smoothing")
dilen = input(19, title='DI Length')
keyLevel = 23  // input(23, title="key level for ADX")
dirmov(len) =>
    up = ta.change(high)
    down = -ta.change(low)
    truerange = ta.rma(ta.tr, len)
    plus = fixnan(100 * ta.rma(up > down and up > 0 ? up : 0, len) / truerange)
    minus = fixnan(100 * ta.rma(down > up and down > 0 ? down : 0, len) / truerange)
    [plus, minus]

adx(dilen, adxlen) =>
    [plus, minus] = dirmov(dilen)
    sum = plus + minus
    adx = 100 * ta.rma(math.abs(plus - minus) / (sum == 0 ? 1 : sum), adxlen)
    [adx, plus, minus]

[sig, up, down] = adx(dilen, adxlen)

benchmark = input.int(title='DMI Benchmark', defval=27, minval=1, step=1)

// plot(sig, color=color.red, title="ADX")
// plot(up, style=plot.style_histogram, color=color.green, title="+DI")
// plot(down, style=plot.style_histogram, color=color.red, title="-DI")
// plot(keyLevel, color=color.white, title="Key Level")

///////////////////////////////////////////////////////////


////////////////////////////////////////////////////Component Code Start

testStartYear = input(2019, 'Backtest Start Year')
testStartMonth = input(1, 'Backtest Start Month')
testStartDay = input(1, 'Backtest Start Day')
testPeriodStart = timestamp(testStartYear, testStartMonth, testStartDay, 0, 0)

testStopYear = input(9999, 'Backtest Stop Year')
testStopMonth = input(12, 'Backtest Stop Month')
testStopDay = input(31, 'Backtest Stop Day')
testPeriodStop = timestamp(testStopYear, testStopMonth, testStopDay, 0, 0)

testPeriod() => true
///// Component Code Stop //////////////////////////////////////////

//////////////// STRATEGY EXECUTION //////////////////////////

//LONG SET UP
// Take Profit / Stop Loss
long_tp1_inp = input.float(4.5, title='Long Take Profit 1 %', step=0.1) / 100
long_tp1_qty = input.int(15, title='Long Take Profit 1 Qty', step=1)

long_tp2_inp = input.float(20, title='Long Take Profit 2%', step=0.1) / 100
long_tp2_qty = input.int(100, title='Long Take Profit 2 Qty', step=1)

long_take_level_1 = strategy.position_avg_price * (1 + long_tp1_inp)
long_take_level_2 = strategy.position_avg_price * (1 + long_tp2_inp)

long_sl_inp = input.float(4, title='Long Stop Loss %', step=0.1) / 100
long_stop_level = strategy.position_avg_price * (1 - long_sl_inp)


// STRATEGY CONDITION
// LONG
entry_long = open > lower and open < upper and close > upper and up > down and up > benchmark  //  and volume[0] > volume[1]
entry_price_long = ta.valuewhen(entry_long, close, 0)
SL_long = entry_price_long * (1 - long_sl_inp)
exit_long = close < lower or low < SL_long


// STRATEGY EXECUTION
if testPeriod()

    // LONG
    if UT
        strategy.entry(id='Long', direction=strategy.long, when=entry_long, comment='INSERT ENTER LONG COMMAND')
    strategy.exit('TP1', 'Long', qty_percent=long_tp1_qty, limit=long_take_level_1)  // PLACE TAKE PROFIT IN WBT BOT SETTINGS
    strategy.exit('TP2', 'Long', qty_percent=long_tp2_qty, limit=long_take_level_2)  // PLACE TAKE PROFIT IN WBT BOT SETTINGS
    strategy.close(id='Long', when=exit_long, comment='INSERT EXIT LONG COMMAND')


//PLOT FIXED SLTP LINE
// LONG POSITION
plot(strategy.position_size > 0 ? long_take_level_1 : na, style=plot.style_linebr, color=color.new(color.green, 0), linewidth=1, title='1st Long Take Profit')
plot(strategy.position_size > 0 ? long_take_level_2 : na, style=plot.style_linebr, color=color.new(color.green, 0), linewidth=1, title='2nd Long Take Profit')
plot(strategy.position_size > 0 ? long_stop_level : na, style=plot.style_linebr, color=color.new(color.red, 0), linewidth=1, title='Long Stop Loss')