単一移動平均横ばい突破戦略
作成日:
2024-02-02 11:19:19
最終変更日:
2024-02-02 11:19:19
コピー:
0
クリック数:
550
1
フォロー
1628
フォロワー

概要
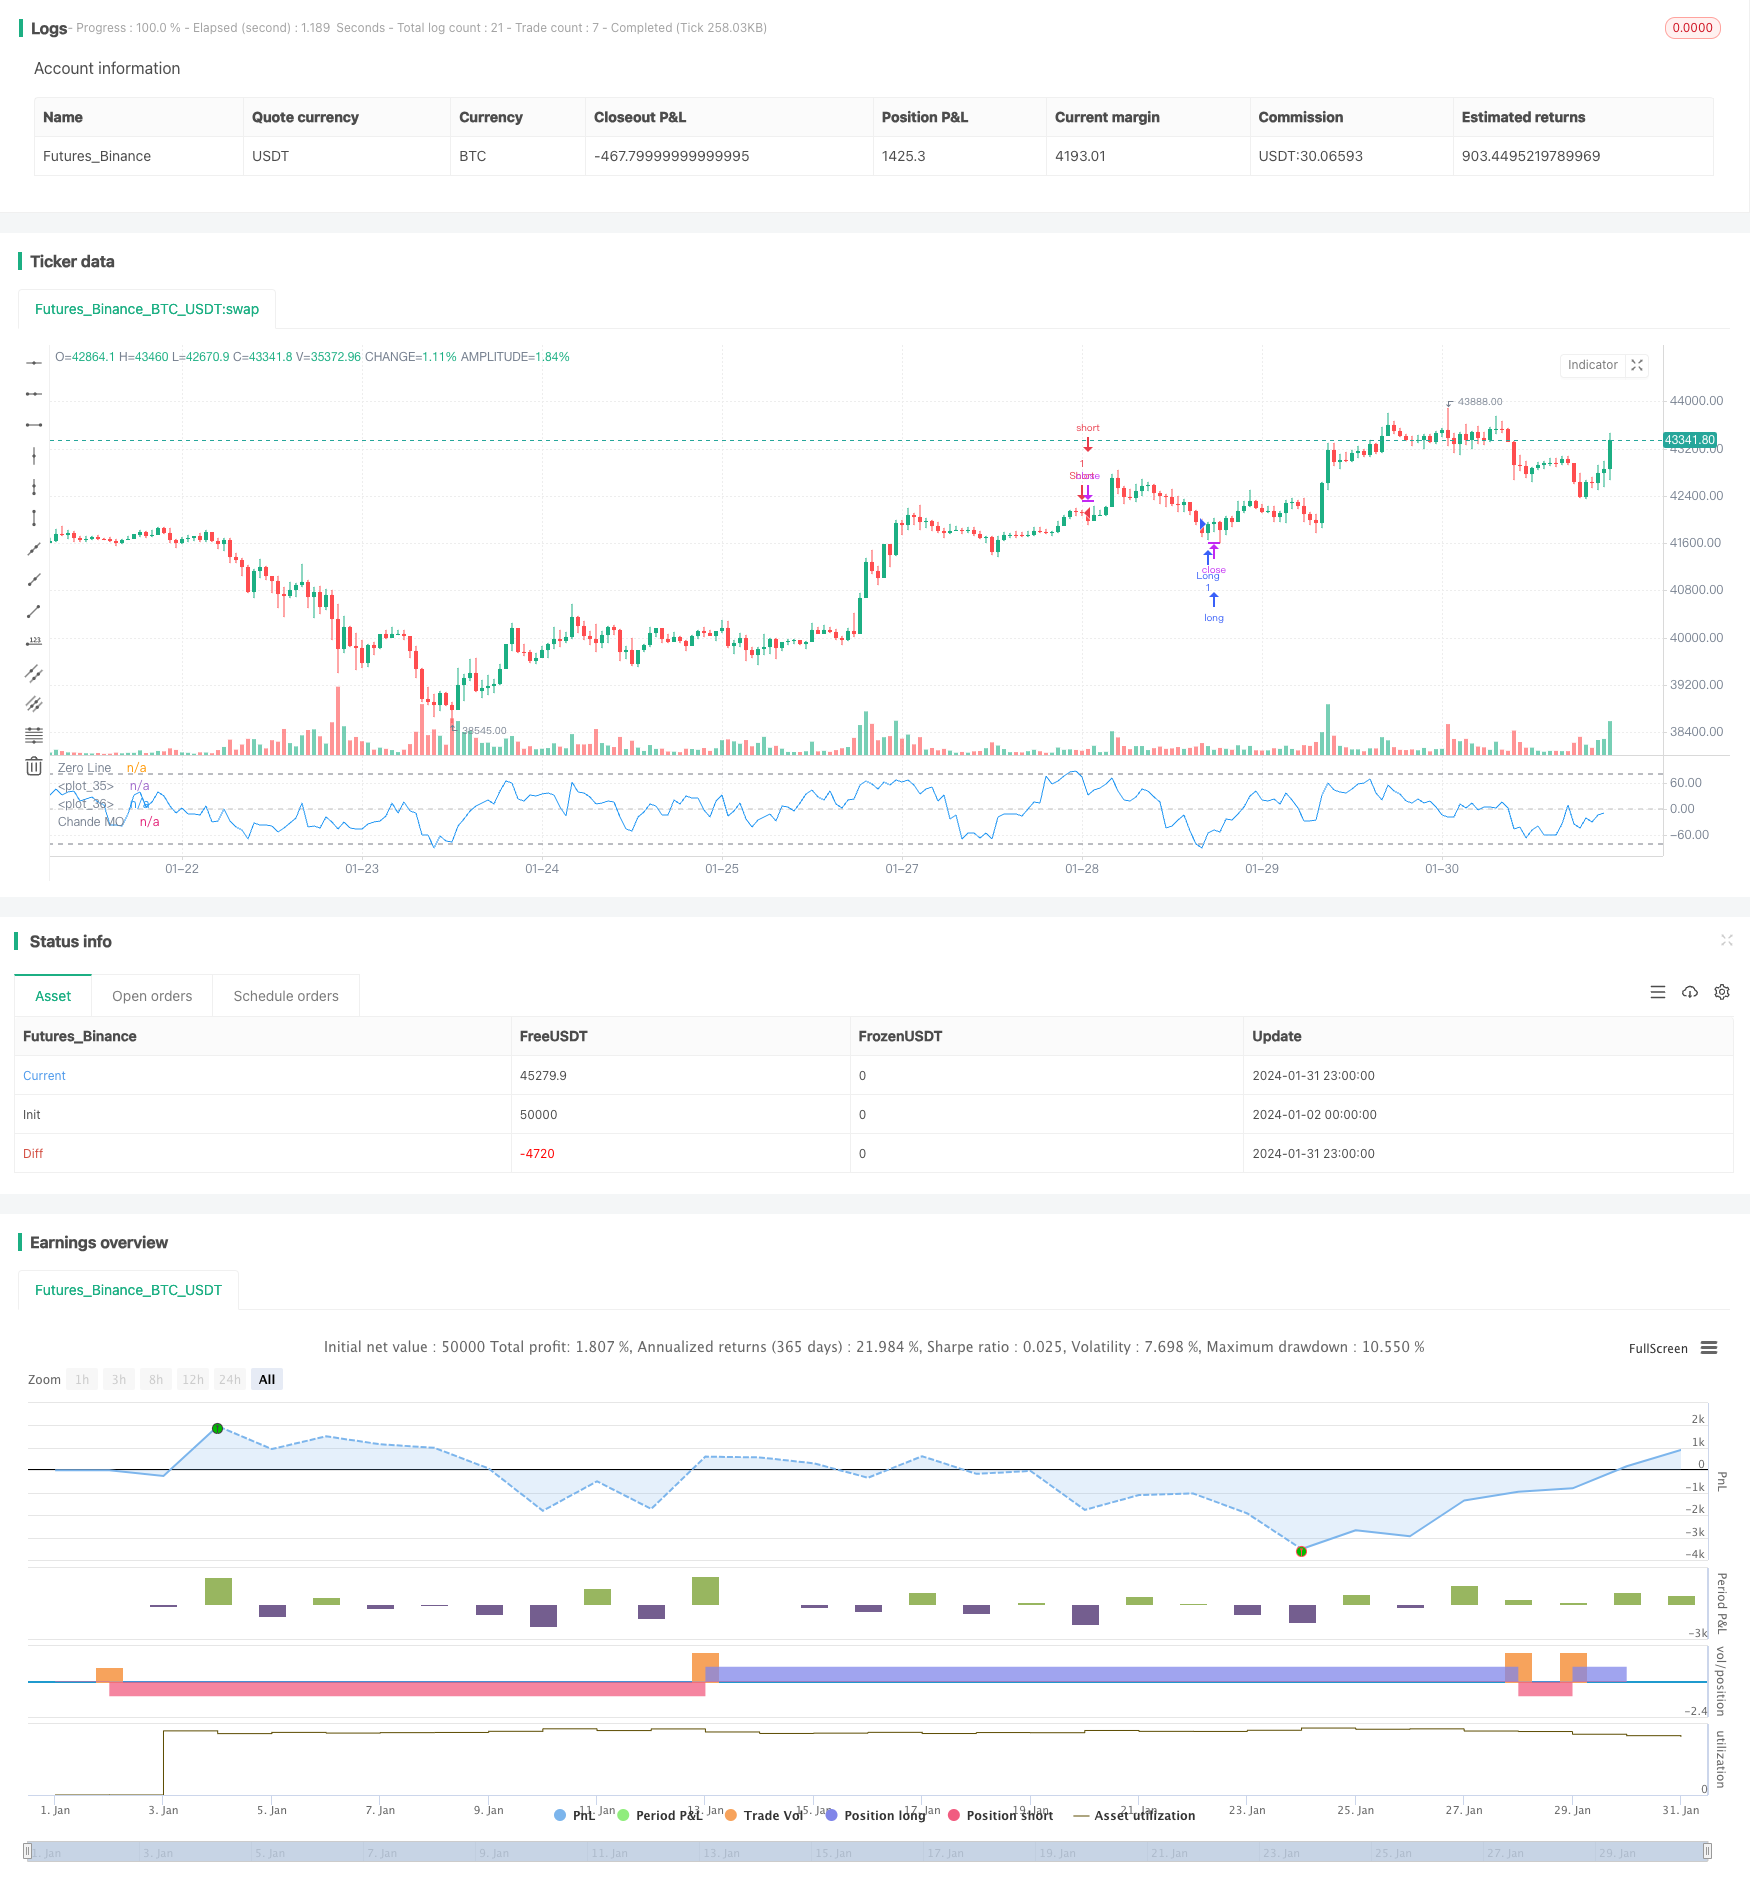
単一均点横断突破戦略は,Chandeの動向指標に基づく量化取引戦略である.この戦略は,価格の動向の変化を計算して,市場が横断整理段階にあるかどうかを判断する.Chandeの動向指標ラインが設定された買入線または出売線を突破すると,対応する買入または出売操作を行う.
戦略原則
この戦略は,価格の動態の変化を計算します.momm負の運動量に分けます.m1負の運動量m2そして,周期内における正負の動力の合計を計算します.sm1そしてsm2そして最後にChandeの動力指数chandeMOこの指標は0を中心軸として,指標が0より大きいときは上昇力が下降力より大きいことを示し,0より小さい時は逆である.
チャンデ動量指数が低値から買入線を突破すると,価格が下落期から脱落し,収束準備の上昇段階に入ることを示す.このとき,戦略は買入操作を行う.指数が高値から下落して出売ラインを破ると,出売操作を行う.
優位分析
- この戦略は,価格が下落から上昇まで,上昇から上昇までの転換点を捉え,低価格で買い,高価格で売ることを可能にします.
- チャンデ動態指数は,価格の変化の速度と強さを考慮し,トレンド判断の良いツールです.
- 戦略操作はシンプルで実行しやすい.
リスク分析
- チャンデ動量指数はパラメータに敏感であり,異なる周期パラメータ設定により取引信号と結果の大きな差が生じます.
- 買入ラインと売り出しラインの静的な設定も,誤信号の過剰な発生を引き起こす可能性があります.
- ストップ・ロスを考慮していない戦略は,損失の拡大につながる可能性があります.
ダイナミックな買入線と売り出し線を設定したり,他の指標のフィルター信号と組み合わせたりできます.同時に,リスクを制御するためにストップ・ロスを設定する必要があります.
最適化の方向
- 異なる周期のパラメータを試して最適化
- ダイナミックな買出ラインを設定する
- 他の指標と組み合わせた信号のフィルタリング
- ストップダメージロジック制御のリスク
要約する
シングル・メソッド・ポイント横幅突破策は,Chande動力指数によって価格が下落から整合,そして上昇の転換点を判断し,低買い高売りを実現する.この策はシンプルで実用的で,トレンドの転換を効果的に捉える.しかし,パラメータの設定とストップ・ローズ・コントロールなどの側面は,誤信号と制御のリスクを減らすためにさらに最適化する必要がある.全体的に,この策は,取引を量化するためにトレンドの転換を効果的に判断するツールを提供します.
ストラテジーソースコード
/*backtest
start: 2024-01-02 00:00:00
end: 2024-02-01 00:00:00
period: 1h
basePeriod: 15m
exchanges: [{"eid":"Futures_Binance","currency":"BTC_USDT"}]
*/

//@version=4

//* Backtesting Period Selector | Component *//
//* https://www.tradingview.com/script/eCC1cvxQ-Backtesting-Period-Selector-Component *//
//* https://www.tradingview.com/u/pbergden/ *//
//* Modifications made *//
testStartYear = input(2021, "Backtest Start Year")
testStartMonth = input(1, "Backtest Start Month")
testStartDay = input(10, "Backtest Start Day")
testPeriodStart = timestamp(testStartYear,testStartMonth,testStartDay,0,0)

testStopYear = input(999999, "Backtest Stop Year")
testStopMonth = input(9, "Backtest Stop Month")
testStopDay = input(26, "Backtest Stop Day")
testPeriodStop = timestamp(testStopYear,testStopMonth,testStopDay,0,0)

testPeriod() => true
/////////////// END - Backtesting Period Selector | Component ///////////////
strategy(title="Chande Momentum Strat", shorttitle="ChandeMO Strat", format=format.price, precision=2)
length = input(9, minval=1)
src = input(close, "Price", type = input.source)
momm = change(src)
f1(m) => m >= 0.0 ? m : 0.0
f2(m) => m >= 0.0 ? 0.0 : -m
m1 = f1(momm)
m2 = f2(momm)
sm1 = sum(m1, length)
sm2 = sum(m2, length)
percent(nom, div) => 100 * nom / div
chandeMO = percent(sm1-sm2, sm1+sm2)
plot(chandeMO, "Chande MO", color=color.blue)
hline(0, color=#C0C0C0, linestyle=hline.style_dashed, title="Zero Line")
buyline= input(-80)
sellline= input(80)
hline(buyline, color=color.gray)
hline(sellline, color=color.gray)

if testPeriod()
    if crossover(chandeMO, buyline)
        strategy.entry("Long", strategy.long, alert_message="a=ABCD b=buy e=binanceus q=1.2 s=uniusd")
    //    strategy.exit(id="Long Stop Loss", stop=strategy.position_avg_price*0.8) //20% stop loss

    if crossunder(chandeMO, sellline)
        strategy.entry("Short", strategy.short, alert_message="a=ABCD b=sell e=binanceus q=1.2 s=uniusd")
    //    strategy.exit(id="Short Stop Loss", stop=strategy.position_avg_price*1.2) //20% stop loss

//      remember to alert as    {{strategy.order.alert_message}}