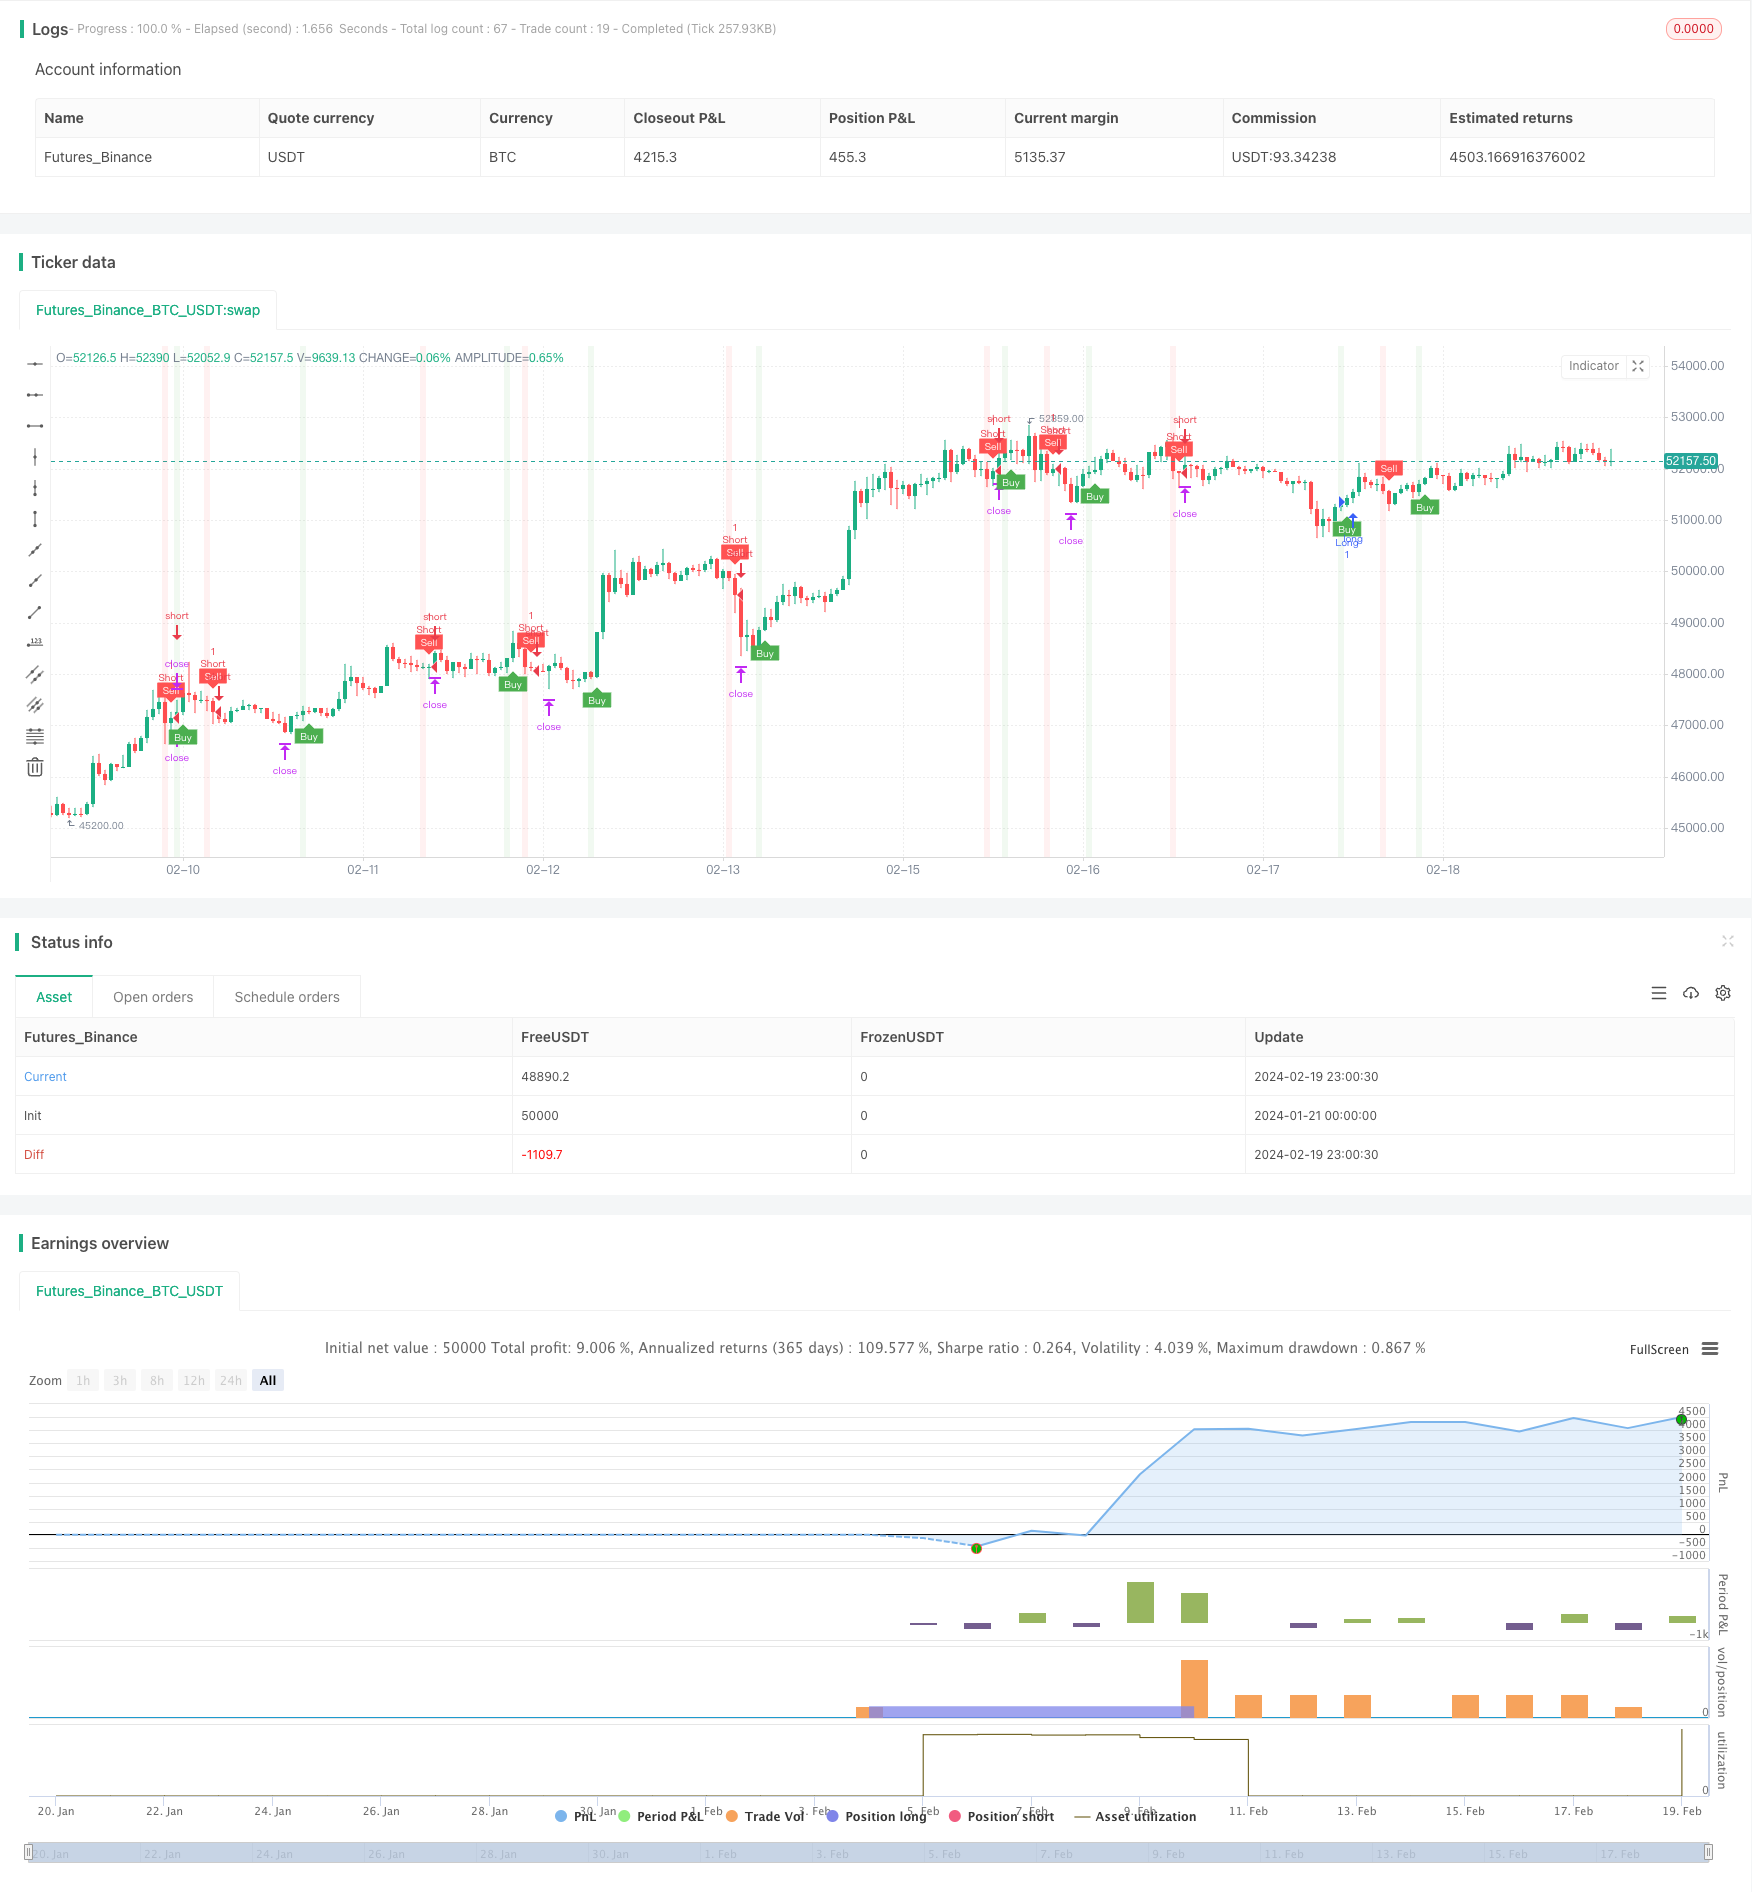
適応型移動ストップ移動平均取引戦略

概要
この戦略の核心思想は,T3平均線とATR自動停止に適応してトレンドの入出口点を捕捉することであり,トレンド追跡型の戦略である.価格がT3平均線を破るときに取引信号を生成し,突破点でATR値を設定してストップ・ロスとストップ・ポジションを設定し,自動ストップ・ロスを実現する.
戦略原則
この戦略は主にT3平均線指標,ATR指標,ATR移動止損メカニズムで構成されている.
T3平均線は,平滑性のある移動平均線であり,曲線の遅滞を軽減し,価格変化により迅速に反応させる.価格が平均線の下方向から突破すると,買入シグナルを生じ,価格が平均線上方向から突破すると,売りシグナルを生じます.
ATR指標は,市場の変動の程度を計算し,ストップ・ロスを設定するために使用される.ATR値が大きいほど,市場の変動が大きいので,より広いストップ・ロスを設定する必要があります.ATR値が小さいほど,市場の変動が小さいので,より狭いストップ・ロスを設定できます.
ATR移動のストップメカニズムは,ATR値に基づいてストップラインの位置をリアルタイムで調整することで,ストップラインが価格と合致して合理的な範囲で動作できるようにする.このようにして,ストップ距離があまりにも近いことを防ぎ,ストップ距離があまりにも広いことを防ぎ,リスクを効果的に制御できないことを防ぎます.
T3指数判断方向,ATR指数計算波動,ATR移動ストップメカニズムを総合的に利用する戦略は,より効率的なトレンドキャプチャとリスク管理を実現する.
利点
この戦略の利点は以下の通りです.
T3平均線を使用すると,トレンドの捉え方がより正確になります.
ATR指数は市場波動率を動的に計算し,ストップ・ロースとストップ・ポジションを合理的に計算する.
ATRのモバイル・ストップ・メカニズムにより,ストップ・ラインがリアルタイムで価格を追跡し,リスクを効果的にコントロールできます.
指数判断とストップ・ローズ・メカニズムを統合し,トレンド追跡取引を自動化します.
Webhookで外部取引プラットフォームに接続し,自動注文が可能である.
リスクと解決策
この戦略にはいくつかのリスクがあります.
T3平均線パラメータの設定が不適切で,よりよいトレンドの機会を逃す可能性があります.異なる周期のパラメータをテストして,最適なパラメータを見つけることができます.
ATR値の計算が不正確で,止損距離が大きすぎたり小さすぎたりして,リスクを効果的にコントロールできない。市場変動率の特徴と組み合わせてATR周期パラメータを調整することができる。
激しい変動の際には,ストップラインが突破され,過度の損失を引き起こす可能性があります.合理的な総損失ラインを設定して,単一の損失が過大にならないようにすることができます.
双方向の反復行情では,止損が頻繁にトリガーされる場合がある.ATRの移動止損の距離を適切に緩めることができる.
最適化の方向
この戦略は以下の点で最適化できます.
T3平均線パラメータを最適化して,最も適切な平滑周期を見つける.
異なるATR周期パラメータをテストし,市場変動を最も反映できるATR値を計算する.
ATRの移動止損距離の弾性範囲を最適化して,止損が過度に敏感にならないようにする.
適切なフィルタリング条件を加え,両方向の振動市場の頻繁な取引を避ける.
トレンド判断指数と組み合わせて,利益方向の判断の精度を高めます.
機械学習によるパラメータの自動最適化.
要約する
この戦略は,T3均線を活用してトレンドの方向性を判断し,ATR指標を計算し,ストップ・ストップとATRモバイル・ストップ・メカニズムでストップ・距離を調整し,トレンドの自動追跡と高効率のリスク制御を実現する,信頼できるトレンド・トラッキング戦略である.実用的な応用では,継続的にテスト・最適化され,現在の市場環境に最も適したパラメータの組み合わせを見つけ,その結果,優れた戦略効果を得る必要がある.
/*backtest
start: 2024-01-21 00:00:00
end: 2024-02-20 00:00:00
period: 1h
basePeriod: 15m
exchanges: [{"eid":"Futures_Binance","currency":"BTC_USDT"}]
*/

//@version=5
strategy(title='UT Bot Alerts (QuantNomad) Strategy', overlay=true)
T3 = input(100)//600
// Input for Long Settings
// Input for Long Settings


xPrice3 = close
xe1 = ta.ema(xPrice3, T3)
xe2 = ta.ema(xe1, T3)
xe3 = ta.ema(xe2, T3)
xe4 = ta.ema(xe3, T3)
xe5 = ta.ema(xe4, T3)
xe6 = ta.ema(xe5, T3)

b3 = 0.7
c1 = -b3*b3*b3
c2 = 3*b3*b3+3*b3*b3*b3
c3 = -6*b3*b3-3*b3-3*b3*b3*b3
c4 = 1+3*b3+b3*b3*b3+3*b3*b3
nT3Average = c1 * xe6 + c2 * xe5 + c3 * xe4 + c4 * xe3

//plot(nT3Average, color=color.white, title="T3")

// Buy Signal - Price is below T3 Average
buySignal3 = xPrice3 < nT3Average
sellSignal3 = xPrice3 > nT3Average
// Inputs
a = input(1, title='Key Value. "This changes the sensitivity"')
c = input(50, title='ATR Period')
h = input(true, title='Signals from Heikin Ashi Candles')
riskRewardRatio = input(1, title='Risk Reward Ratio')

xATR = ta.atr(c)
nLoss = a * xATR

src = h ? request.security(ticker.heikinashi(syminfo.tickerid), timeframe.period, close, lookahead=barmerge.lookahead_off) : close

xATRTrailingStop = 0.0
iff_1 = src > nz(xATRTrailingStop[1], 0) ? src - nLoss : src + nLoss
iff_2 = src < nz(xATRTrailingStop[1], 0) and src[1] < nz(xATRTrailingStop[1], 0) ? math.min(nz(xATRTrailingStop[1]), src + nLoss) : iff_1
xATRTrailingStop := src > nz(xATRTrailingStop[1], 0) and src[1] > nz(xATRTrailingStop[1], 0) ? math.max(nz(xATRTrailingStop[1]), src - nLoss) : iff_2

pos = 0
iff_3 = src[1] > nz(xATRTrailingStop[1], 0) and src < nz(xATRTrailingStop[1], 0) ? -1 : nz(pos[1], 0)
pos := src[1] < nz(xATRTrailingStop[1], 0) and src > nz(xATRTrailingStop[1], 0) ? 1 : iff_3

xcolor = pos == -1 ? color.red : pos == 1 ? color.green : color.blue

ema = ta.ema(src, 1)
above = ta.crossover(ema, xATRTrailingStop)
below = ta.crossunder(ema, xATRTrailingStop)

buy = src > xATRTrailingStop and above
sell = src < xATRTrailingStop and below

barbuy = src > xATRTrailingStop
barsell = src < xATRTrailingStop

plotshape(buy, title='Buy', text='Buy', style=shape.labelup, location=location.belowbar, color=color.new(color.green, 0), textcolor=color.new(color.white, 0), size=size.tiny)
plotshape(sell, title='Sell', text='Sell', style=shape.labeldown, location=location.abovebar, color=color.new(color.red, 0), textcolor=color.new(color.white, 0), size=size.tiny)

barcolor(barbuy ? color.new(color.green, 90) : na)
barcolor(barsell ? color.new(color.red, 90) : na)

var float entryPrice = na
var float takeProfitLong = na
var float stopLossLong = na
var float takeProfitShort = na
var float stopLossShort = na

if buy and buySignal3
    entryPrice := src
    takeProfitLong := entryPrice + nLoss * riskRewardRatio
    stopLossLong := entryPrice - nLoss
    takeProfitShort := na
    stopLossShort := na

if sell and sellSignal3
    entryPrice := src
    takeProfitShort := entryPrice - nLoss * riskRewardRatio
    stopLossShort := entryPrice + nLoss
    takeProfitLong := na
    stopLossLong := na

// Strategy order conditions
acct = "Sim101"
ticker = "ES 12-23"
qty = 1

OCOMarketLong = '{ "alert": "OCO Market Long", "account": "' + str.tostring(acct) + '", "ticker": "' + str.tostring(ticker) + '", "qty": "' + str.tostring(qty) + '", "take_profit_price": "' + str.tostring(takeProfitLong) + '", "stop_price": "' + str.tostring(stopLossLong) + '", "tif": "DAY" }'
OCOMarketShort = '{ "alert": "OCO Market Short", "account": "' + str.tostring(acct) + '", "ticker": "' + str.tostring(ticker) + '", "qty": "' + str.tostring(qty) + '", "take_profit_price": "' + str.tostring(takeProfitShort) + '", "stop_price": "' + str.tostring(stopLossShort) + '", "tif": "DAY" }'
CloseAll = '{ "alert": "Close All", "account": "' + str.tostring(acct) + '", "ticker": "' + str.tostring(ticker) + '" }'

strategy.entry("Long", strategy.long, when=buy and buySignal3, alert_message=OCOMarketLong)
strategy.entry("Short", strategy.short, when=sell and sellSignal3, alert_message=OCOMarketShort)

// Setting the take profit and stop loss for long trades
strategy.exit("Take Profit/Stop Loss", "Long", stop=stopLossLong, limit=takeProfitLong,alert_message=CloseAll)

// Setting the take profit and stop loss for short trades
strategy.exit("Take Profit/Stop Loss", "Short", stop=stopLossShort, limit=takeProfitShort,alert_message=CloseAll)

// Plot trade setup boxes
bgcolor(buy ? color.new(color.green, 90) : na, transp=0, offset=-1)
bgcolor(sell ? color.new(color.red, 90) : na, transp=0, offset=-1)

longCondition = buy and not na(entryPrice)
shortCondition = sell and not na(entryPrice)

// var line longTakeProfitLine = na
// var line longStopLossLine = na
// var line shortTakeProfitLine = na
// var line shortStopLossLine = na

// if longCondition
//     longTakeProfitLine := line.new(bar_index, takeProfitLong, bar_index + 1, takeProfitLong, color=color.green, width=2)
//     longStopLossLine := line.new(bar_index, stopLossLong, bar_index + 1, stopLossLong, color=color.red, width=2)
//     // label.new(bar_index + 1, takeProfitLong, str.tostring(takeProfitLong, "#.#####"), color=color.green, style=label.style_none, textcolor=color.green, size=size.tiny)
//     // label.new(bar_index + 1, stopLossLong, str.tostring(stopLossLong, "#.#####"), color=color.red, style=label.style_none, textcolor=color.red, size=size.tiny)

// if shortCondition
//     shortTakeProfitLine := line.new(bar_index, takeProfitShort, bar_index + 1, takeProfitShort, color=color.green, width=2)
//     shortStopLossLine := line.new(bar_index, stopLossShort, bar_index + 1, stopLossShort, color=color.red, width=2)
//     // label.new(bar_index + 1, takeProfitShort, str.tostring(takeProfitShort, "#.#####"), color=color.green, style=label.style_none, textcolor=color.green, size=size.tiny)
//     // label.new(bar_index + 1, stopLossShort, str.tostring(stopLossShort, "#.#####"), color=color.red, style=label.style_none, textcolor=color.red, size=size.tiny)

alertcondition(buy, 'UT Long', 'UT Long')
alertcondition(sell, 'UT Short', 'UT Short')