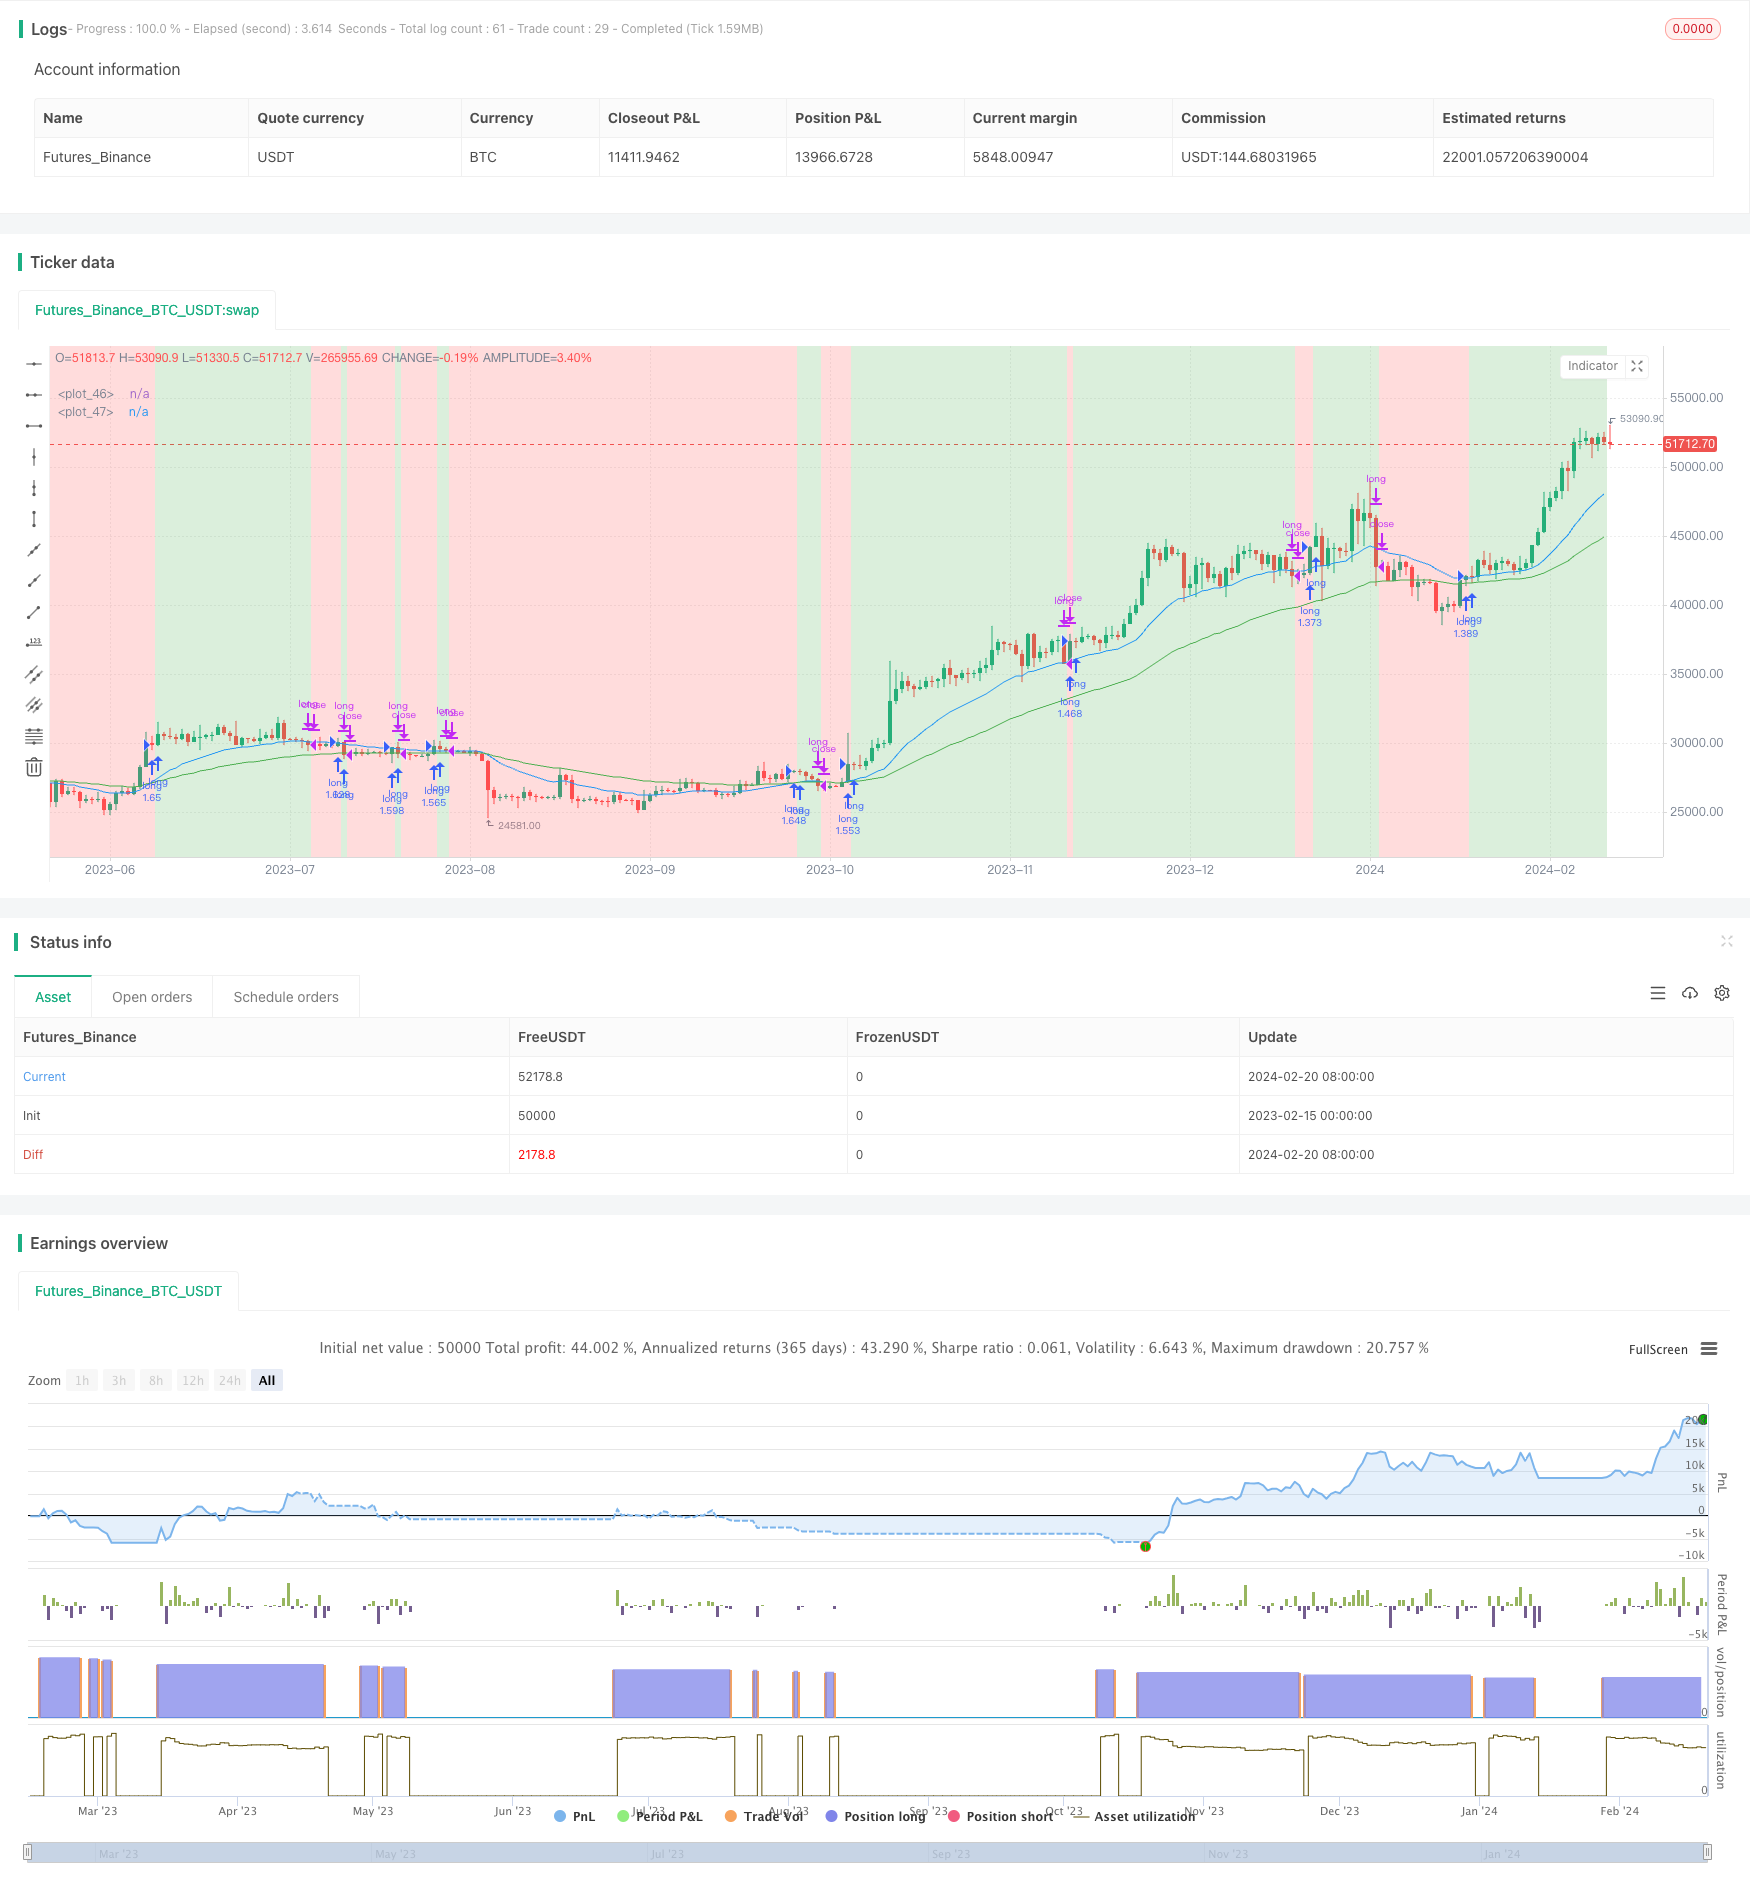
EMAのクロスオーバーに基づいた戦略をフォローする傾向
作者: リン・ハーンチャオチャン,日付: 2024-02-22 13:59:07タグ:

概要
この戦略は,速いEMAと遅いEMAの交差経由で市場のトレンド方向を特定し,トレンドに沿って取引する.速いEMAが遅いEMAを超えるとロングになり,価格が速いEMAを下回るとポジションを閉じる.
戦略の論理
この戦略は,入力パラメータに基づいて,速いEMA (i_shortTerm) と遅いEMA (i_longTerm) を計算する.短期EMAが長期EMA (goLongCondition1) を越えて価格が短期EMA (goLongCondition2) を越えると,ロングポジションに入ります.価格が短期EMA (exitCondition2) を破ると,ポジションを閉じる.
この戦略は,主要市場トレンドを決定し,トレンドに沿って取引するためのEMAラインの黄金十字に基づいています.短期EMAが長期EMAを超えると,上昇傾向を示します.価格が短期EMAを超えると,上昇傾向が進行中であることを示します.価格が短期EMAを下回ると,トレンド逆転を示します.すぐにポジションを閉じます.
利点分析
この戦略の主な利点は以下の通りです.
EMAのクロスオーバーを利用して主要市場動向を特定し,短期変動を回避する.
速くて遅いEMAパラメータによるトレンド検出の調整可能な感度.
シンプルで明快な論理で 分かりやすく実行できます 量子取引の初心者にも適しています
異なる製品や市場のためのEMA期間パラメータをカスタマイズできます.
価格がEMA線を突破したときのストップ損失による効果的なリスク管理
リスク分析
リスクもあります:
遅れたEMAクロスオーバー信号は,トレンド逆転時に損失を引き起こす可能性があります.
短期EMAを上回る誤った突破は 失敗するエントリを引き起こす可能性があります
不適切なパラメータ設定は 戦略の性能を損なう可能性があります
業績は市場状況に大きく依存しており,すべての製品や期間には適していません.
対応するリスク管理測定:
EMA パラメータを最適化して 逆転の感度が向上します
入力信号をフィルターに他の技術指標を追加する.
異なる市場のためのパラメータを継続的にデバッグして最適化します
戦略を適用する前に,適用可能な市場条件を完全に理解する.
オプティマイゼーションの方向性
この戦略は,次の側面においてさらに最適化することができる.
MACDやKDのような他の指標を追加して 入力シグナルをフィルターします
利益とリスク管理を 確保するためにストップロスを実行します
ストップ・ロスの配置を最適化して 波動性指標ATRを使用する.
EMAパラメータ調整のための より良い科学的方法を試し,見つけます.
精度を高めるため 複数のタイムフレームで信号を検証します
トレンド加速段階では大きな動きを捉えるために BREAKOUT 修正を試してみてください
結論
この戦略は,EMAクロスオーバー信号で取引することにより,市場の傾向を効果的に追跡する.明確な論理と制御可能なリスクにより,量子取引の初心者にとって練習に適しています.パラメータチューニング,エントリーフィルタリング,ストップロスの配置に関するさらなる最適化は戦略のパフォーマンスを向上させることができます.しかし,すべての戦略には制限があります.ユーザーはライブ取引時に市場状況に基づいて慎重に適用する必要があります.
/*backtest
start: 2023-02-15 00:00:00
end: 2024-02-21 00:00:00
period: 1d
basePeriod: 1h
exchanges: [{"eid":"Futures_Binance","currency":"BTC_USDT"}]
*/

// This Pine Script™ code is subject to the terms of the Mozilla Public License 2.0 at https://mozilla.org/MPL/2.0/
// © pradhan_abhishek

//@version=5
strategy('EMA cross-over strategy by AP', overlay=true, shorttitle='EMACS-AP', initial_capital=100000, default_qty_value=100, default_qty_type=strategy.percent_of_equity, commission_value=0.025)

// inputs
i_shortTerm = input(title='Fast EMA', defval=21)
i_longTerm = input(title='Slow EMA', defval=55)
// select backtest range: if this is not given, then tradingview goes back since inception / whereever it finds data
i_from = input(defval = timestamp("01 Jan 2023 00:00"), title = "From")
i_to = input(defval = timestamp("31 Dec 2033 23:59"), title = "To")
i_showBg = input(defval = true, title = "Show In-trade / Out-trade background")

// create date function "within window of time"
date() => true

// exponential moving average (EMA) variables, derived from input parameters
shortTermEMA = ta.ema(close, i_shortTerm)
longTermEMA = ta.ema(close, i_longTerm)
atr = ta.atr(14)

// ### Trade strategy: begins ###
inTrade = strategy.position_size > 0
notInTrade = strategy.position_size <= 0

goLongCondition1 = shortTermEMA > longTermEMA
goLongCondition2 = close > shortTermEMA

// exitCondition1 = shortTermEMA < midTermEMA
exitCondition2 = close < shortTermEMA

// enter if not in trade and long conditions are met
if date() and goLongCondition1 and goLongCondition2 and notInTrade
    strategy.entry('long', strategy.long)
    // exit on stop-Loss hit
    stopLoss = close - atr * 3
    strategy.exit('exit', 'long', stop=stopLoss)

// exit if already in trade and take profit conditions are met
if date() and exitCondition2 and inTrade
    strategy.close(id='long')
// ###Trade strategy: ends ###

// plot emas & background color for trade status
plot(shortTermEMA, color=color.new(color.blue, 0))
plot(longTermEMA, color=color.new(color.green, 0))
trade_bgcolor = notInTrade ? color.new(color.red, 75) : color.new(color.green, 75)
bgcolor(i_showBg ? trade_bgcolor : color.new(color.white, 75))
- サポートとレジスタンスレベルを伴うダイナミックなポジション調整に基づいたニフティ50量的な取引戦略
- 動的チャネル移動平均トレンド追跡戦略
- ハーモニック・ダブル・システム戦略
- ブレイクバック・コールバック・ロング・戦略
- 短期および長期移動平均のクロスオーバーに基づいたMAクロスオーバー取引戦略
- 2つの移動平均のクロスオーバー MACD量的な戦略
- 2つの移動平均圧力反発戦略
- 4つのWMAトレンド追跡戦略
- ナダラヤ・ワトソン回帰とATRチャンネルに基づく戦略の傾向
- 移動平均のクロスオーバーに基づくトレンド追跡戦略
- ログ イチモク 交差品種戦略
- RVI と EMA に 基づく ビットコイン トレーディング 戦略
- 双方向逆転量的な取引戦略
- ボリンジャー・バンドの統合戦略
- イチモク・クラウドを用いたクラウドベースのトレンド戦略
- 移動平均値に基づくトレンド逆転戦略
- トレンド フォローする戦略 レンコ移動平均値に基づく
- 3つのRSI移動平均帯の戦略
- 月相に基づく二方向取引戦略
- EMAのクロスオーバーとボリンジャー・バンドによる逆転取引戦略