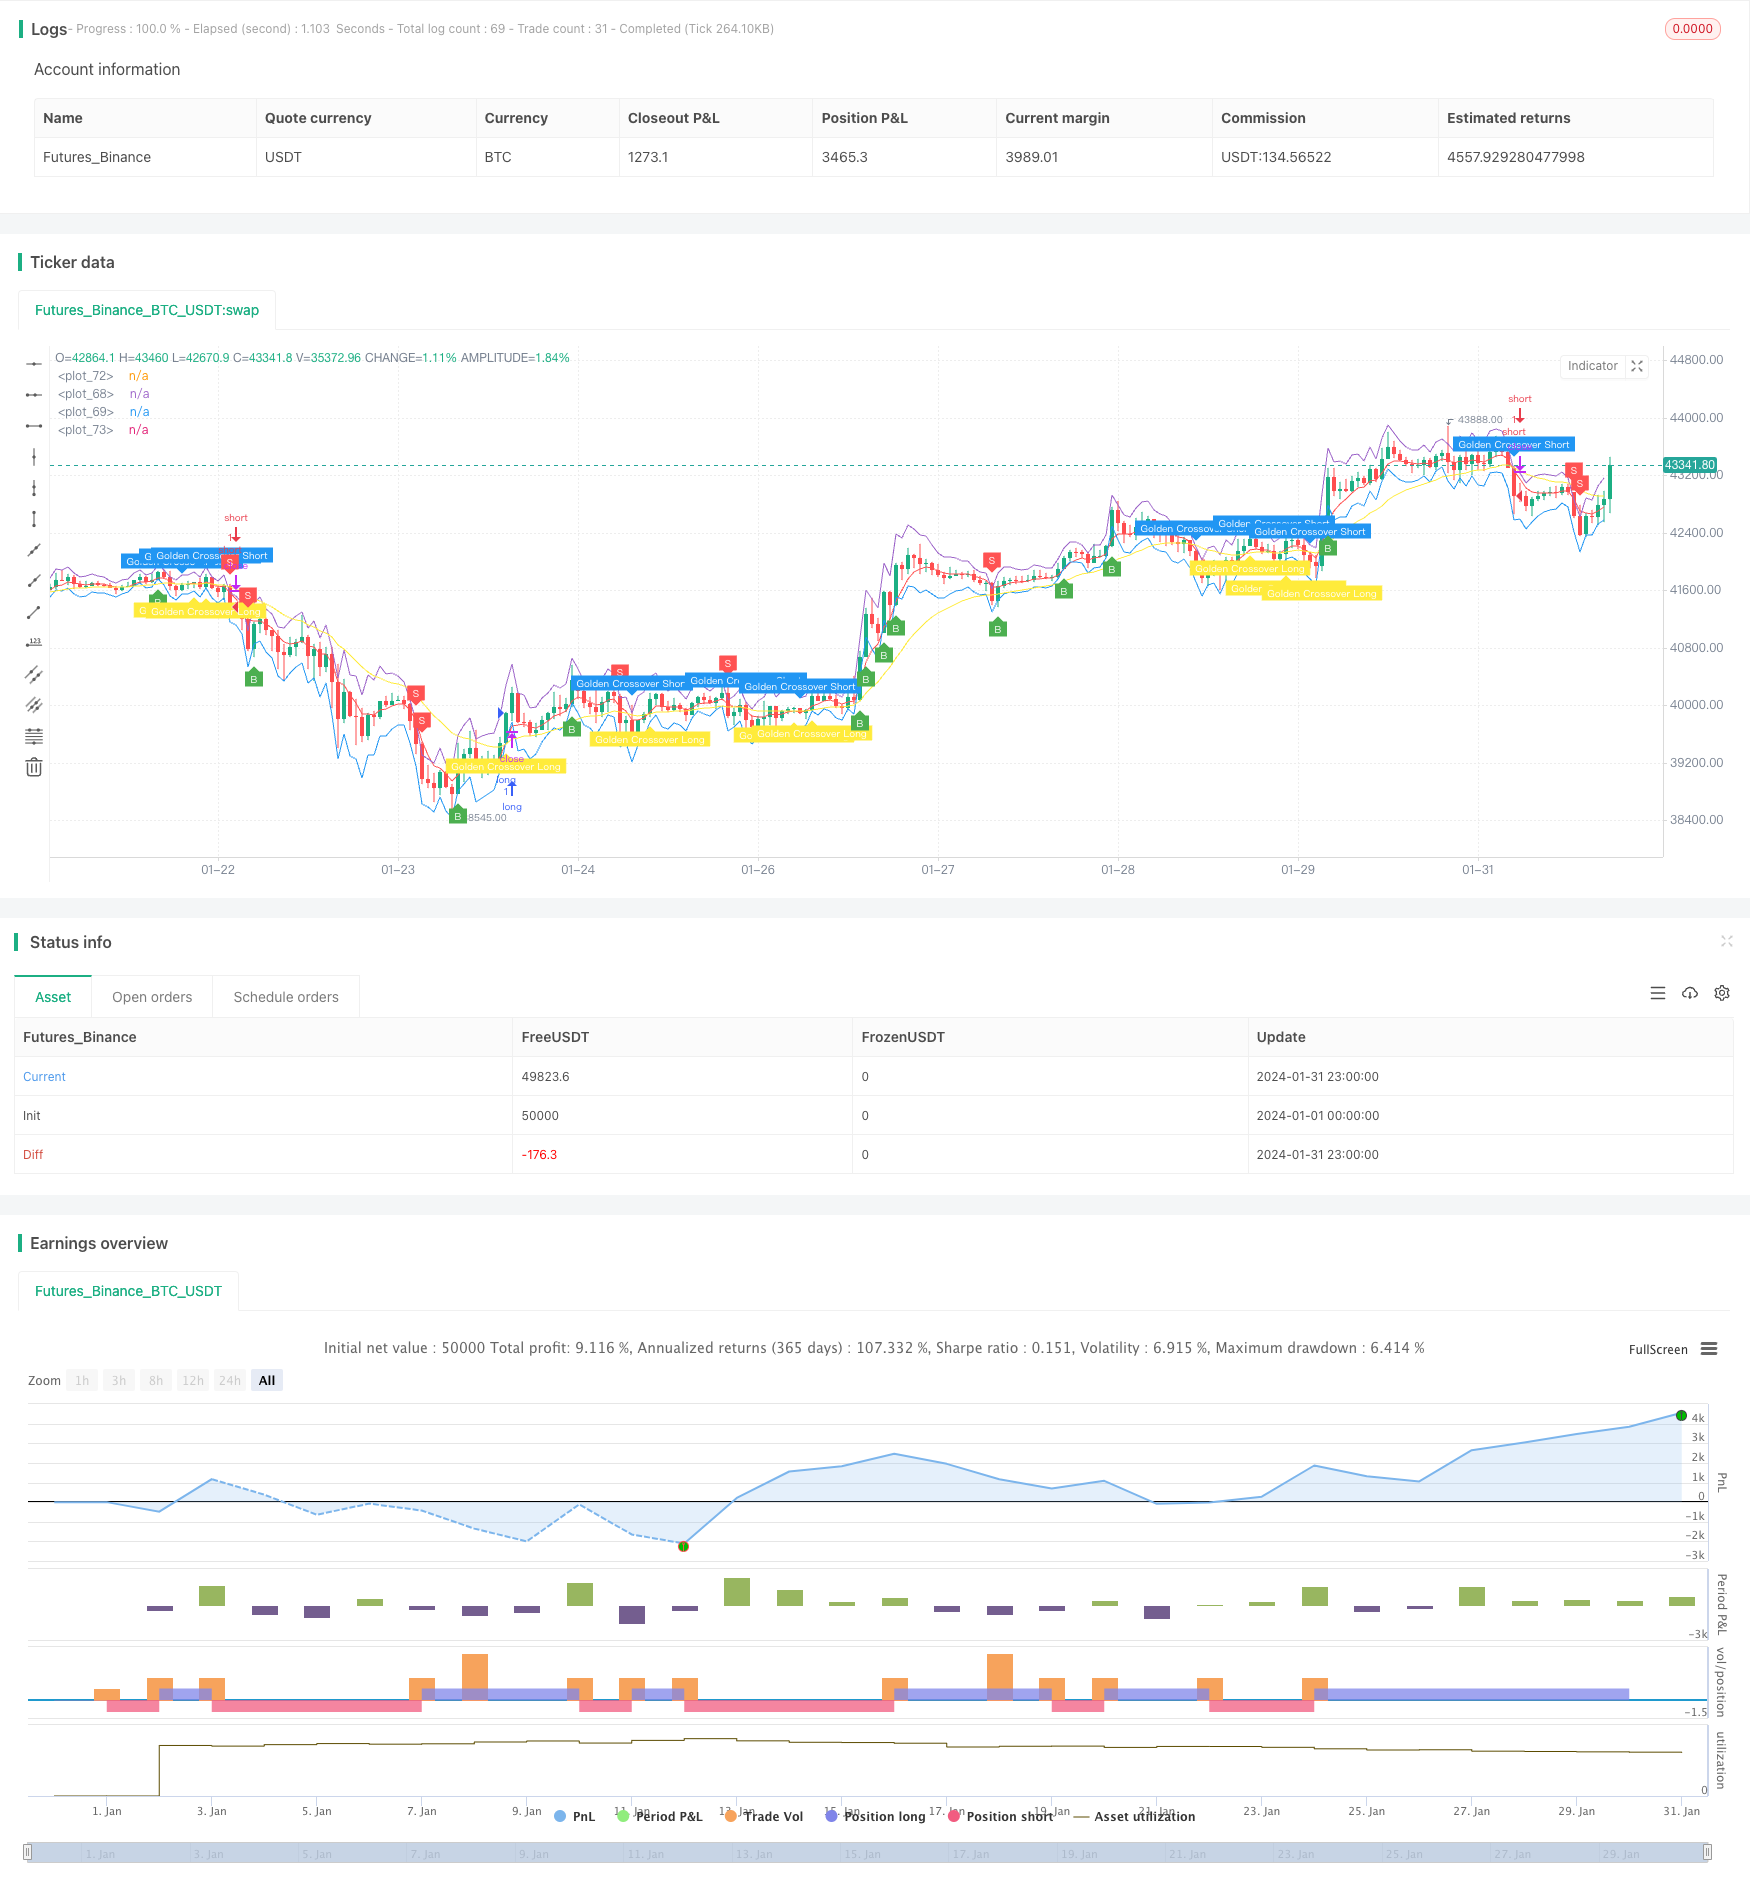
RSIゴールデンクロスに基づくスーパーショートセリング戦略

戦略概要
RSIゴールドフォーク超空調策は,ATR波帯,双RSI指標,EMA均線の金叉死フォークを使用して,トレンド判断とエントリーを実現する.ATR波帯は,価格が超買い状態にあるかどうかを判断するために使用される.双RSI指標は,価格トレンドを確認するために使用される.EMA均線ゴールドフォークは,エントリー機会を見つけるために使用される.この策略は,シンプルで簡単に実行でき,効率的で柔軟な空調策である.
2. 戦略の原則
この戦略はATR波帯,双RSI指標,EMA平均線の3つの要素を組み合わせてエントリーシグナルを実現する.価格がATR波帯の上方より開いたとき,我々は超買いと判断する.このとき,もし速周期RSIが遅周期RSIより低いなら,トレンドが牛回りで熊回りを示し,そしてもしEMA平均線が死叉が発生すれば,トレンドがさらに弱くなったことを示し,この3つのシグナルを総合して,我々はより強力な空売り機会を特定することができる.
価格がATR波帯の上位より高いかどうかを判断します.open>upper_band超買い領域に 置かれるかもしれません. 速いRSIが遅いRSIより低いかどうかを判断します.rsi1<rsi2最後に, EMA平均線がデッドフォークしているかどうかを検知します.ta.crossover(longSMA, shortSMA)成立し,3つの条件が満たされれば,空いた信号を発して入場する.
逆に,価格がATR波帯の下から開くと,急速RSIが遅いRSIより高く,EMA金叉が発生した場合,多入場シグナルが生成されます.
この戦略の主な革新点は,二重RSI指標を導入してトレンド判断し,単一のRSIと比較して高い信頼性を持ち,ATR波帯とEMA均線を組み合わせて信号をフィルタリングし,信号をより正確かつ信頼性のあるものにすることであり,この戦略の核心である.
3 戦略的優位性
この戦略の利点は以下の通りです.
- 双RSIの指数は,トレンドを判断するのにより正確で信頼できる
- ATR波帯は,超買超売の領域を判断し,偽突破を避ける
- EMA平均線が明瞭な金叉/死叉の発生時に入場し,信号の正確性を高める
- 複数の指標の組み合わせが相互検証され,信頼性が高い
- 戦略はシンプルで実行可能
- 超買超売の双方の状況
- 市場によって調整できるパラメータが多く
4 戦略的リスク
この戦略にはいくつかのリスクがあります.
- EMA平均線は誤診に容易で, smoothed MAはより安定している可能性がある
- 震災の際に, 容易にストップダストに巻き込まれる.
- パラメータを正しく設定しない場合,誤信号が増加する可能性があります.
- ATR波帯を突破する時期はまだ早いので,偽突破になる可能性がある.
これらのリスクは,主に以下の側面から最適化できます.
- EMA平均線ではなく,スムージドMAを用いたテスト
- 適正な緩やかなストップ幅で,揺動的な市場が頻繁にストップされるのを避ける
- パーメータの組み合わせを調整して最適なバランスをとる
- 突破波帯の時に,二次検証のために,より多くの指標を導入する.
5 戦略の最適化方向
この戦略は,以下の点でさらに改善できます.
- EMA平均線の代わりにSmoothed MAを用いて,誤診信号を減らすことができるかどうかをテスト
- Keltner通路などの波動率指標を二次検証して偽突破を避ける
- ADXのようなトレンド指標を追加し,大きなトレンドを判断する.
- 特定の品種特性に合わせてパラメータ設定を調整し,最適な組み合わせを見つける
- 異なるタイムサイクルパラメータでのパフォーマンスをテストする
- 機械学習アルゴリズムの自動最適化パラメータを追加
これらの最適化策は,戦略の安定性,柔軟性,収益性をさらに高めることができます.
VI. 結論
RSIゴールドフォーク超空調戦略は,全体的に非常に効率的で実用的ショートライン空調戦略である.それは同時に3種類の指標の優位性を活用して,統合してエントリエの信号を実現し,パラメータを調整することで,異なる品種と市場環境に適応することができる.この戦略の核心的な革新は,トレンド転換を判断する二重RSI指標を使用することであり,ATR波帯とEMA均等線と相互検証し,高精度エントリーを形成するタイミングである.全体的に言えば,この戦略は,非常に実用的で,投資家が積極的に使用する価値がありますが,いくつかのリスク要因も注意が必要です.
/*backtest
start: 2024-01-01 00:00:00
end: 2024-01-31 23:59:59
period: 1h
basePeriod: 15m
exchanges: [{"eid":"Futures_Binance","currency":"BTC_USDT"}]
*/

//@version=5
//Revision: Updated script to pine script version 5
//added Double RSI for Long/Short prosition trend confirmation instead of single RSI
strategy("Super Scalper - 5 Min 15 Min", overlay=true)
source = close
atrlen = input.int(14, "ATR Period")
mult = input.float(1, "ATR Multi", step=0.1)
smoothing = input.string(title="ATR Smoothing", defval="WMA", options=["RMA", "SMA", "EMA", "WMA"])

ma_function(source, atrlen) =>
    if smoothing == "RMA"
        ta.rma(source, atrlen)
    else
        if smoothing == "SMA"
            ta.sma(source, atrlen)
        else
            if smoothing == "EMA"
                ta.ema(source, atrlen)
            else
                ta.wma(source, atrlen)

atr_slen = ma_function(ta.tr(true), atrlen)
upper_band = atr_slen * mult + close
lower_band = close - atr_slen * mult

// Create Indicator's
ShortEMAlen = input.int(5, "Fast EMA")
LongEMAlen = input.int(21, "Slow EMA")
shortSMA = ta.ema(close, ShortEMAlen)
longSMA = ta.ema(close, LongEMAlen)
RSILen1 = input.int(40, "Fast RSI Length")
RSILen2 = input.int(60, "Slow RSI Length")
rsi1 = ta.rsi(close, RSILen1)
rsi2 = ta.rsi(close, RSILen2)
atr = ta.atr(atrlen)

//RSI Cross condition
RSILong = rsi1 > rsi2
RSIShort = rsi1 < rsi2

// Specify conditions
longCondition = open < lower_band
shortCondition = open > upper_band
GoldenLong = ta.crossover(shortSMA, longSMA)
Goldenshort = ta.crossover(longSMA, shortSMA)

plotshape(shortCondition, title="Sell Label", text="S", location=location.abovebar, style=shape.labeldown, size=size.tiny, color=color.new(color.red, 0), textcolor=color.white)
plotshape(longCondition, title="Buy Label", text="B", location=location.belowbar, style=shape.labelup, size=size.tiny, color=color.new(color.green, 0), textcolor=color.white)
plotshape(Goldenshort, title="Golden Sell Label", text="Golden Crossover Short", location=location.abovebar, style=shape.labeldown, size=size.tiny, color=color.new(color.blue, 0), textcolor=color.white)
plotshape(GoldenLong, title="Golden Buy Label", text="Golden Crossover Long", location=location.belowbar, style=shape.labelup, size=size.tiny, color=color.new(color.yellow, 0), textcolor=color.white)

// Execute trade if condition is True
if (longCondition)
    stopLoss = low - atr * 1
    takeProfit = high + atr * 4
    if (RSILong)
        strategy.entry("long", strategy.long)

if (shortCondition)
    stopLoss = high + atr * 1
    takeProfit = low - atr * 4
    if (RSIShort)
        strategy.entry("short", strategy.short)

// Plot ATR bands to chart

////ATR Up/Low Bands
plot(upper_band)
plot(lower_band)

// Plot Moving Averages
plot(shortSMA, color=color.red)
plot(longSMA, color=color.yellow)