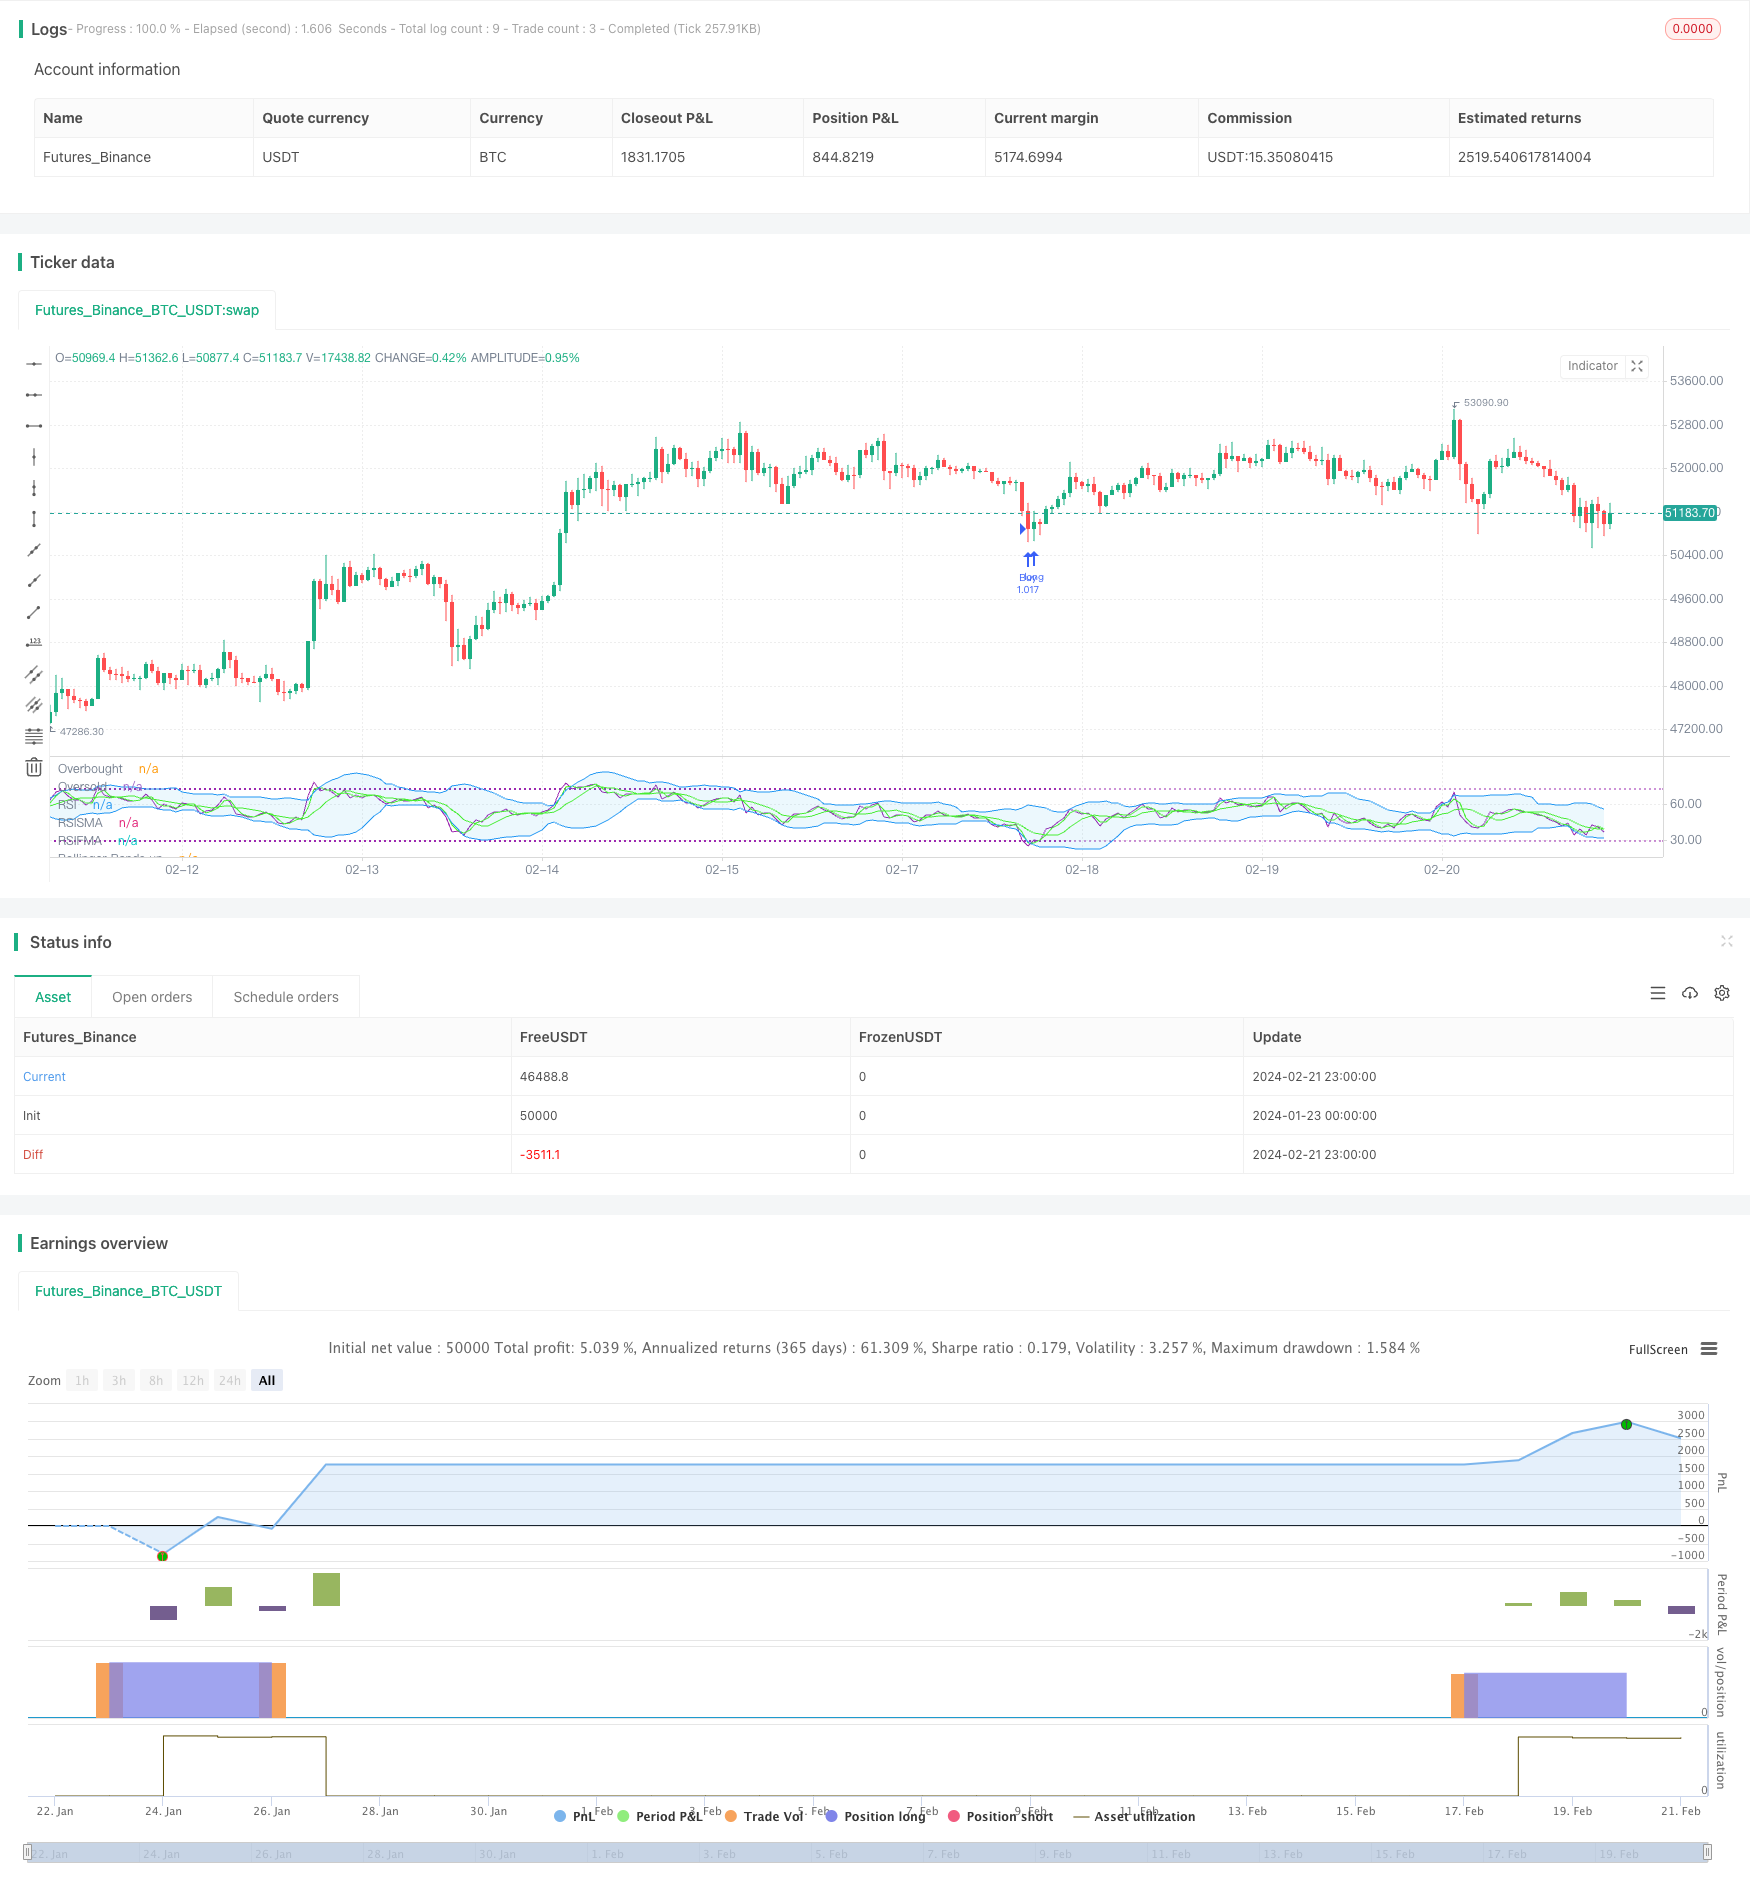
RSI移動平均ダブルゴールデンクロスオシレーション戦略

概要
RSI均線双金叉振動戦略は,RSI指標と均線の金叉死叉信号を同時に利用して,買入を決定する量化取引戦略である.この戦略は,RSI指標を使用して,市場が過大評価されているか過小評価されているかを判断し,均線のトレンド判断と組み合わせて,RSI指標がオーバーバイのオーバーセルの現象を示しているときに取引を発行する.これは,偽の信号を効果的にフィルターして,戦略の安定性を高める.
戦略原則
この戦略は,主にRSI指標と平均線の組み合わせを使用することに基づいています. まず,一定の周期のRSI値を計算し,超買超売ラインを設定します. 次に,迅速な平均線と遅い平均線を計算します. RSI指標の上で慢速平均線を穿え,同時にRSI値は超売ラインより低く,軌道下にあるときに買入シグナルを生成します.
優位分析
この戦略の最大の利点は,同時RSI指標を使用して,オーバーバイオーバーセルの現象を判断し,均線でトレンドの方向を判断することで,偽突破を効果的に回避できるということです. さらに,RSIとBOLLチャネルの組み合わせの使用は,さらに騒音をフィルターし,取引シグナルをより正確にすることができます.
リスク分析
この戦略に伴うリスクは,操作頻度が高すぎ,仓庫を押す容易さ,パラメータを誤って設定すると信号の精度が低下する可能性がある.また,震動の状況下でも損失が発生する可能性がある.
最適化の方向
RSIパラメータまたは平均周期パラメータを異なる周期に対応するように調整することも考えられます. 他の指標のフィルター信号と組み合わせる. リスクを制御するためにストップ・ローズ・ストップポイントを設定する.
要約する
RSI平均線双金叉振動戦略は,全体的に,より安定した信頼性の高いショートライン取引戦略である.パラメータ調整とリスク管理の組み合わせにより,よりよい収益収益率を得ることができる.この戦略は,理解し,実装しやすいため,量子取引の初心者にとって非常に適しています.
/*backtest
start: 2024-01-23 00:00:00
end: 2024-02-22 00:00:00
period: 1h
basePeriod: 15m
exchanges: [{"eid":"Futures_Binance","currency":"BTC_USDT"}]
*/

//@version=5
strategy("RSI slowma Ismael", overlay=false, default_qty_type=strategy.percent_of_equity, default_qty_value=100)

// Definir la longitud del RSI
rsi_length = input(title='RSI Length', defval=14)

//media
Fast = input(title='Fast', defval=7)
slow = input(title='Slow', defval=2)

// Definir los niveles de sobrecompra y sobreventa del RSI
rsi_overbought = input(title='RSI Overbought Level', defval=72)
rsi_oversold = input(title='RSI Oversold Level', defval=29)

// Definir la longitud y la desviación estándar de las Bandas de Bollinger
bb_length = input(title="Bollinger Bands Length", defval=14)
bb_stddev = input(title="Bollinger Bands StdDev", defval=2)

// Calcular RSI
rsi_value = ta.rsi(close, rsi_length)

// Calcular Bandas de Bollinger
bb_upper = ta.sma(rsi_value, bb_length) + bb_stddev* ta.stdev(rsi_value, bb_length)
bb_lower = ta.sma(rsi_value, bb_length) - bb_stddev * ta.stdev(rsi_value, bb_length)

//media movil adelantada
fastMA = ta.sma(rsi_value, Fast)
slowMA = ta.sma(rsi_value, slow)

// Definir la señal de compra y venta
buy_signal = (ta.crossover(rsi_value, slowMA) and rsi_value < bb_lower and rsi_value < rsi_oversold) or (rsi_value < bb_lower and rsi_value < rsi_oversold)
sell_signal = (ta.crossunder(rsi_value, slowMA) and rsi_value > bb_upper and rsi_value > rsi_overbought) or (rsi_value > bb_upper and rsi_value > rsi_overbought)

// Configurar las condiciones de entrada y salida del mercado
if buy_signal
    strategy.entry("Buy", strategy.long)

if sell_signal
    strategy.close("Buy")

// Configurar el stop loss y el take profit
stop_loss = input.float(title='Stop Loss (%)', step=0.01, defval=3)
take_profit = input.float(title='Take Profit (%)', step=0.01, defval=8)

strategy.exit("Exit Long", "Buy", stop=close - close * stop_loss / 100, limit=close + close * take_profit / 100)

// Configurar la visualización del gráfico
plot(slowMA, title='RSISMA', color=color.rgb(75, 243, 33), linewidth=1)
plot(fastMA, title='RSIFMA', color=color.rgb(75, 243, 33), linewidth=1)
plot(rsi_value, title='RSI', color=color.purple, linewidth=1)

// Marcar las zonas de sobrecompra y sobreventa en el grafico del RSI
hl= hline(rsi_overbought, title='Overbought', color=color.purple, linestyle=hline.style_dotted, linewidth=1)
hll= hline(rsi_oversold, title='Oversold', color=color.purple, linestyle=hline.style_dotted, linewidth=1)
fill(hl,hll, color= color.new(color.purple, 91))

bbfill = plot(bb_upper, title='Bollinger Bands up', color=color.blue, linewidth=1)
bbfill1= plot(bb_lower, title='Bollinger Bands down', color=color.blue, linewidth=1)
fill(bbfill,bbfill1, color= color.new(#2bb5ec, 91))