무작위 틱커 생성기에 기반한 전략 테스트 방법 논의
저자:FMZ~리디아, 창작: 2024-12-02 11:26:13, 업데이트: 2024-12-02 21:39:39
전문
FMZ 양자 거래 플랫폼의 백테스팅 시스템은 지속적으로 반복, 업데이트 및 업그레이드되는 백테스팅 시스템입니다. 초기 기본 백테스팅 기능에서 기능을 추가하고 성능을 점진적으로 최적화합니다. 플랫폼의 개발에 따라 백테스팅 시스템은 계속해서 최적화 및 업그레이드 될 것입니다. 오늘은 백테스팅 시스템에 기반한 주제에 대해 논의 할 것입니다.
수요
양적 거래 분야에서 전략의 개발과 최적화는 실제 시장 데이터의 검증과 분리될 수 없다. 그러나 실제 응용 프로그램에서는 복잡하고 변화하는 시장 환경으로 인해 극한 시장 조건이나 특수 시나리오의 커버리지 부족과 같은 역 테스트를 위해 역사적 데이터에 의존하는 것이 충분하지 않을 수 있다. 따라서 효율적인 무작위 시장 생성자를 설계하는 것은 양적 전략 개발자에게 효과적인 도구가 되었다.
우리가 전략이 특정 거래소 또는 통화에 대한 역사적 데이터를 추적 할 필요가있을 때, 우리는 역 테스트를 위해 FMZ 플랫폼의 공식 데이터 소스를 사용할 수 있습니다. 때로는 전략이 완전히 낯선 시장에서 어떻게 수행하는지보고 싶어합니다. 그래서 우리는 전략을 테스트하기 위해 일부 데이터를 만들 수 있습니다.
무작위 틱어 데이터 사용의 중요성은 다음과 같습니다.
-
- 전략의 안정성을 평가합니다. 무작위 틱어 생성기는 극심한 변동성, 낮은 변동성, 트렌딩 시장 및 변동 시장 등 다양한 가능한 시장 시나리오를 만들 수 있습니다. 이러한 시뮬레이션 환경에서 테스트 전략을 사용하면 다른 시장 조건에서 성능이 안정적인지 평가하는 데 도움이 될 수 있습니다. 예를 들어:
전략은 트렌드와 변동성 변화에 적응할 수 있나요? 이 전략은 극단적인 시장 조건에서 큰 손실을 입을까요?
-
- 전략의 잠재적인 약점을 확인 일부 비정상적인 시장 상황을 시뮬레이션함으로써 (하포테틱 블랙 스완 이벤트와 같이) 전략의 잠재적 약점을 발견하고 개선 할 수 있습니다. 예를 들어:
전략은 특정 시장 구조에 너무 의존합니까? 패러미터가 너무 잘 맞을 위험이 있나요?
-
- 전략 매개 변수 최적화 무작위로 생성된 데이터는 전략 매개 변수 최적화를 위해 완전히 역사적 데이터에 의존하지 않고 더 다양한 테스트 환경을 제공합니다. 이것은 전략의 매개 변수 범위를 더 포괄적으로 찾을 수 있도록하고 역사적 데이터에서 특정 시장 패턴에 제한되지 않도록합니다.
-
- 역사 자료의 공백을 채우기 일부 시장 (상흥 시장 또는 작은 통화 거래 시장과 같이) 에서, 역사적 데이터는 가능한 모든 시장 조건을 포괄하기에 충분하지 않을 수 있습니다. 무작위 틱어 생성기는 더 포괄적인 테스트를 수행하는 데 도움이되는 많은 양의 보충 데이터를 제공할 수 있습니다.
-
- 빠른 반복 개발 급속한 테스트를 위해 무작위 데이터를 사용하면 실시간 시장 틱어 조건이나 시간이 많이 걸리는 데이터 청소 및 조직에 의존하지 않고 전략 개발의 반복을 가속화 할 수 있습니다.
그러나 전략을 합리적으로 평가하는 것도 필요합니다. 무작위로 생성 된 틱어 데이터에 대해서는 다음을 참고하십시오.
-
- 무작위 시장 생성자가 유용하지만, 그 중요성은 생성된 데이터의 품질과 목표 시나리오의 설계에 달려 있습니다.
-
- 생성 논리는 실제 시장에 가깝아야합니다. 무작위로 생성된 시장이 현실과 완전히 연결되지 않으면 테스트 결과는 참조 가치가 부족할 수 있습니다. 예를 들어, 생성기는 실제 시장 통계 특성에 따라 설계 될 수 있습니다. (변동성 분포, 트렌드 비율과 같은).
-
- 그것은 실제 데이터 테스트를 완전히 대체 할 수 없습니다: 무작위 데이터는 전략의 개발과 최적화를 보충 할 수 있습니다. 최종 전략은 여전히 실제 시장 데이터에서 효과를 확인해야합니다.
이렇게 많은 것을 말하면서, 우리는 어떻게 데이터를 "제조"할 수 있을까요? 백테스팅 시스템이 편리하고 빠르고 쉽게 사용할 수 있도록 데이터를 "제조"할 수 있을까요?
디자인 아이디어
이 문서는 토론의 출발점을 제공하기 위해 고안되었으며 비교적 간단한 무작위 틱어 생성 계산을 제공합니다. 실제로 다양한 시뮬레이션 알고리즘, 데이터 모델 및 기타 기술이 적용 될 수 있습니다. 논의의 제한된 공간으로 인해 복잡한 데이터 시뮬레이션 방법을 사용하지 않을 것입니다.
플랫폼 백테스팅 시스템의 사용자 정의 데이터 소스 기능을 결합하여 파이썬으로 프로그램을 작성했습니다.
-
- K-라인 데이터를 무작위로 생성하고 CSV 파일로 기록하여 생성된 데이터를 저장할 수 있습니다.
-
- 그런 다음 백테스팅 시스템을 위한 데이터 소스 지원을 제공하는 서비스를 만들어 보세요.
-
- 그래프에 생성된 K-라인 데이터를 표시합니다.
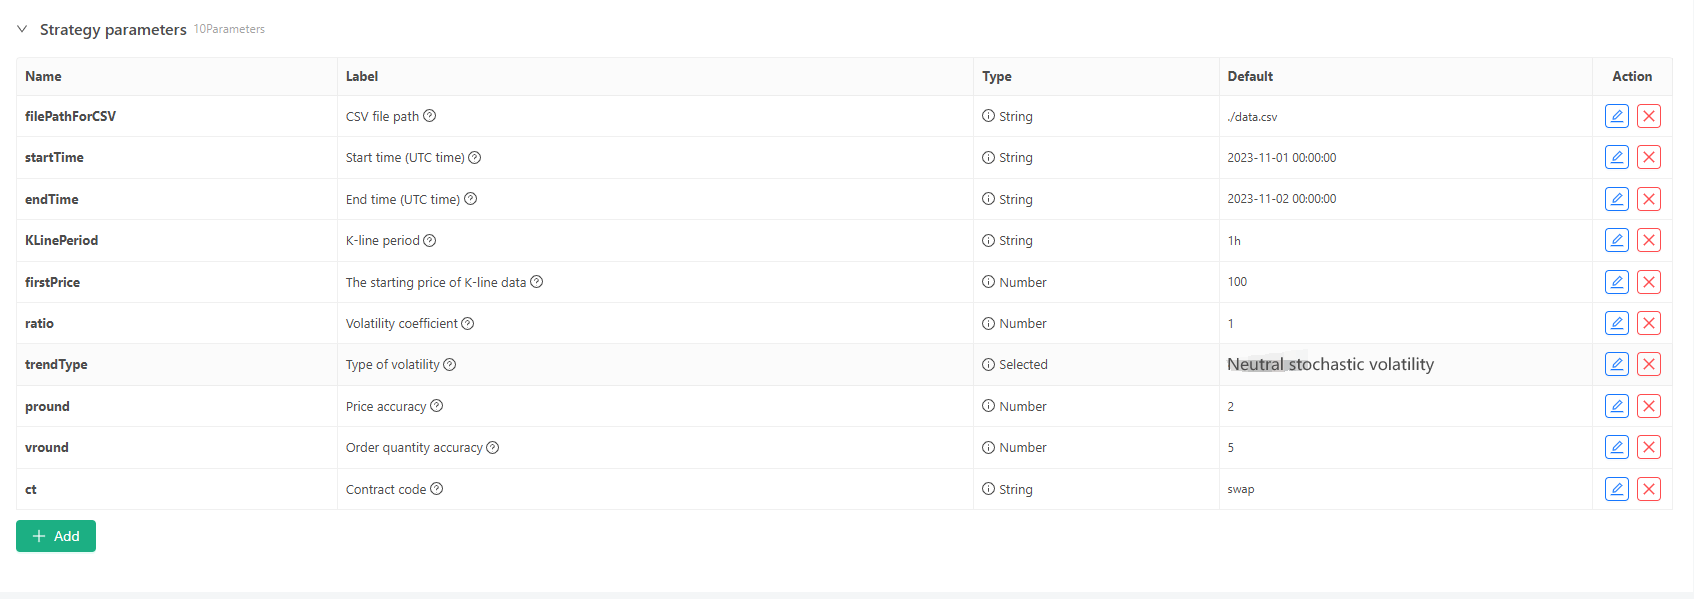
일부 생성 표준 및 K-라인 데이터의 파일 저장에 대해서는 다음과 같은 매개 변수 컨트롤을 정의할 수 있습니다.

-
무작위 데이터 생성 모드 K-라인 데이터의 변동 유형을 시뮬레이션하기 위해, 양수와 음수의 확률을 사용하여 간단한 디자인이 만들어집니다. 생성된 데이터가 많지 않을 경우 필요한 시장 패턴을 반영하지 않을 수 있습니다. 더 나은 방법이 있다면, 코드의이 부분은 대체 될 수 있습니다. 이 간단한 디자인을 바탕으로, 무작위 숫자 생성 범위와 코드 내의 일부 계수들을 조정하면 생성된 데이터 효과에 영향을 줄 수 있습니다.
-
데이터 확인 생성된 K-라인 데이터의 합리성을 테스트하고, 높은 오픈 가격과 낮은 종료 가격이 정의를 위반하는지 확인하고, K-라인 데이터의 연속성을 확인해야 합니다.
백테스팅 시스템 무작위 틱어 생성기
import _thread
import json
import math
import csv
import random
import os
import datetime as dt
from http.server import HTTPServer, BaseHTTPRequestHandler
from urllib.parse import parse_qs, urlparse

arrTrendType = ["down", "slow_up", "sharp_down", "sharp_up", "narrow_range", "wide_range", "neutral_random"]

def url2Dict(url):
    query = urlparse(url).query
    params = parse_qs(query)
    result = {key: params[key][0] for key in params}
    return result

class Provider(BaseHTTPRequestHandler):
    def do_GET(self):
        global filePathForCSV, pround, vround, ct
        try:
            self.send_response(200)
            self.send_header("Content-type", "application/json")
            self.end_headers()

            dictParam = url2Dict(self.path)
            Log("the custom data source service receives the request, self.path:", self.path, "query parameter:", dictParam)

            eid = dictParam["eid"]
            symbol = dictParam["symbol"]
            arrCurrency = symbol.split(".")[0].split("_")
            baseCurrency = arrCurrency[0]
            quoteCurrency = arrCurrency[1]
            fromTS = int(dictParam["from"]) * int(1000)
            toTS = int(dictParam["to"]) * int(1000)
            priceRatio = math.pow(10, int(pround))
            amountRatio = math.pow(10, int(vround))

            data = {
                "detail": {
                    "eid": eid,
                    "symbol": symbol,
                    "alias": symbol,
                    "baseCurrency": baseCurrency,
                    "quoteCurrency": quoteCurrency,
                    "marginCurrency": quoteCurrency,
                    "basePrecision": vround,
                    "quotePrecision": pround,
                    "minQty": 0.00001,
                    "maxQty": 9000,
                    "minNotional": 5,
                    "maxNotional": 9000000,
                    "priceTick": 10 ** -pround,
                    "volumeTick": 10 ** -vround,
                    "marginLevel": 10,
                    "contractType": ct
                },
                "schema" : ["time", "open", "high", "low", "close", "vol"],
                "data" : []
            }

            listDataSequence = []
            with open(filePathForCSV, "r") as f:
                reader = csv.reader(f)
                header = next(reader)
                headerIsNoneCount = 0
                if len(header) != len(data["schema"]):
                    Log("The CSV file format is incorrect, the number of columns is different, please check!", "#FF0000")
                    return
                for ele in header:
                    for i in range(len(data["schema"])):
                        if data["schema"][i] == ele or ele == "":
                            if ele == "":
                                headerIsNoneCount += 1
                            if headerIsNoneCount > 1:
                                Log("The CSV file format is incorrect, please check!", "#FF0000")
                                return
                            listDataSequence.append(i)
                            break

                while True:
                    record = next(reader, -1)
                    if record == -1:
                        break
                    index = 0
                    arr = [0, 0, 0, 0, 0, 0]
                    for ele in record:
                        arr[listDataSequence[index]] = int(ele) if listDataSequence[index] == 0 else (int(float(ele) * amountRatio) if listDataSequence[index] == 5 else int(float(ele) * priceRatio))
                        index += 1
                    data["data"].append(arr)
            Log("data.detail: ", data["detail"], "Respond to backtesting system requests.")
            self.wfile.write(json.dumps(data).encode())
        except BaseException as e:
            Log("Provider do_GET error, e:", e)
        return

def createServer(host):
    try:
        server = HTTPServer(host, Provider)
        Log("Starting server, listen at: %s:%s" % host)
        server.serve_forever()
    except BaseException as e:
        Log("createServer error, e:", e)
        raise Exception("stop")

class KlineGenerator:
    def __init__(self, start_time, end_time, interval):
        self.start_time = dt.datetime.strptime(start_time, "%Y-%m-%d %H:%M:%S")
        self.end_time = dt.datetime.strptime(end_time, "%Y-%m-%d %H:%M:%S")
        self.interval = self._parse_interval(interval)
        self.timestamps = self._generate_time_series()

    def _parse_interval(self, interval):
        unit = interval[-1]
        value = int(interval[:-1])

        if unit == "m":
            return value * 60
        elif unit == "h":
            return value * 3600
        elif unit == "d":
            return value * 86400
        else:
            raise ValueError("Unsupported K-line period, please use 'm', 'h', or 'd'.")

    def _generate_time_series(self):
        timestamps = []
        current_time = self.start_time
        while current_time <= self.end_time:
            timestamps.append(int(current_time.timestamp() * 1000))
            current_time += dt.timedelta(seconds=self.interval)
        return timestamps

    def generate(self, initPrice, trend_type="neutral", volatility=1):
        data = []
        current_price = initPrice
        angle = 0
        for timestamp in self.timestamps:
            angle_radians = math.radians(angle % 360)
            cos_value = math.cos(angle_radians)

            if trend_type == "down":
                upFactor = random.uniform(0, 0.5)
                change = random.uniform(-0.5, 0.5 * upFactor) * volatility * random.uniform(1, 3)
            elif trend_type == "slow_up":
                downFactor = random.uniform(0, 0.5)
                change = random.uniform(-0.5 * downFactor, 0.5) * volatility * random.uniform(1, 3)
            elif trend_type == "sharp_down":
                upFactor = random.uniform(0, 0.5)
                change = random.uniform(-10, 0.5 * upFactor) * volatility * random.uniform(1, 3)
            elif trend_type == "sharp_up":
                downFactor = random.uniform(0, 0.5)
                change = random.uniform(-0.5 * downFactor, 10) * volatility * random.uniform(1, 3)
            elif trend_type == "narrow_range":
                change = random.uniform(-0.2, 0.2) * volatility * random.uniform(1, 3)
            elif trend_type == "wide_range":
                change = random.uniform(-3, 3) * volatility * random.uniform(1, 3)
            else:
                change = random.uniform(-0.5, 0.5) * volatility * random.uniform(1, 3)

            change = change + cos_value * random.uniform(-0.2, 0.2) * volatility
            open_price = current_price
            high_price = open_price + random.uniform(0, abs(change))
            low_price = max(open_price - random.uniform(0, abs(change)), random.uniform(0, open_price))
            close_price = open_price + change if open_price + change < high_price and open_price + change > low_price else random.uniform(low_price, high_price)

            if (high_price >= open_price and open_price >= close_price and close_price >= low_price) or (high_price >= close_price and close_price >= open_price and open_price >= low_price):
                pass
            else:
                Log("Abnormal data:", high_price, open_price, low_price, close_price, "#FF0000")

            high_price = max(high_price, open_price, close_price)
            low_price = min(low_price, open_price, close_price)

            base_volume = random.uniform(1000, 5000)
            volume = base_volume * (1 + abs(change) * 0.2)

            kline = {
                "Time": timestamp,
                "Open": round(open_price, 2),
                "High": round(high_price, 2),
                "Low": round(low_price, 2),
                "Close": round(close_price, 2),
                "Volume": round(volume, 2),
            }
            data.append(kline)
            current_price = close_price
            angle += 1
        return data

    def save_to_csv(self, filename, data):
        with open(filename, mode="w", newline="") as csvfile:
            writer = csv.writer(csvfile)
            writer.writerow(["", "open", "high", "low", "close", "vol"])
            for idx, kline in enumerate(data):
                writer.writerow(
                    [kline["Time"], kline["Open"], kline["High"], kline["Low"], kline["Close"], kline["Volume"]]
                )

        Log("Current path:", os.getcwd())
        with open("data.csv", "r") as file:
            lines = file.readlines()
            if len(lines) > 1:
                Log("The file was written successfully. The following is part of the file content:")
                Log("".join(lines[:5]))
            else:
                Log("Failed to write the file, the file is empty!")

def main():
    Chart({})
    LogReset(1)

    try:
        # _thread.start_new_thread(createServer, (("localhost", 9090), ))
        _thread.start_new_thread(createServer, (("0.0.0.0", 9090), ))
        Log("Start the custom data source service thread, and the data is provided by the CSV file.", ", Address/Port: 0.0.0.0:9090", "#FF0000")
    except BaseException as e:
        Log("Failed to start custom data source service!")
        Log("error message:", e)
        raise Exception("stop")

    while True:
        cmd = GetCommand()
        if cmd:
            if cmd == "createRecords":
                Log("Generator parameters:", "Start time:", startTime, "End time:", endTime, "K-line period:", KLinePeriod, "Initial price:", firstPrice, "Type of volatility:", arrTrendType[trendType], "Volatility coefficient:", ratio)
                generator = KlineGenerator(
                    start_time=startTime,
                    end_time=endTime,
                    interval=KLinePeriod,
                )
                kline_data = generator.generate(firstPrice, trend_type=arrTrendType[trendType], volatility=ratio)
                generator.save_to_csv("data.csv", kline_data)
                ext.PlotRecords(kline_data, "%s_%s" % ("records", KLinePeriod))
        LogStatus(_D())
        Sleep(2000)
백테스팅 시스템에서의 연습
- 위 전략 인스턴스를 만들고 매개 변수를 구성하고 실행합니다.
- 라이브 트레이딩 (전략 인스턴스) 는 서버에 배포된 도커에서 실행되어야하며, 백테스팅 시스템이 액세스하고 데이터를 얻을 수 있도록 공개 네트워크 IP가 필요합니다.
- 상호 작용 버튼을 클릭하면 전략이 자동으로 무작위 틱어 데이터를 생성합니다.

- 생성된 데이터는 쉽게 관찰할 수 있도록 차트에 표시되고, 데이터는 로컬 data.csv 파일에 기록됩니다.

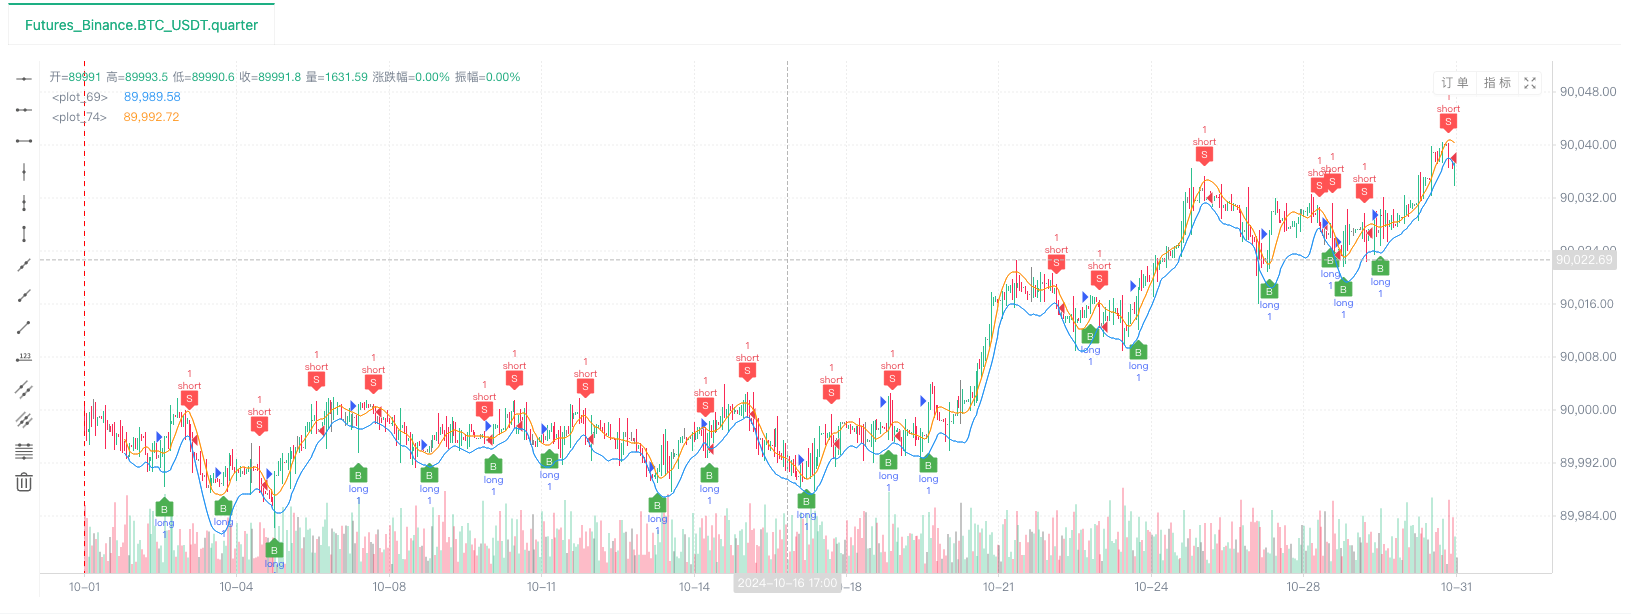
- 이제 우리는 무작위로 생성된 데이터를 사용하여 어떤 전략을든 백테스팅을 할 수 있습니다.

/*backtest
start: 2024-10-01 08:00:00
end: 2024-10-31 08:55:00
period: 1h
basePeriod: 1h
exchanges: [{"eid":"Futures_Binance","currency":"BTC_USDT","feeder":"http://xxx.xxx.xxx.xxx:9090"}]
args: [["ContractType","quarter",358374]]
*/
위의 정보에 따라 설정하고 조정합니다.http://xxx.xxx.xxx.xxx:9090임의 틱어 생성 전략의 서버 IP 주소와 오픈 포트입니다.
이것은 플랫폼 API 문서의 사용자 지정 데이터 소스 섹션에서 찾을 수 있는 사용자 지정 데이터 소스입니다.
- 백테스트 시스템이 데이터 소스를 설정한 후, 우리는 무작위 시장 데이터를 테스트할 수 있습니다.


이 때, 백테스트 시스템은 우리의
- 오, 네, 거의 언급하는 것을 잊었습니다! 무작위 티커 생성기의 이 파이썬 프로그램이 라이브 트레이딩을 만드는 이유는 생성된 K-라인 데이터의 시범, 운영 및 표시를 촉진하기 때문입니다. 실제 응용 프로그램에서는 독립적인 파이썬 스크립트를 작성할 수 있으므로 라이브 트레이딩을 실행할 필요가 없습니다.
전략 소스 코드:백테스팅 시스템 무작위 틱어 생성기
여러분의 지원과 독서 감사합니다.
- DEX 거래소 정량화 연습 ((1)-- dYdX v4 사용 설명서
- 디지털 화폐의 리드-래그 스위트 소개 (3)
- 암호화폐의 리드-래그 중재에 대한 소개 (2)
- 디지털 화폐의 리드-래그 스위트 소개 (2)
- FMZ 플랫폼의 외부 신호 수신에 대한 논의: 전략 내 내장 Http 서비스와 함께 신호 수신에 대한 완전한 솔루션
- FMZ 플랫폼 외부 신호 수신에 대한 탐구: 전략 내장 HTTP 서비스 신호 수신의 전체 방안
- 암호화폐의 리드-래그 중재에 대한 소개 (1)
- 디지털 화폐의 리드-래그 스위트 소개 (1)
- FMZ 플랫폼의 외부 신호 수신에 대한 논의: 확장 API VS 전략 내장 HTTP 서비스
- FMZ 플랫폼 외부 신호 수신에 대한 탐구: 확장 API vs 전략 내장 HTTP 서비스
- 무작위 시장 생성기에 기반한 전략 테스트 방법을 탐구합니다.
- FMZ Quant의 새로운 기능: _Serve 기능을 사용하여 HTTP 서비스를 쉽게 만들 수 있습니다
- 발명가들의 새로운 기능: _Serve 기능을 사용하여 쉽게 HTTP 서비스를 만들 수 있습니다.
- FMZ 양자 거래 플랫폼 사용자 지정 프로토콜 액세스 가이드
- FMZ 펀딩 비율 획득 및 모니터링 전략
- FMZ 자금률 확보 및 모니터링 전략 전략
- 전략 템플릿은 웹소켓 마켓을 원활하게 사용할 수 있습니다
- 웹소켓을 원활하게 사용할 수 있는 정책 템플릿
- 발명가 양적 거래 플랫폼 일반 프로토콜 접근 지침
- FMZ 업그레이드 후 어떻게 하면 유니버설 멀티 화폐 거래 전략을 빠르게 구축 할 수 있습니까?