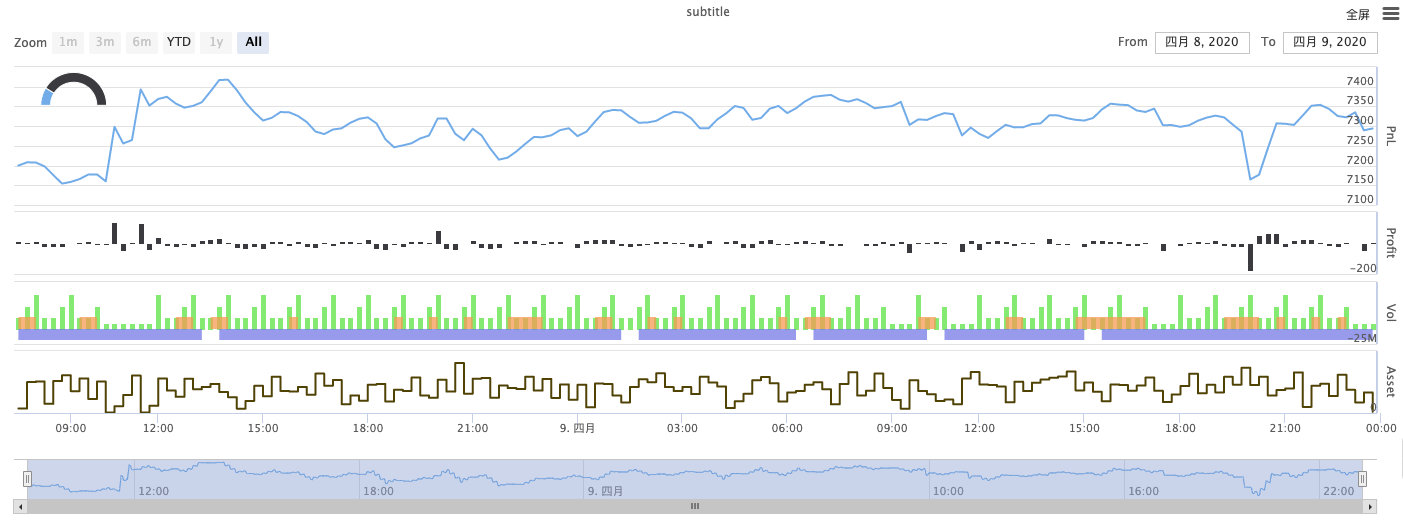
혼합 그래프의 복잡한 예
저자:제로, 날짜: 2020-04-11 12:15:25태그:그래프
더 많은 요구 사항은 직접 문의하십시오.하이차트 공식또는하이차트 제3자 중국어 문서

/*backtest
start: 2020-03-11 00:00:00
end: 2020-04-09 23:59:00
period: 1d
exchanges: [{"eid":"Bitfinex","currency":"BTC_USD"}]
*/

var chartCfg = {
    subtitle: {
        text: "subtitle",
    },
    yAxis: [{
        height: "40%",
        lineWidth: 2,
        title: {
            text: 'PnL',
        },
        tickPixelInterval: 20,
        minorGridLineWidth: 1,
        minorTickWidth: 0,
        opposite: true,
        labels: {
            align: "right",
            x: -3,
        }
    }, {
        title: {
            text: 'Profit',
        },
        top: "42%",
        height: "18%",
        offset: 0,
        lineWidth: 2
    }, {
        title: {
            text: 'Vol',
        },
        top: '62%',
        height: '18%',
        offset: 0,
        lineWidth: 2
    }, {
        title: {
            text: 'Asset',
        },
        top: '82%',
        height: '18%',
        offset: 0,
        lineWidth: 2
    }],
    series: [{
        name: 'PnL',
        data: [],
        id: 'primary',
        tooltip: {
            xDateFormat: '%Y-%m-%d %H:%M:%S'
        },
        yAxis: 0
    }, {
        type: 'column',
        lineWidth: 2,
        name: 'Profit',
        data: [],
        yAxis: 1,
    }, {
        type: 'column',
        name: 'Trade',
        data: [],
        yAxis: 2
    }, {
        type: 'area',
        step: true,
        lineWidth: 0,
        name: 'Long',
        data: [],
        yAxis: 2
    }, {
        type: 'area',
        step: true,
        lineWidth: 0,
        name: 'Short',
        data: [],
        yAxis: 2
    }, {
        type: 'line',
        step: true,
        color: '#5b4b00',
        name: 'Asset',
        data: [],
        yAxis: 3
    }, {
        type: 'pie',
        innerSize: '70%',
        name: 'Random',
        data: [],
        center: ['3%', '6%'],
        size: '15%',
        dataLabels: {
            enabled: false
        },
        startAngle: -90,
        endAngle: 90,
    }],
};

function main() {
    let c = Chart(chartCfg);
    let preTicker = null;
    while (true) {
        let t = exchange.GetTicker();

        c.add(0, [t.Time, t.Last]); // PnL
        c.add(1, [t.Time, preTicker ? t.Last - preTicker.Last : 0]); // profit
        let r = Math.random();
        var pos = parseInt(t.Time/86400);
        c.add(2, [t.Time, pos/2]); // Vol
        c.add(3, [t.Time, r > 0.8 ? pos : null]); // Long
        c.add(4, [t.Time, r < 0.8 ? -pos : null]); // Short
        c.add(5, [t.Time, Math.random() * 100]); // Asset
        // update pie
        chartCfg.series[chartCfg.series.length-1].data = [
            ["A", Math.random()*100],
            ["B", Math.random()*100],
         ];
        c.update(chartCfg)
        preTicker = t;
    }
}
관련 내용
- 발명자 APP 그래프 테스트 전략
- 복잡한 디스크 차트 테스트 버전
- C++ 버전의 멀티 그래프 테스트
- 파이썬 버전 MACD 지표 도표 예제
- MACD 그래프 예제
- python 상태
테이블 버튼 예제 표시 - 멀티 그래프 예 (데이터는 csv와 같은 표로 다운로드 할 수 있습니다)
- 도형 클래스 라이브러리를 사용하여 도형 K줄과 평선 그래프 예제
- 여러 그래프를 테스트하여 Python 버전을 보여줍니다.
- 테이블 템플릿
더 많은 내용
- TradingViewWebHook 신호 실행 전략 (교육)
- 순차적으로 구매하고 판매하는 가격
- 비안 지속가능한 다화폐 헤지핑 전략 (多超跌做空超
) (장 총 파이썬 버전) - 슈퍼트렌드 전략 (교육)
- 3줄의 코드는 알고스 머신러닝을 구현하여 업계 뉴스를 빠르게 해석하는 반지개 전략을 구현합니다.
- 로컬 저장
- 동전 던지기 전략 (●'
'●) - 슈퍼트렌드 V1
신: 유동화율 전략 - 레코드 컬렉터 (교육)
- 초하수 초
초보 - 위키피디아: 위키피디아:
- 계약서
- 위안부 지속가능한 다화폐 헤지핑 전략 원본 (多超跌做空超
) 4월 13일 최신 중단 손실 모듈 - 비안 지속가능한 다화폐 헤지핑 전략 (무효 또는 다화폐 지수) 4월 10일 개선 버그, 업데이트가 필요합니다.
- MACD 하락 구매 하락 판매 자동 계정 슬라이드 중단
- 코스닥에 신화 첫 번째 로봇을 올립니다.
- 다중 플랫폼 헤지킹 안정 유리한 고리
- 일평선 트렌드 데모
- 해변
제로리테스트, 실제 디스크가 없습니다
조니최대 입력 값이 제한되어 있나요? 아래로 내려가면 하루 최대 데이터를 표시할 수 있습니다.
fmzero그래프에 커브/그라프의 표시와 숨김을 제어하는 API가 있는지