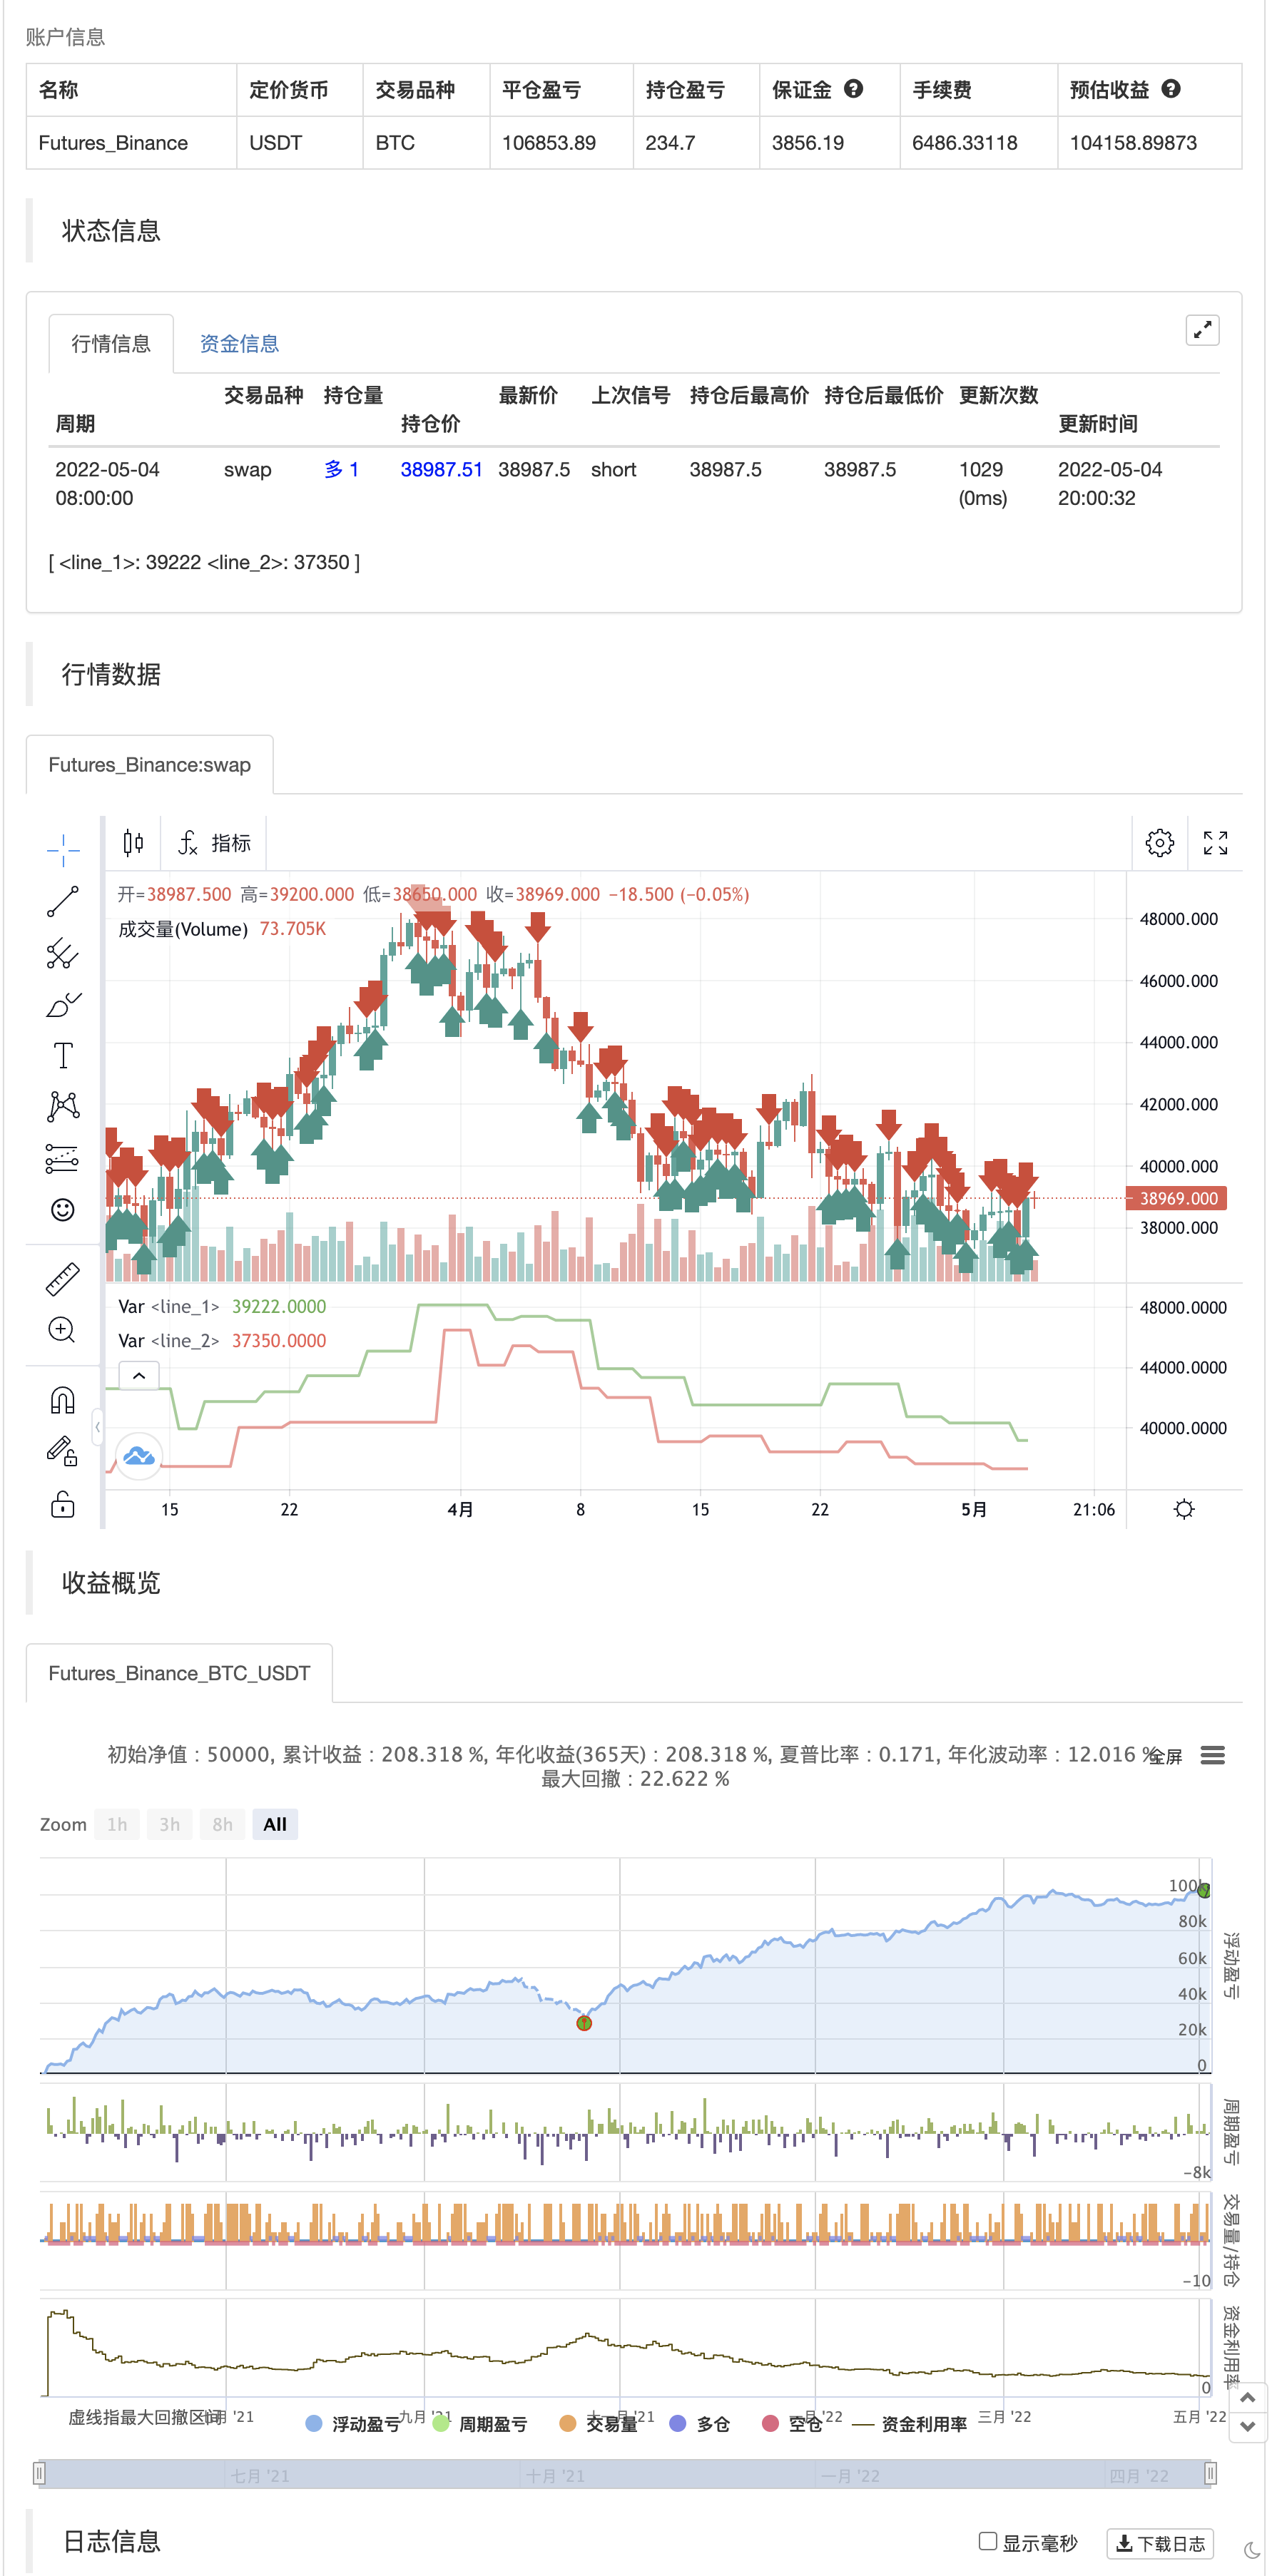
파인스크립트 전략의 월별 수익
저자:차오장, 날짜: 2022-05-06 23:19:37태그:피브
나는 트레이딩뷰에서 얻는 전략 성능 출력에서 100% 만족하지 않습니다. 종종 기본적으로 사용할 수 없는 것을보고 싶습니다. 나는 일반적으로 트레이딩뷰에서 원시 트레이드 / 메트릭을 수출하고 추가 분석을 수동으로 수행합니다. 하지만 테이블을 사용하면 전략에 대한 추가 측정값과 도구를 쉽게 만들 수 있습니다.
이 스크립트는 단지 스크립트의 월간/년간 성과와 테이블을 보여줄 것입니다. 꽤 많은 상인/투자자들이 그런 수익을 보곤 했습니다. 또한, 그것은 당신의 전략이 예상보다 잘/잘하지 않은 기간을 식별하고 더 잘 분석하려고 할 때 도움이 될 수 있습니다. 이 시나리오는 매우 간단합니다. 그리고 저는 여러분이 그것을 여러분의 전략에 쉽게 적용할 수 있다고 믿습니다.
면책 과거의 성과가 미래의 결과를 나타내는 것은 아니라는 것을 기억하십시오. 다양한 요인, 변화하는 시장 조건 등으로 인해 전략은 더 이상 역사적인 백트테스팅에서 잘 수행되지 않을 수 있습니다. 이 포스트와 시나리오는 어떤 재정적 조언도 제공하지 않습니다.
재검토

/*backtest
start: 2021-05-05 00:00:00
end: 2022-05-04 23:59:00
period: 12h
basePeriod: 15m
exchanges: [{"eid":"Futures_Binance","currency":"BTC_USDT"}]
*/

//@version=4
//strategy("Monthly Returns in PineScript Strategies", overlay = true, default_qty_type = strategy.percent_of_equity, default_qty_value = 25, calc_on_every_tick = true, commission_type = strategy.commission.percent, commission_value = 0.1)

// Inputs
leftBars  = input(2,"leftBars")
rightBars = input(2,"rightBars")
prec      = input(2, title = "Return Precision")

// Pivot Points
swh = pivothigh(leftBars, rightBars)
swl = pivotlow(leftBars, rightBars)

hprice = 0.0
hprice := not na(swh) ? swh : hprice[1]

lprice = 0.0
lprice := not na(swl) ? swl : lprice[1]

le = false
le := not na(swh) ? true : (le[1] and high > hprice ? false : le[1])

se = false
se := not na(swl) ? true : (se[1] and low < lprice ? false : se[1])

if (le)
	strategy.entry("PivRevLE", strategy.long, comment="PivRevLE")

if (se)
	strategy.entry("PivRevSE", strategy.short, comment="PivRevSE")

plot(hprice, color = color.green, linewidth = 2)
plot(lprice, color = color.red,   linewidth = 2)
관련 내용
- 플리퍼 파드 모델과 윌리엄 지표가 결합된 멀티 타임 사이클 거래 전략
- 동적 지원 저항과 브린 벨트 멀티 지표 횡단 전략
- 동적 지원 저항 축은 양적 거래 전략에 적응합니다
- RSI 격차 지표
- 피브 트렌드
- 부피 분차
- 피보트 기반 후속 최대 & 최소
- 피브 포인트 슈퍼트렌드
- 회전점 높은 낮은 멀티 시간 프레임
- 빌라 다이내믹 피보트 슈퍼트렌드 전략
- 회전 순서 블록
더 많은 내용