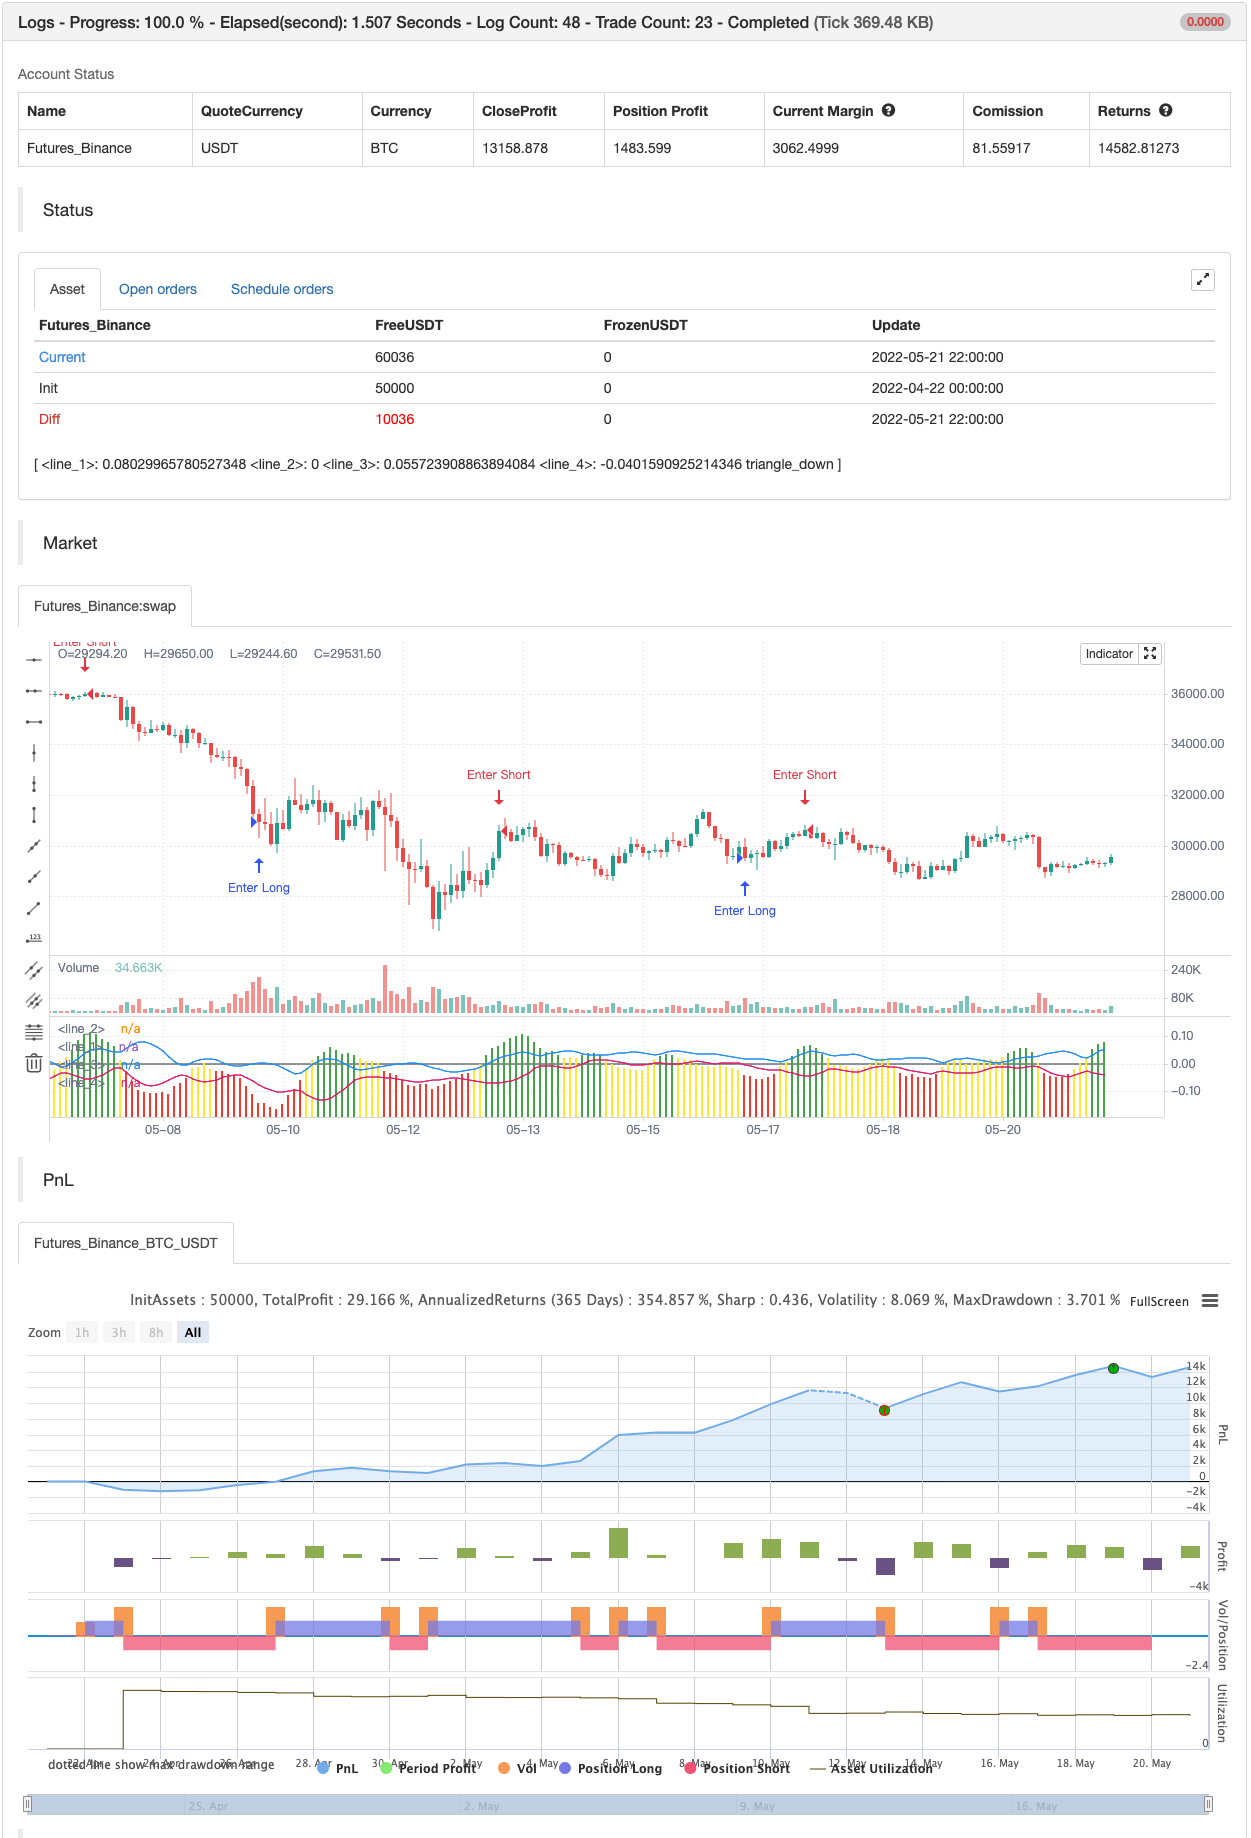
논 엔트로피 V2
저자:차오장, 날짜: 2022-05-23 15:07:54태그:stdevWMA
버전 2,
여기서는 가격과 부피 정보를 보는 독특한 방법이 있습니다.
H = -sum(prob(i) * log_base2(prob(i)))
저는 분량 정보와 가격 정보의 차이라는 전형적인 실험 방법을 포함했습니다. 양쪽 값의
이 스크립트를 사용하는 것은

/*backtest
start: 2022-04-22 00:00:00
end: 2022-05-21 23:59:00
period: 2h
basePeriod: 15m
exchanges: [{"eid":"Futures_Binance","currency":"BTC_USDT"}]
*/

// This source code is subject to the terms of the Mozilla Public License 2.0 at https://mozilla.org/MPL/2.0/
// © kocurekc

//@version=4
//
// @author Kocurekc
// Rev-3, Added STDev bands and Precent Rank
// Rev-2, Shannon entropy
// Rev-1, new picture for moderators
// Rev-0, added colors, flipped delta to clean up view
//
// Live a little, publish your scripts...be a John Elhers
//

study(title="Shannon Entropy V2", shorttitle="Info-S", precision=2)
src = input(close, title="source", type=input.source)
len = input(9, title="Entropy Length", type=input.integer)
range = input(0.025, title="color level", type=input.float)
avg = input(44, title="Averaging Length", type=input.integer)
vPR = input(2, title="Percent Rank Limit", type=input.integer)
bc = input(true, title="Include Source", type=input.bool)
vc = input(true, title="Include Volume", type=input.bool)
pb = input(true, title="Print Bands", type=input.bool)

//Shannon Entropy, for source (close) or for Volume or both
cr = src/sum(src,len)
vr = log(volume)/sum(log(volume),len)
info = ((vc ? sum(vr*log10(vr)/log10(2),len) : 0) - (bc ? vc ? sum(cr*log10(cr)/log10(2),len) : sum(cr*log10(cr)/log10(2),len) : 0))

//coloring for Shannon Entropy using both source and volume
hc1 = info > range ? #4caf50 : info > range * -1 ? #ffeb3b : info <= range * -1 ? #f44336 : na

//Plotting
plot(info, style=(bc and vc ? plot.style_columns :plot.style_line ), color=hc1 )
plot((bc and vc ? 0 : na), color=color.gray)


//Top/Bottom STDev
value = wma(info,avg)
top = value+stdev(info,len)
btm = value-stdev(info,len)
plot(pb ? top:na)
plot(pb ? btm:na)

//Percent Rank and ploting
hvp = percentrank(info,avg)
plotshape(hvp>(100-vPR) ? info : na, location=location.absolute, style=shape.triangledown, color=color.red, size=size.tiny, transp=30, offset=0)
plotshape(hvp<vPR ? info : na, location=location.absolute, style=shape.triangleup, color=color.green, size=size.tiny, transp=30, offset=0)

if hvp<vPR
    strategy.entry("Enter Long", strategy.long)
else if hvp>(100-vPR)
    strategy.entry("Enter Short", strategy.short)
관련 내용
- 보링거 유동량 돌파구에 기반한 적응 추세 추적 거래 전략
- 브라마스트라
- 가벼운 물류
- jma + dwma 다 곡물
- 낮은 스캐너 전략 암호화
- 윌리엄스 %R - 부드럽다
- 헬스 이동 평균 스윙 트레이더
- 부피 분차
- 슈퍼B
- BB-RSI-ADX 입구점
더 많은 내용
- 상대적 강도 지수 - 격차 - 자유
- 선형 회귀 ++
- 에너지 바와 함께 레드K 듀얼 바더
- 통합 구역 - 라이브
- 양적 질적 평가
- 이동 평균 크로스 알림, 다중 시간 프레임 (MTF)
- MACD 재충전 전략
- 슈퍼트렌드 이동 평균
- 거래 ABC
- 15MIN BTCUSDTPERP BOT
- 수퍼트렌드 ATR TRAILING STOP LOSS
- 부피 흐름 v3
- ma & rsi - ogcheckers와 함께 암호화 선물 시간 스칼핑
- ATR 평평화
- 주문 블록 검색어
- 트렌드 스칼프-프랙탈박스-3EMA
- QQE 신호
- U비트 격자 팽창 필터링
- CM MACD 사용자 지정 지표 - 여러 시간 프레임 - V2
- HODL 라인