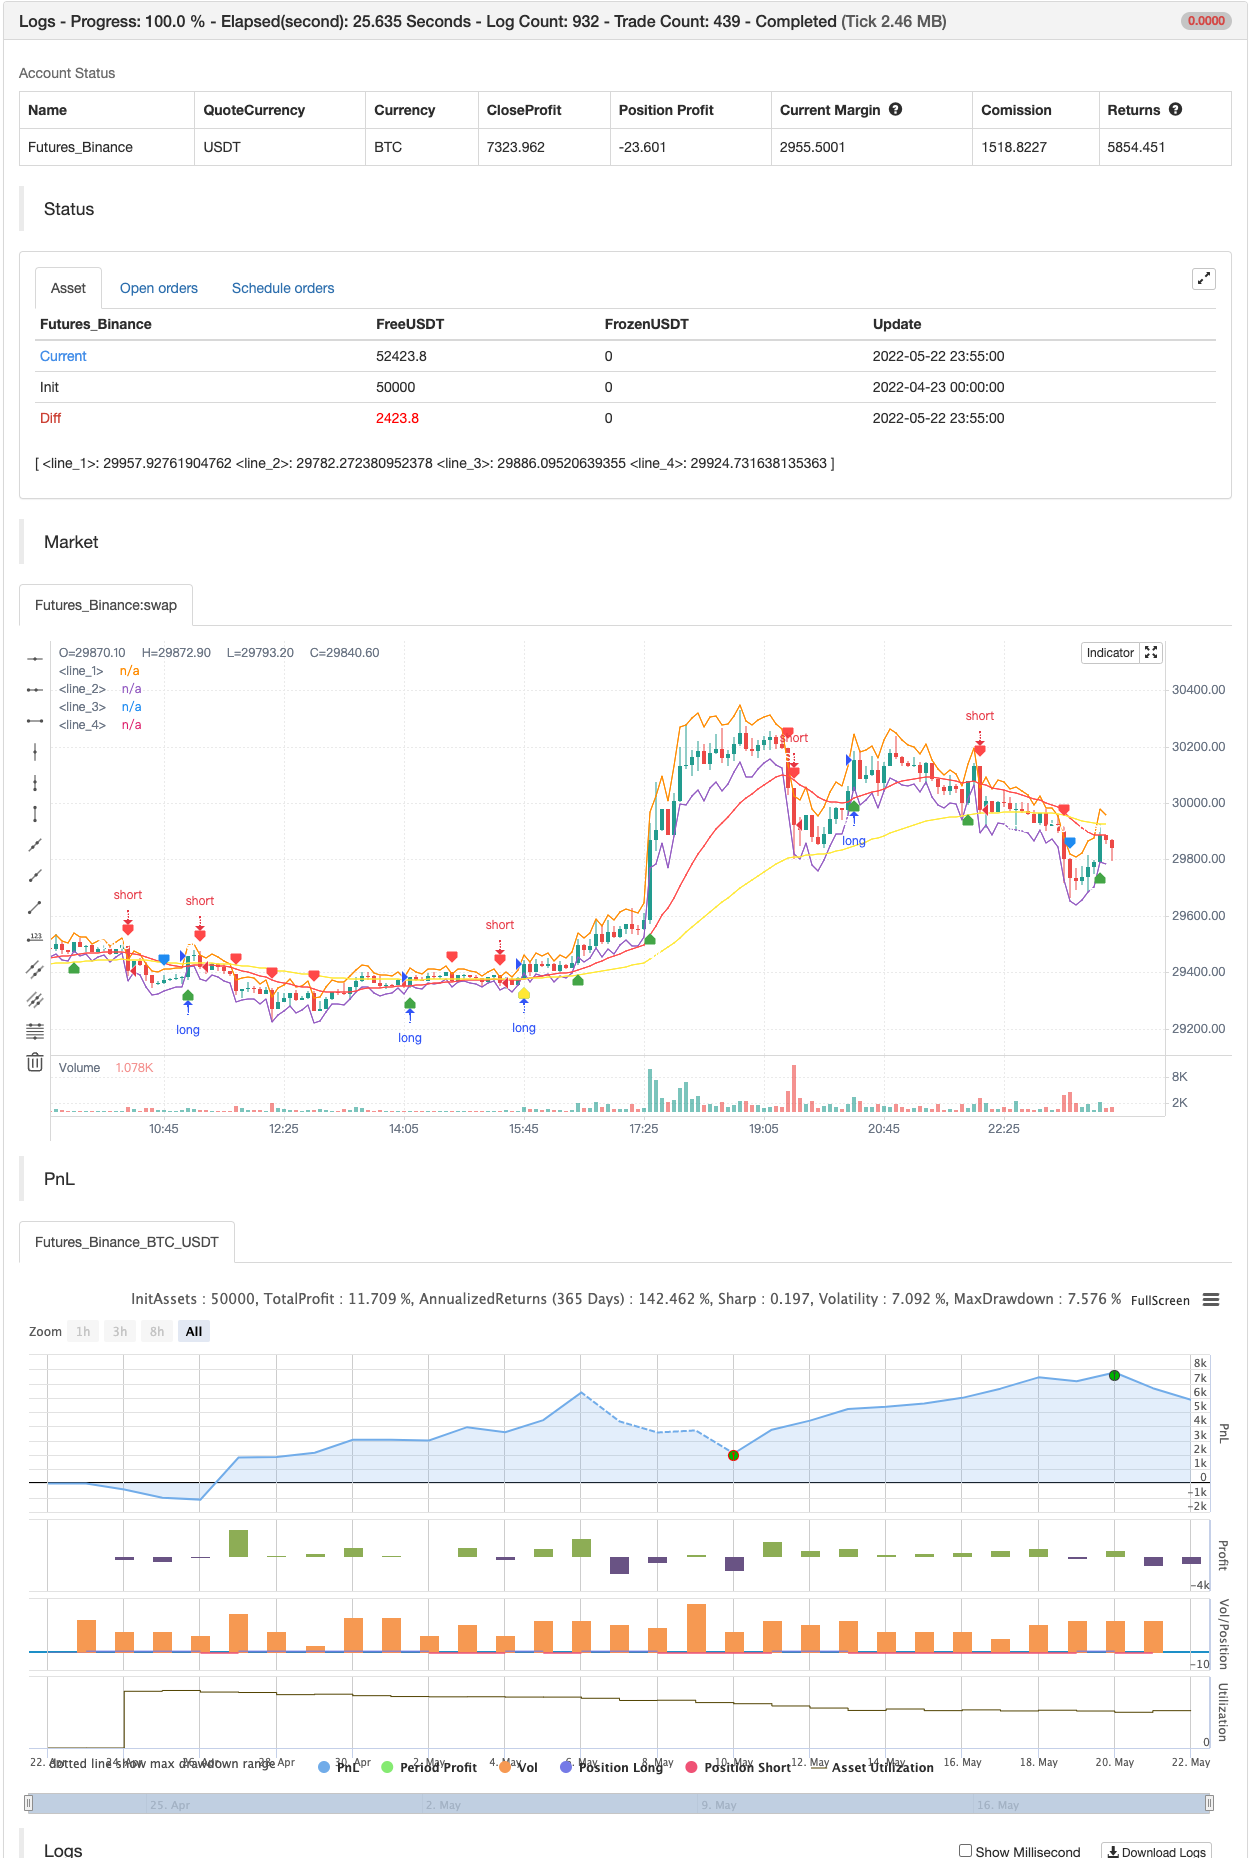
슈퍼 스칼퍼 - 5분 15분
저자:차오장, 날짜: 2022-05-24 16:20:58태그:RMASMAEMAWMARSIATR
이 전략은 RSI와 ATR 밴드를 기반으로 5와 15 분 시간 프레임에서 더 잘 작동합니다. 실시간으로 사용하기 전에 1: 2R로 충분한 백 테스트를 수행하십시오.
스크린 기호에서 거래에 대한 입력만, 추가 구매/판매 알림을 사용하여 수익을 기록하거나 SL를 추적합니다.
또한 65의 골든 크로스 오버와 21의 EMA를 추가했습니다.
백테스트

/*backtest
start: 2022-04-23 00:00:00
end: 2022-05-22 23:59:00
period: 5m
basePeriod: 1m
exchanges: [{"eid":"Futures_Binance","currency":"BTC_USDT"}]
*/

//@version=5
//Revision: Updated script to pine script version 5
//added Double RSI for Long/Short prosition trend confirmation instead of single RSI
strategy("Super Scalper - 5 Min 15 Min", overlay=true)
source = close
atrlen = input.int(14, "ATR Period")
mult = input.float(1, "ATR Multi", step=0.1)
smoothing = input.string(title="ATR Smoothing", defval="WMA", options=["RMA", "SMA", "EMA", "WMA"])
ma_function(source, atrlen) =>
    if smoothing == "RMA"
        ta.rma(source, atrlen)
    else
        if smoothing == "SMA"
            ta.sma(source, atrlen)
        else
            if smoothing == "EMA"
                ta.ema(source, atrlen)
            else
                ta.wma(source, atrlen)
atr_slen = ma_function(ta.tr(true), atrlen)
upper_band = atr_slen * mult + close
lower_band = close - atr_slen * mult

// Create Indicator's
ShortEMAlen = input.int(21, "Fast EMA")
LongEMAlen = input.int(65, "Slow EMA")
shortSMA = ta.ema(close, ShortEMAlen)
longSMA = ta.ema(close, LongEMAlen)
RSILen1 = input.int(25, "Fast RSI Length")
RSILen2 = input.int(100, "Slow RSI Length")
rsi1 = ta.rsi(close, RSILen1)
rsi2 = ta.rsi(close, RSILen2)
atr = ta.atr(atrlen)


//RSI Cross condition
RSILong = rsi1 > rsi2
RSIShort = rsi1 < rsi2

// Specify  conditions
longCondition = open < lower_band
shortCondition = open > upper_band
GoldenLong = ta.crossover(shortSMA,longSMA)
Goldenshort = ta.crossover(longSMA,shortSMA)

plotshape(shortCondition, title="Sell Label", text="Sell", location=location.abovebar, style=shape.labeldown, size=size.tiny, color=color.red, textcolor=color.white, transp=0)
plotshape(longCondition, title="Buy Label", text="Buy", location=location.belowbar, style=shape.labelup, size=size.tiny, color=color.green, textcolor=color.white, transp=0)
plotshape(Goldenshort, title="Golden Sell Label", text="Golden Crossover Short", location=location.abovebar, style=shape.labeldown, size=size.tiny, color=color.blue, textcolor=color.white, transp=0)
plotshape(GoldenLong, title="Golden Buy Label", text="Golden Crossover Long", location=location.belowbar, style=shape.labelup, size=size.tiny, color=color.yellow, textcolor=color.white, transp=0)
// Execute trade if condition is True
if (longCondition)
    stopLoss = low - atr * 2
    takeProfit = high + atr * 5
    strategy.entry("long", strategy.long, when = RSILong)


if (shortCondition)
    stopLoss = high + atr * 2
    takeProfit = low - atr * 5
    strategy.entry("short", strategy.short, when = RSIShort)


// Plot ATR bands to chart

////ATR Up/Low Bands

plot(upper_band)
plot(lower_band)

// Plot Moving Averages
plot(shortSMA, color = color.red)
plot(longSMA, color = color.yellow)
관련 내용
- 멀티 슬라이드 오브라인 다이내믹 크로스 트렌드 추적 및 멀티 확인 양적 거래 전략
- 슈퍼 스칼퍼
- ESSMA
- 슈퍼 점프 턴 백 볼링거 밴드
- 구매/판매로 EMA ADX RSI를 스칼핑
- VAWSI와 트렌드 지속적 역전 전략이 결합된 동적 길이를 계산하는 다지표 통합 분석 시스템
- 다일리얼 크로스 보조 RSI 동적 매개 변수 정량화 거래 전략
- 동적 RSI 스마트 선택 시간파운드 거래 전략
- SSL 하이브리드
- 다중 지표 동적 자율 조정 ATR 변동률 전략
더 많은 내용
- 스토카스틱 + RSI, 이중 전략
- 스윙 헐/rsi/EMA 전략
- 스칼핑 스윙 거래 도구 R1-4
- 가장 좋은 삼키기 + 탈출 전략
- Bollinger Awesome 알렛 R1
- 다중 거래소 통합 플러그인
- 삼각수당 (작은 통화의 거래 가격 차이)
- bybit 역계약 동적 격자 (特異格子)
- MT4 MT5 + 동적 변수 NOT-REPAINT
- 매트릭스 시리즈
- 상대적 강도 지수 - 격차 - 자유
- 선형 회귀 ++
- 에너지 바와 함께 레드K 듀얼 바더
- 통합 구역 - 라이브
- 양적 질적 평가
- 이동 평균 크로스 알림, 다중 시간 프레임 (MTF)
- MACD 재충전 전략
- 슈퍼트렌드 이동 평균
- 거래 ABC
- 15MIN BTCUSDTPERP BOT