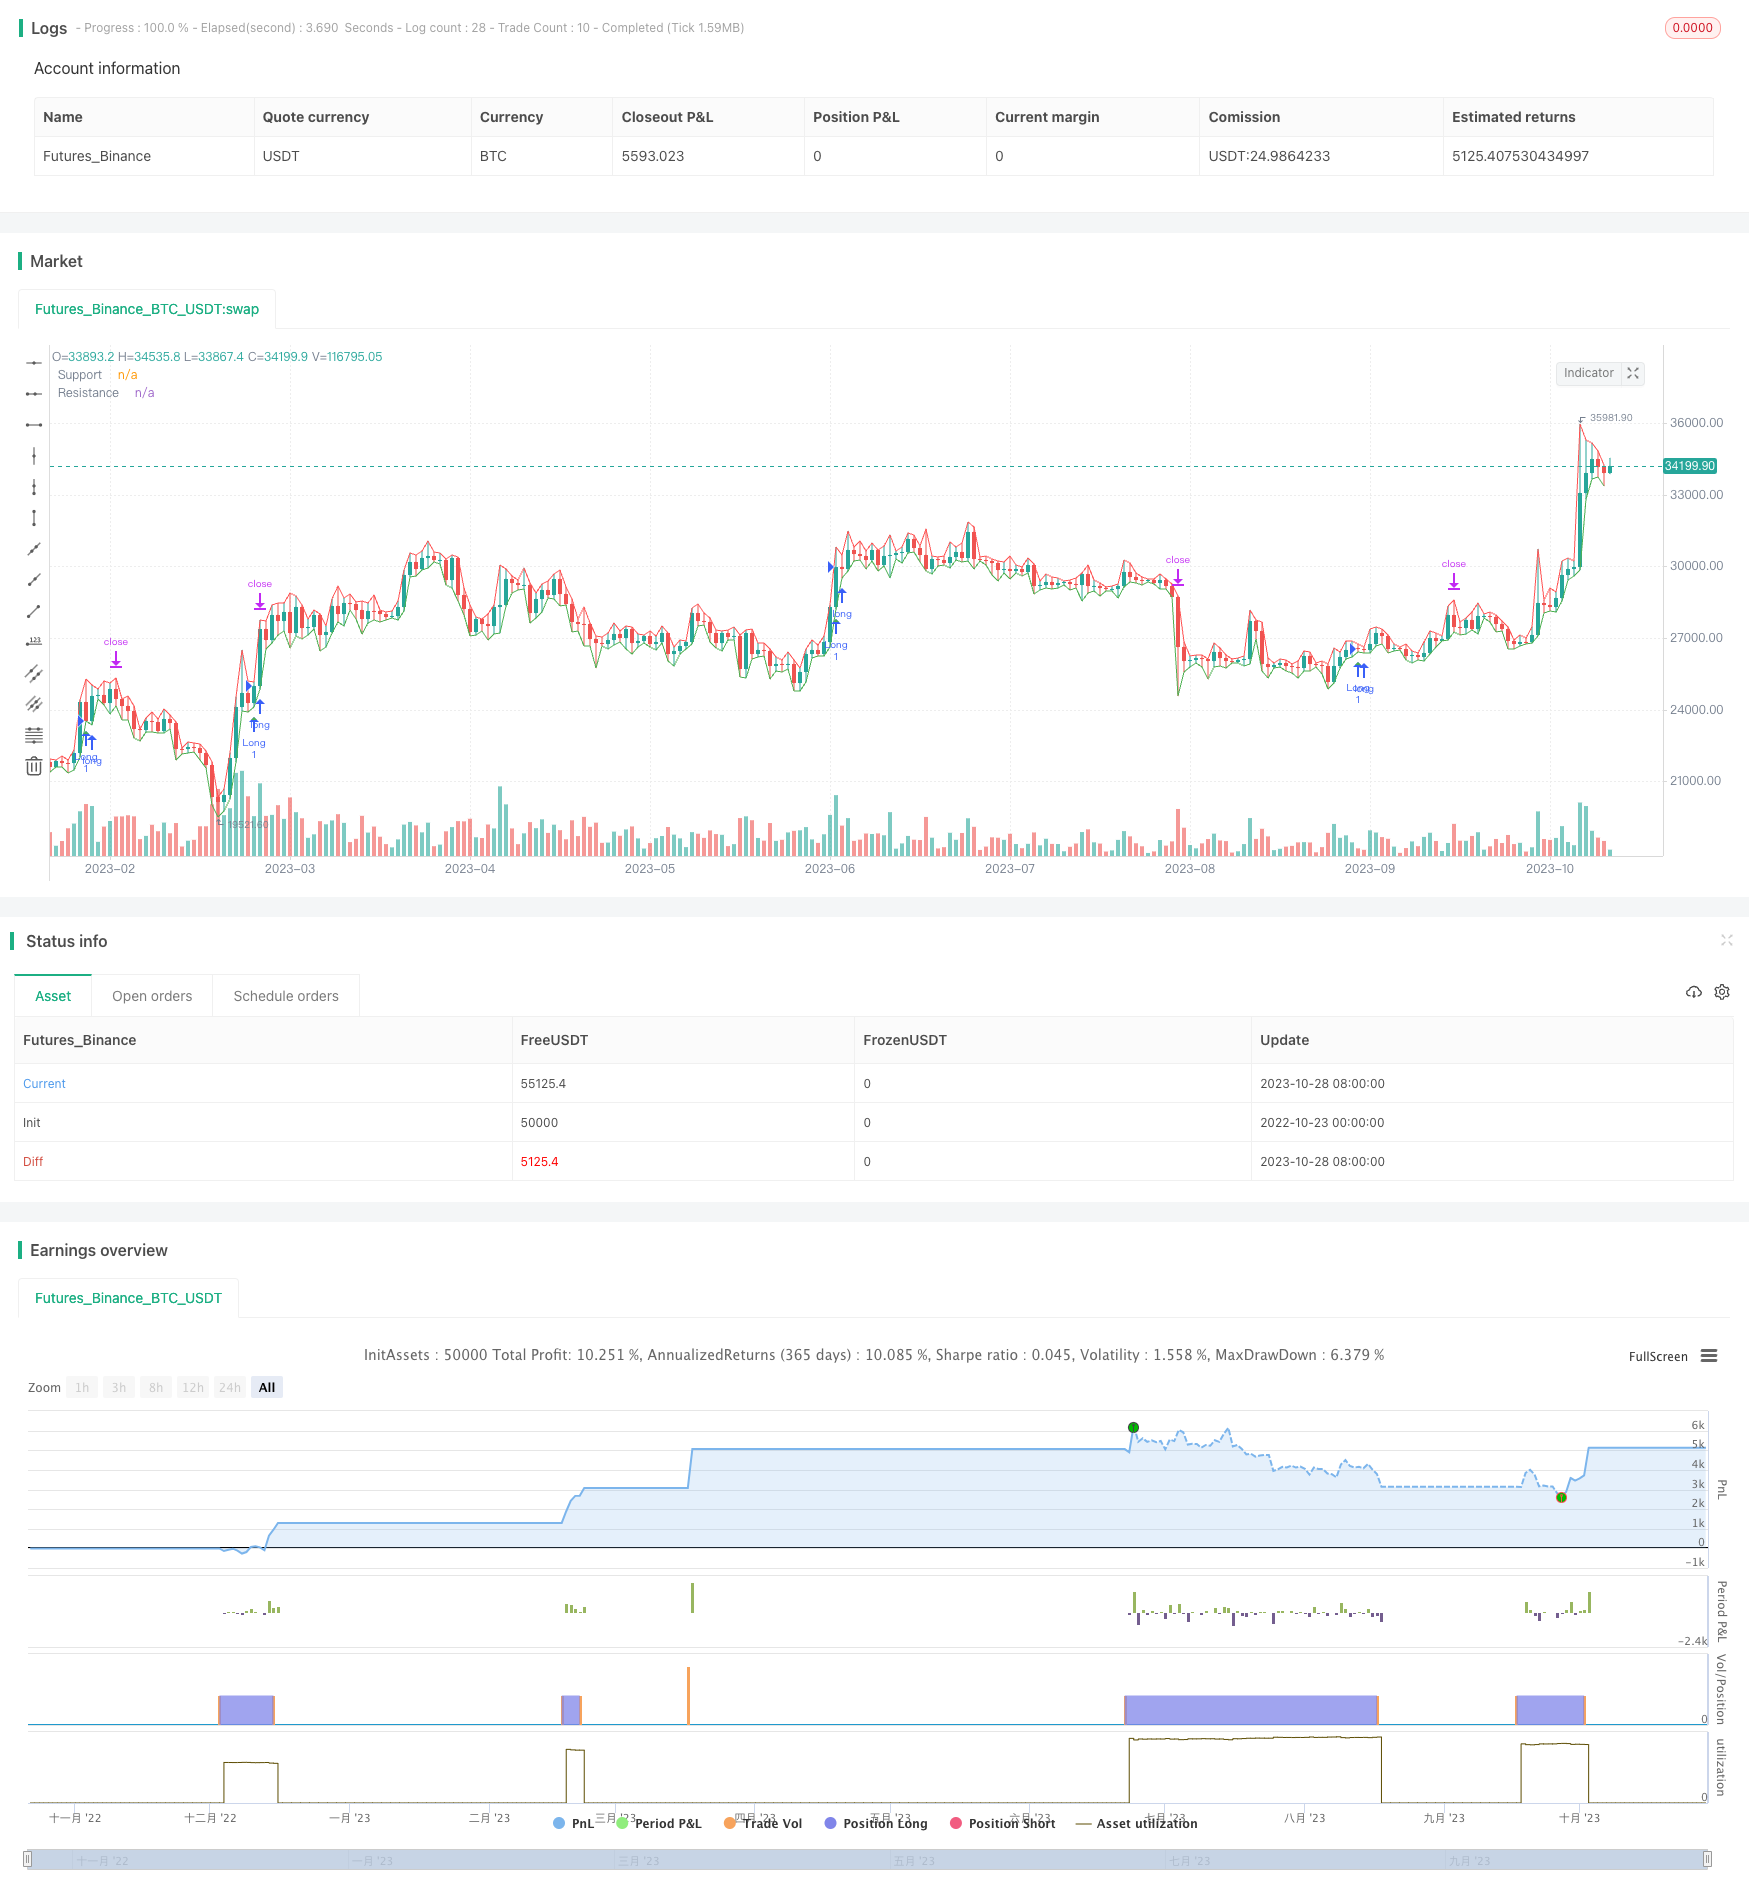
개요
이 전략은 가격 상황의 지원 저항 분석과 MACD 지표의 추세 분석을 결합하여, 추세 방향이 확인된 전제 하에서 핵심 지원 저항 영역에서 낮은 위험의 긴 선을 수행하여, 스톱 로드 가격보다 큰 이익을 얻으려는 목표를 달성합니다.
전략 원칙
Price Action - Support & Resistance by DGT 지표에 의해 중요한 지원 및 저항 수준을 식별한다. 이 지표는 가격 행태를 판단하는 지원 및 저항을 기반으로 한다. 이 수준은 일반적으로 가격 반전 또는 조정이 가능한 잠재적인 지역이다.
지표가 지지/저항 수준을 확인한 후, 이러한 수준 근처의 역사적 가격 행동을 분석하여 지지/저항의 강도를 확인하는 것이 필요합니다. 여러 번 접촉하거나 반발하는 수준은 그 수준이 더 강한 지지/저항 효과를 나타냅니다.
MACD 지표가 추가되어 MACD 라인과 신호 라인, 그리고 그 둘 사이의 차이의 히스토그램으로 구성됩니다. MACD는 트렌드 및 잠재적인 트렌드 반전을 식별 할 수 있습니다. MACD 라인이 신호 라인을 통과하고 히스토그램이 긍정적 인 경우, 황소 시장 추세가 형성 될 것으로 예상됩니다.
Price Action - Support & Resistance by DGT 지표에서 확인된 지지점과 MACD 지표에서 확인된 트렌드 방향의 결합으로 거래 기회를 찾을 수 있습니다:
- 다면 거래: 가격이 강력한 지원에 가까워질 때 MACD 라인이 신호 라인을 통과하고 히스토그램이 긍정적이라면 다면 추세가 형성될 것으로 예상되며, 지원 부위 근처에서 더 많이하고, 지지 부위 아래에 스톱 손실 라인을 설정합니다.
거래에 진입한 후, 진입 지점과 가장 가까운 중요한 지지 또는 저항 사이의 거리에 따라 수익 목표를 설정할 수 있으며, 모바일 스톱 또는 다른 위험 관리 기술을 사용하여 수익을 고정하고 위험을 제어 할 수 있습니다.
우위 분석
- 이러한 거래 지역은 지지를 저항하는 중요한 반전 지역을 사용하여 위험도가 낮습니다.
- MACD를 사용하여 트렌드 방향을 판단하고, 트렌드가 확인된 경우에만 거래하고, 역동적인 거래를 피합니다.
- 지탱지 근처에서 더 많이 하고, 손해를 막고, 위험을 통제할 수 있다
- 목표 수익률이 높고, 손실을 상회하는 수익률이 기대됩니다.
- 지원 저항과 MACD는 상호 검증 가능한 신호로 성공률을 높인다.
위험 분석
- 지원 저항이 뚫릴 수 있으며, 이후의 가격 움직임에 주의를 기울여야 합니다.
- MACD는 지연되어서 잘못된 판단이 발생할 수 있습니다.
- 단독 중단 위험의 통제가 필요하며, 단축 손실이 유발될 가능성이 있습니다.
- 이윤 목표가 합리적으로 설정되어 있는지에 대한 관심이 필요합니다. 너무 급진적이면 실현되지 않을 수 있습니다.
- 잘못된 신호를 피하기 위해 신호에 주의를 기울이고 확인해야 합니다.
위험을 해결하기 위한 해결책:
- 지지를 받는 저항을 뚫기 위해서는 적시에 상쇄 또는 역거래를 해야 합니다.
- MACD 신호를 판단할 때 신중을 기하고, 가격과 결합하여 사용하며, 신호를 검증한다.
- 1~2%의 단독 중지 리스크를 제어하여 과대 손실을 방지합니다.
- 수익 목표 설정은 너무 과격하지 말고 적절히 축소할 수 있습니다.
- “모든 신호가 확인될 때까지 기다려야 한다”
최적화 방향
- 다양한 변수 아래의 지원 저항 지표의 효과를 테스트할 수 있다
- MACD의 매개 변수를 최적화하여 더 정확한 MACD 신호를 얻을 수 있습니다.
- RSI와 같은 다른 지표와 함께 신호 검증을 할 수 있습니다.
- 부린 밴드 같은 지표들을 연구하여 스톱 및 스톱을 설정할 수 있습니다.
- 이윤을 더 잘 고정하기 위해 자동 이동 중지 기능이 추가됩니다.
- 다양한 품종에 대한 파라미터를 최적화할 수 있다
- 특정 스톱 매개 변수를 재측정하여 최적화할 수 있습니다.
요약하다
이 전략은 트렌드 판단과 핵심 지역 거래 방법을 통합한다. 확인된 트렌드 방향을 얻은 후, 위험 제어 가능한 지지 지역을 선택하여 손실을 초과하는 큰 이익을 얻기 위해 낮은 위험으로 작동한다. 이 긴 라인 운영 모드는 적은 거래 수만 필요하면 안정적인 수익을 얻을 수 있다. 물론, 어떤 전략도 손실을 완전히 피할 수 없으며 손실을 제어하기 위해 엄격한 위험 관리 조치를 취해야합니다.
/*backtest
start: 2022-10-23 00:00:00
end: 2023-10-29 00:00:00
period: 1d
basePeriod: 1h
exchanges: [{"eid":"Futures_Binance","currency":"BTC_USDT"}]
*/

//@version=4
strategy("Price Action - Support & Resistance + MACD Strategy", overlay=true)

// Price Action - Support & Resistance
supportLevel = input(100, title="Support Level Strength", minval=1)
resistanceLevel = input(100, title="Resistance Level Strength", minval=1)

var supportPrice = 0.0
var resistancePrice = 0.0

if low <= supportPrice or barstate.islast
    supportPrice := low
if high >= resistancePrice or barstate.islast
    resistancePrice := high

plot(supportPrice, color=color.green, linewidth=1, title="Support")
plot(resistancePrice, color=color.red, linewidth=1, title="Resistance")

// MACD Indicator
[macdLine, signalLine, _] = macd(close, 26, 100, 9)
macdHistogram = macdLine - signalLine

// Bullish Trade Setup
bullishSetup = crossover(macdLine, signalLine) and macdHistogram > 0 and close > supportPrice
plotshape(bullishSetup, color=color.green, title="Bullish Setup", style=shape.triangleup, location=location.belowbar)

// Stop Loss and Take Profit Levels
stopLossLevel = input(5, title="Stop Loss Level (%)", minval=0.1, step=0.1)
takeProfitLevel = input(7.5, title="Take Profit Level (%)", minval=0.1, step=0.1)

// Execute Long Trades
if bullishSetup
    stopLossPrice = close * (1 - stopLossLevel / 100)
    takeProfitPrice = close * (1 + takeProfitLevel / 100)
    strategy.entry("Long", strategy.long)
    strategy.exit("Exit", "Long", stop=stopLossPrice, limit=takeProfitPrice)