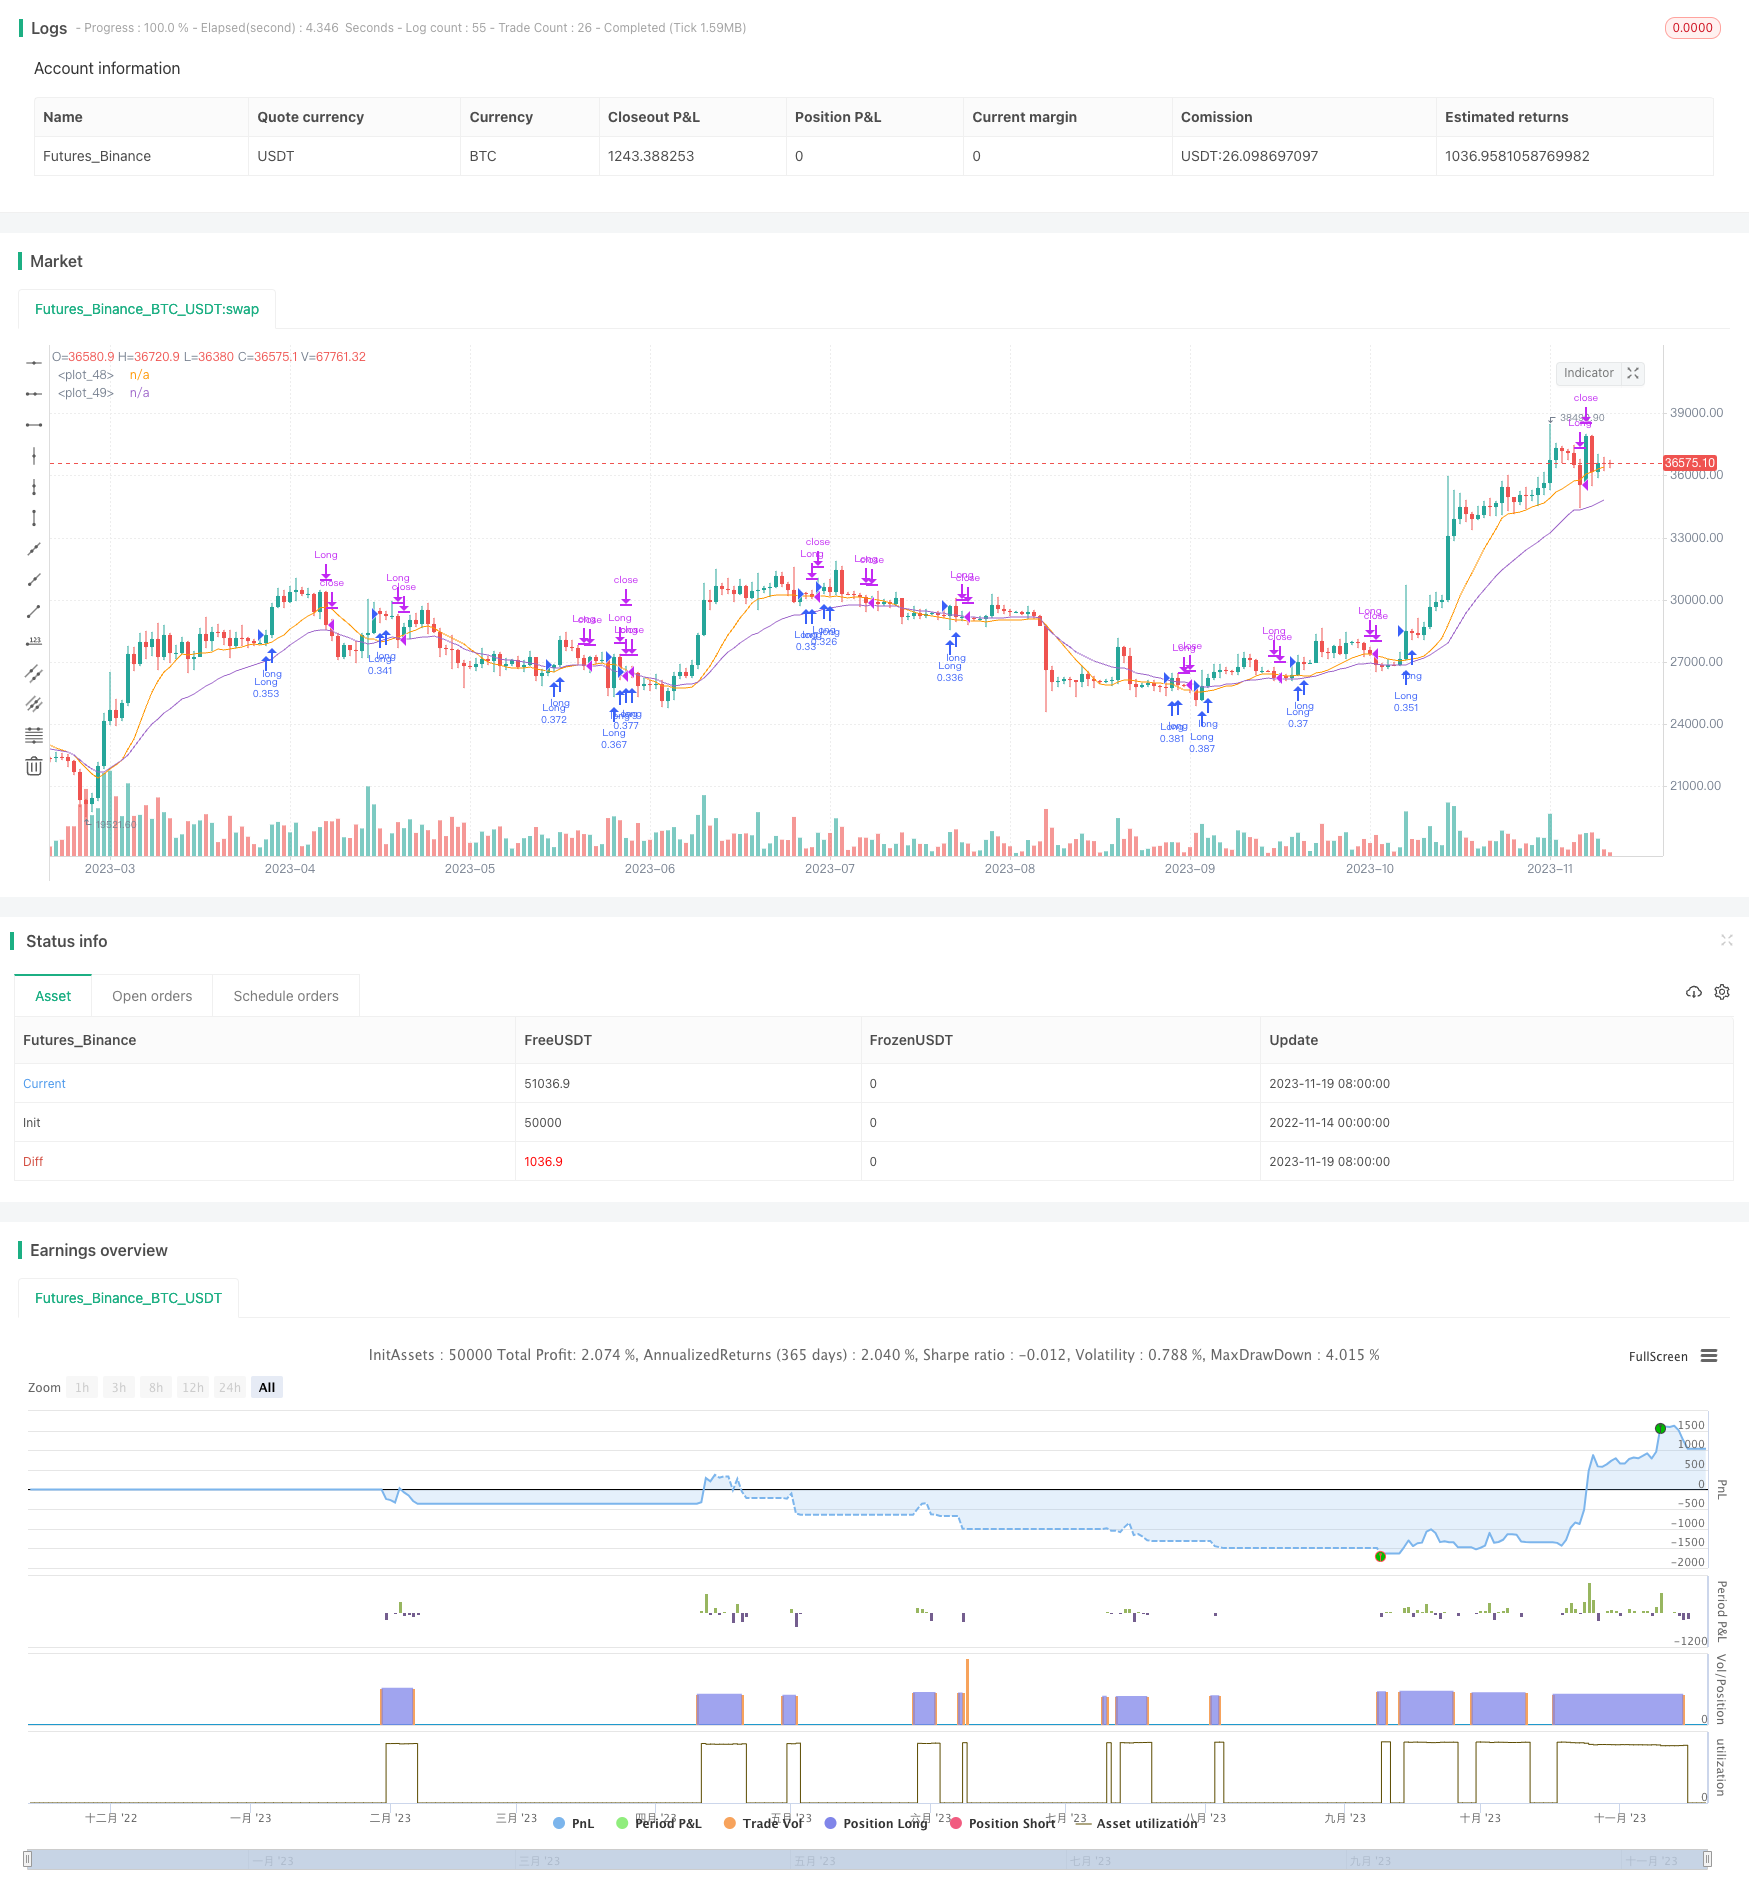
개요
이것은 무작위 RSI, EMA, 그리고 VMACD를 결합한 전략으로, 시장의 반전점을 식별하기 위해 사용되며, 하향 추세가 반전될 때 가장 잘 작동한다.
전략 원칙
이 전략은 주로 다음과 같은 몇 가지 지표의 조합을 기반으로 합니다.
- 무작위 RSI ((random index smooth moving averages): 과매매 현상을 식별하기 위한
- EMA (지수 이동 평균) 빠른 선과 느린 선의 교차: 추세와 가능한 역전 판단
- VMACD ((량 가중 MACD): 역전 신호를 확인하는 데 사용됩니다
무작위 RSI가 oversold 영역에서 반등하고, EM 단선에서 느린 선을 통과하고, VMACD도 상승하기 시작하면, 구매 신호가 생성됩니다. 또한, 단기 가격이 10주기의 SMA를 돌파하면, 보조 신호로 구매가 생성됩니다.
이 전략은 실시간으로 이러한 지표의 변화를 추적하고, 일정 길이 이후의 SMA, EMA 등의 정보를 계산한다. 구매 조건이 유발되면, 고정된 수의 계약을 사용하여 구매 포지션을 개시한다. 이후 5%의 회수 또는 SMA 라인 아래에 위치하는 경우, 상쇄 상쇄된다.
우위 분석
이 전략은 여러 지표를 결합하여 시장의 역전 기회를 효과적으로 식별할 수 있습니다. 주요 장점은 다음과 같습니다:
- 무작위 RSI가 과매매하는 것을 식별하는 능력이 강합니다.
- EMA 교차 판단 역전 신호 정확도 높다
- VMACD는 가짜 신호를 효과적으로 필터링합니다.
- 다중 지표 조합, 신호 품질 향상
- 단기 SMA를 사용해서 손실을 막는 것이 합리적입니다.
종합적으로, 이 전략은 반전 신호를 효과적으로 잡을 수 있으며, 일정 수준으로 떨어지면 다단위 포지션을 구축하여 수익을 올릴 수 있다.
위험 분석
이 전략은 장점이 있지만, 위험도 있습니다.
- 시장이 뒤집히지 않고 계속 하락할 수 있는 시스템적 위험
- 여러 지표가 동시에 구매 조건을 유발할 확률이 낮을 때, 신호는 덜 생성됩니다.
- SMA 중지 손실은 너무 주관적일 수 있으며, 철회 제어 효과는 일반적입니다.
- 시장의 큰 흔들림은 고려되지 않았습니다.
위와 같은 위험들을 위해, 다음과 같은 방법으로 더 많은 최적화를 할 수 있습니다:
- 다른 역전 지표의 조합을 추가하여 효과를 높여줍니다.
- 시간적 제약과 금액적 제약이 결합된 방식
- 시장 상황을 판단하고, 불안한 상황에서 입장을 피하십시오.
- 너무 급진적인 스톱을 막기 위해 스톱 로직을 최적화
최적화 방향
이 전략은 다음과 같은 방향으로 더 개선될 수 있습니다.
- 더 많은 지표의 조합을 추가하여 지표 클러스터를 형성하고 신호 품질을 향상시킵니다.
- 대용량 자산의 특성에 따라 최적의 매개 변수를 선택하여 매개 변수를 최적화합니다.
- 과거 데이터 훈련에 따라 역전 가능성을 판단하는 기계 학습 알고리즘을 증가시킵니다.
- 재측정 시 슬라이드 포인트를 추가하여 실제 거래에 가까운 결과를 얻습니다.
- 더 부드럽고 합리적인 Stop Loss 전략의 최적화
- 트렌드 상태를 탐지하고, 흔들림과 트렌드 상황을 구분하고, 맹목적인 입장을 피하십시오.
요약하다
VRSI-EMA 교차와 VMACD 융합의 파동찾기 전략은 전체적으로 하락 반전 기회를 식별하는 좋은 전략이다. 그것은 여러 지표가 구매 신호를 형성하여 반전 시기를 효과적으로 판단 할 수 있다. 그러나 또한 최적화해야 할 방향이 있으며, 추가 개선으로 이 전략의 실전 성능은 더 뛰어나다. 그것은 여러 지표 융합이 범주화 된 전략의 전형적인 모범을 나타낸다.
/*backtest
start: 2022-11-14 00:00:00
end: 2023-11-20 00:00:00
period: 1d
basePeriod: 1h
exchanges: [{"eid":"Futures_Binance","currency":"BTC_USDT"}]
*/

//@version=3
strategy("Wavefinder+", overlay=true)
length = input(20)
confirmBars = input(2)
price = close

slow = input(12, "Short period")
fast = input(26, "Long period")
signal = input(9, "Smoothing period")


maFast = ema( volume * close, fast ) / ema( volume, fast )
maSlow = ema( volume * close, slow ) / ema( volume, slow )
da = maSlow - maFast
maSignal = ema( da, signal )
dm=da-maSignal


source = close
lengthRSI = input(14, minval=8), lengthStoch = input(14, minval=5)
smoothK = input(3,minval=3), smoothD = input(3,minval=3)
OverSold = input(25), OverBought = input(75)
rsi1 = rsi(source, lengthRSI)
rsi2= rsi(low, 20)
k = sma(stoch(rsi1, rsi1, rsi1, lengthStoch), smoothK)
d = sma(k, smoothD)
k1= sma(stoch(rsi2, rsi2, rsi2, lengthStoch), smoothK)
d1= sma(k1, smoothD)
delta=k-d1
ma = ema(low, length)
ema5= ema(price,20)
sma= sma(price,10)
bcond = price < ma
lcond = price> ema5
bcount = 0
lcount= 0
bcount := bcond ? nz(bcount[1]) + 1 : 0
lcount := lcond ? nz(lcount[1]) + 1 : 0

if (lcount>1 and change(k)>3 and k>d and k<55 and rising(dm,1)) or ( k[1]-k[2]<-2 and k-k[1]>5 and k>35 and k<80) or (ma-sma>0.05*sma and rising(sma,3) and rising(dm,2))
    strategy.entry("Long", strategy.long, qty=10000/close)

if (bcount == confirmBars)
    strategy.close("Long")
if close<0.99*sma
    strategy.close("Long")

plot(0.99*sma)
plot(ma)

//hline(OverSold,color=blue)
//hline(OverBought,color=blue)

//plot(d, color=red)
//plot(k, color=green,title="k-line")

//(close-close[3]<-0.05*close[3]) or (close-close[2]<-0.05*close[2]) or (close-close[2]<-0.05*close[2]) or (close-close[4]<-0.05*close[4]) or
//plot(strategy.equity, title="equity", color=red, linewidth=2, style=areabr)