갈릴레오 갈릴레이의 이동 평균 크로스오버 전략
저자:차오장, 날짜: 2023-12-18 12:07:07태그:

전반적인 설명
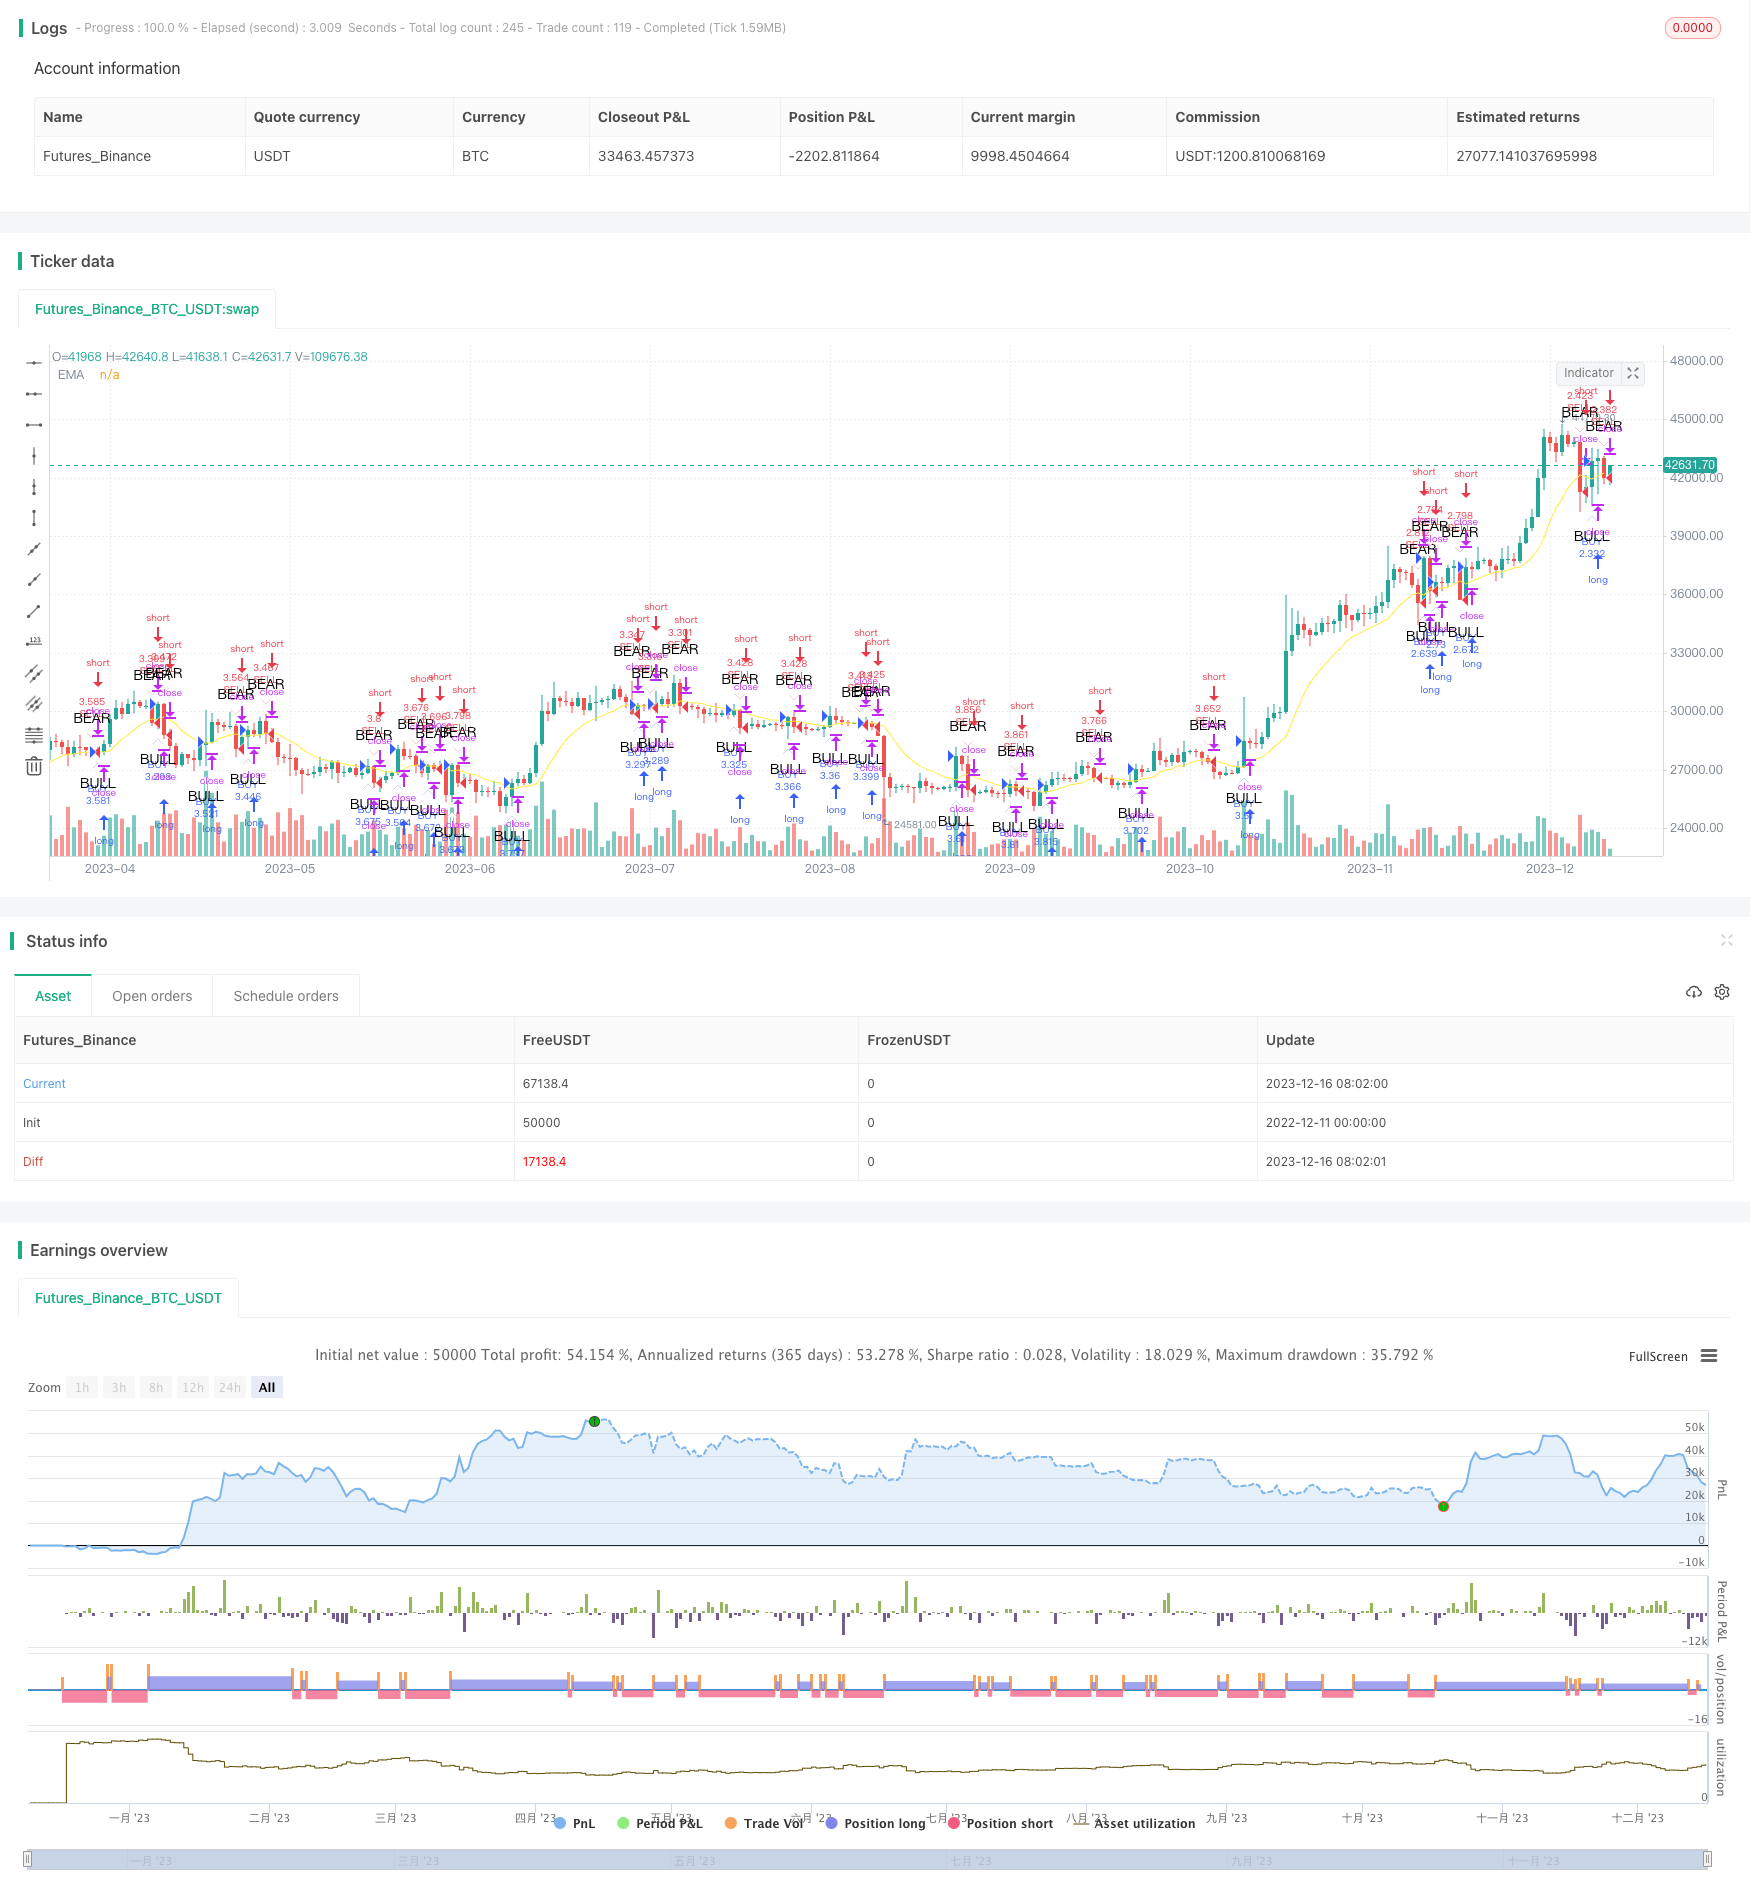
갈릴레오 갈릴레이의 이동 평균 크로스오버 전략은 이동 평균에 기반한 거래 전략이다. 특정 기간에 걸쳐 기하급수 이동 평균 (EMA) 을 계산하고 EMA와 가격 사이의 크로스오버를 비교하여 거래 신호를 생성한다. 가격은 상위에서 EMA 아래로 떨어지면 판매 신호가 생성되며, 가격이 아래에서 상향으로 EMA를 넘을 때 구매 신호가 발생한다.
전략 논리
갈릴레오 갈릴레이의 전략의 핵심은 기하급수적인 이동 평균 (EMA) 이다. EMA는 최근 가격에 더 많은 무게를 둔 이동 평균의 일종이다. 계산 공식은:
오늘 EMA = (오늘 종료 가격 × 평형 요인) + (어제 EMA × (1 − 평형 요인))
평형 인수 α = (2/(주기 수 + 1)
이 전략은 사용자 입력 기간 매개 변수에 기초하여 EMA를 동적으로 계산합니다. 다음에는 가격과 EMA 사이의 크로스오버를 비교하여 거래 신호를 결정합니다.
-
가격이 EMA 아래로 내려가면 상위에서 아래로 내려가면, 짧은 거래에 판매 신호가 생성됩니다.
-
가격이 아래에서 EMA를 넘을 때, 긴 거래에 대한 구매 신호가 발동됩니다.
이 전략은 또한 차트에 EMA 라인을 표시하고 사기와 판매 신호를 나타내는 화살표와 함께 표시합니다.
이점 분석
갈릴레오 갈릴레이의 이동 평균 크로스오버 전략은 다음과 같은 장점을 가지고 있습니다.
- 이해하기 쉽고 적용하기 쉬운 간단한 논리, 초보자에게 적합합니다.
- EMA를 이용함으로써 가격 변화에 더 빠르게 대응할 수 있습니다.
- 지나친 윙사 없이 명확한 크로스오버 신호.
- EMA 매개 변수를 조정함으로써 다른 시장 환경에 적응할 수 있는 유연성
- 정의된 출입 및 출입 신호는 위험 통제를 제공합니다.
위험 분석
이 전략의 잠재적 위험은 다음과 같습니다.
- 높은 가격 변동성 동안 더 많은 잘못된 신호가 발생할 수 있습니다. 스톱 로스 전략은 최적화에 도움이 될 수 있습니다.
- 단일 지표에 의존하는 것은 가격 조작에 취약하게 만듭니다. 추가 지표는 안정성을 향상시킬 수 있습니다.
- 특히 갑작스러운 사건 후에 EMA 기간을 줄이면 도움이 될 수 있습니다.
- 장기적인 일방적인 가격 추세에 적응할 수 없다는 것은 이동 평균 전략의 일반적인 한계입니다.
최적화 방향
전략을 최적화하는 몇 가지 방법:
-
거짓 신호에 대한 안정성을 높이기 위한 복합 전략을 구축하기 위해 다른 지표를 포함합니다. 예를 들어 볼륨, 트렌드 지표 등을 포함합니다.
-
단일 거래 손실 금액을 제어하기 위해 후속 스톱 손실 또는 퍼센트 기반 스톱 손실과 같은 스톱 손실 메커니즘을 추가하십시오.
-
최적의 설정을 찾기 위해 다른 매개 변수 조합으로 EMA를 테스트하십시오. 다른 이동 평균 유형도 평가 할 수 있습니다.
-
재입구 논리를 평가하여 초기 가격 반전 후 리바운드를 포착하여 수익성을 향상시킵니다.
결론
갈릴레오 갈릴레이의 이동 평균 크로스오버는 명확한 논리와 쉬운 조작성을 가진 간단하지만 실용적인 전략입니다. 초보자 양자 거래자에게 적합합니다. 지속적인 개선으로 시간이 지남에 따라 성능이 점점 더 우월해질 수 있습니다.
/*backtest
start: 2022-12-11 00:00:00
end: 2023-12-17 00:00:00
period: 1d
basePeriod: 1h
exchanges: [{"eid":"Futures_Binance","currency":"BTC_USDT"}]
*/

// This source code is subject to the terms of the Mozilla Public License 2.0 at https://mozilla.org/MPL/2.0/
// © armigoldman

//@version=3
strategy(title="Galileo Galilei", shorttitle="Galileo Galilei", overlay=true, initial_capital = 100000, default_qty_type=strategy.cash, default_qty_value = 100000)
len = input(11, minval=1, title="Length")
src = input(open, title="Source")
out = ema(src, len)
plot(out, title="EMA", color=yellow)
//last8h = highest(close, 8)
//lastl8 = lowest(close, 8)

//plot(last8h, color=red, linewidth=2)
//plot(lastl8, color=green, linewidth=2)

////////////////////////////////////////////////////////////////////////////////
// BACKTESTING RANGE

// From Date Inputs
fromDay = input(defval=1, title="From Day", minval=1, maxval=31)
fromMonth = input(defval=1, title="From Month", minval=1, maxval=12)
fromYear = input(defval=2020, title="From Year", minval=1970)

// To Date Inputs
toDay = input(defval=1, title="To Day", minval=1, maxval=31)
toMonth = input(defval=12, title="To Month", minval=1, maxval=12)
toYear = input(defval=2021, title="To Year", minval=1970)

// Calculate start/end date and time condition
startDate = timestamp(fromYear, fromMonth, fromDay, 00, 00)
finishDate = timestamp(toYear, toMonth, toDay, 00, 00)
time_cond = true


bearish = cross(close, out) == 1 and close[1] > close
bullish = cross(close, out) == 1 and close[1] < close

plotshape(bearish, color=white, style=shape.arrowdown, text="BEAR", location=location.abovebar)
plotshape(bullish, color=white, style=shape.arrowup, text="BULL", location=location.belowbar)

buy = if cross(close, out) == 1 and close[1] < close
    strategy.entry("BUY", strategy.long, when=time_cond)
        //strategy.close_all(when=bearish)
        // strategy.exit("exit", "Long", profit =, loss = 35)


sell = if cross(close, out) == 1 and close[1] > close
    strategy.entry("SELL", strategy.short, when=time_cond)
        //sell = if bearish
        //strategy.close_all(when=bullish)
        // strategy.exit("exit", "Long", profit = bullish, loss = 100)

profit = strategy.netprofit
if not time_cond
    strategy.close_all()

//plotshape(true, style=shape.triangleup, location=location.abovebar)
- 바이에스 조건 RSI 거래 전략
- 피보트 역전 전략
- TSI 지표와 Hull 이동 평균에 기초한 양적 거래 전략
- 채널 트렌드 전략
- CCI의 장기적 전략
- 이동 평균 리본 전략
- MACD 이중 이동 평균 추적 전략
- X48 - 데이 라이트 헌터 전략 최적화 및 적응
- 하이킨-아시 - 0.5% 변경 단기 거래 전략
- 긍정적인 채널 EMA 트레일링 스톱 전략
- 윌리엄스 지표의 AC 백테스트 전략
- 낮은 변동성 방향 구매와 수익 취득 및 손실 중지
- 이동평균에 기초한 고정 비율의 스톱 로스 및 영업 전략
- 이중 EMA 및 가격 변동 지수에 기초한 양적 거래 전략
- 모멘텀 브레이크오웃 양방향 추적 전략
- 슈퍼 트렌드 LSMA 장기 전략
- 세 바와 네 바 브레이크업 역전 전략
- 적응적인 기하급수적 이동평균 라인에 기초한 적응적인 SMI 에르고딕 거래 전략
- 스팟 거래에 대한 SMA 및 PSAR 전략
- SMA 및 RSI 단장 전략