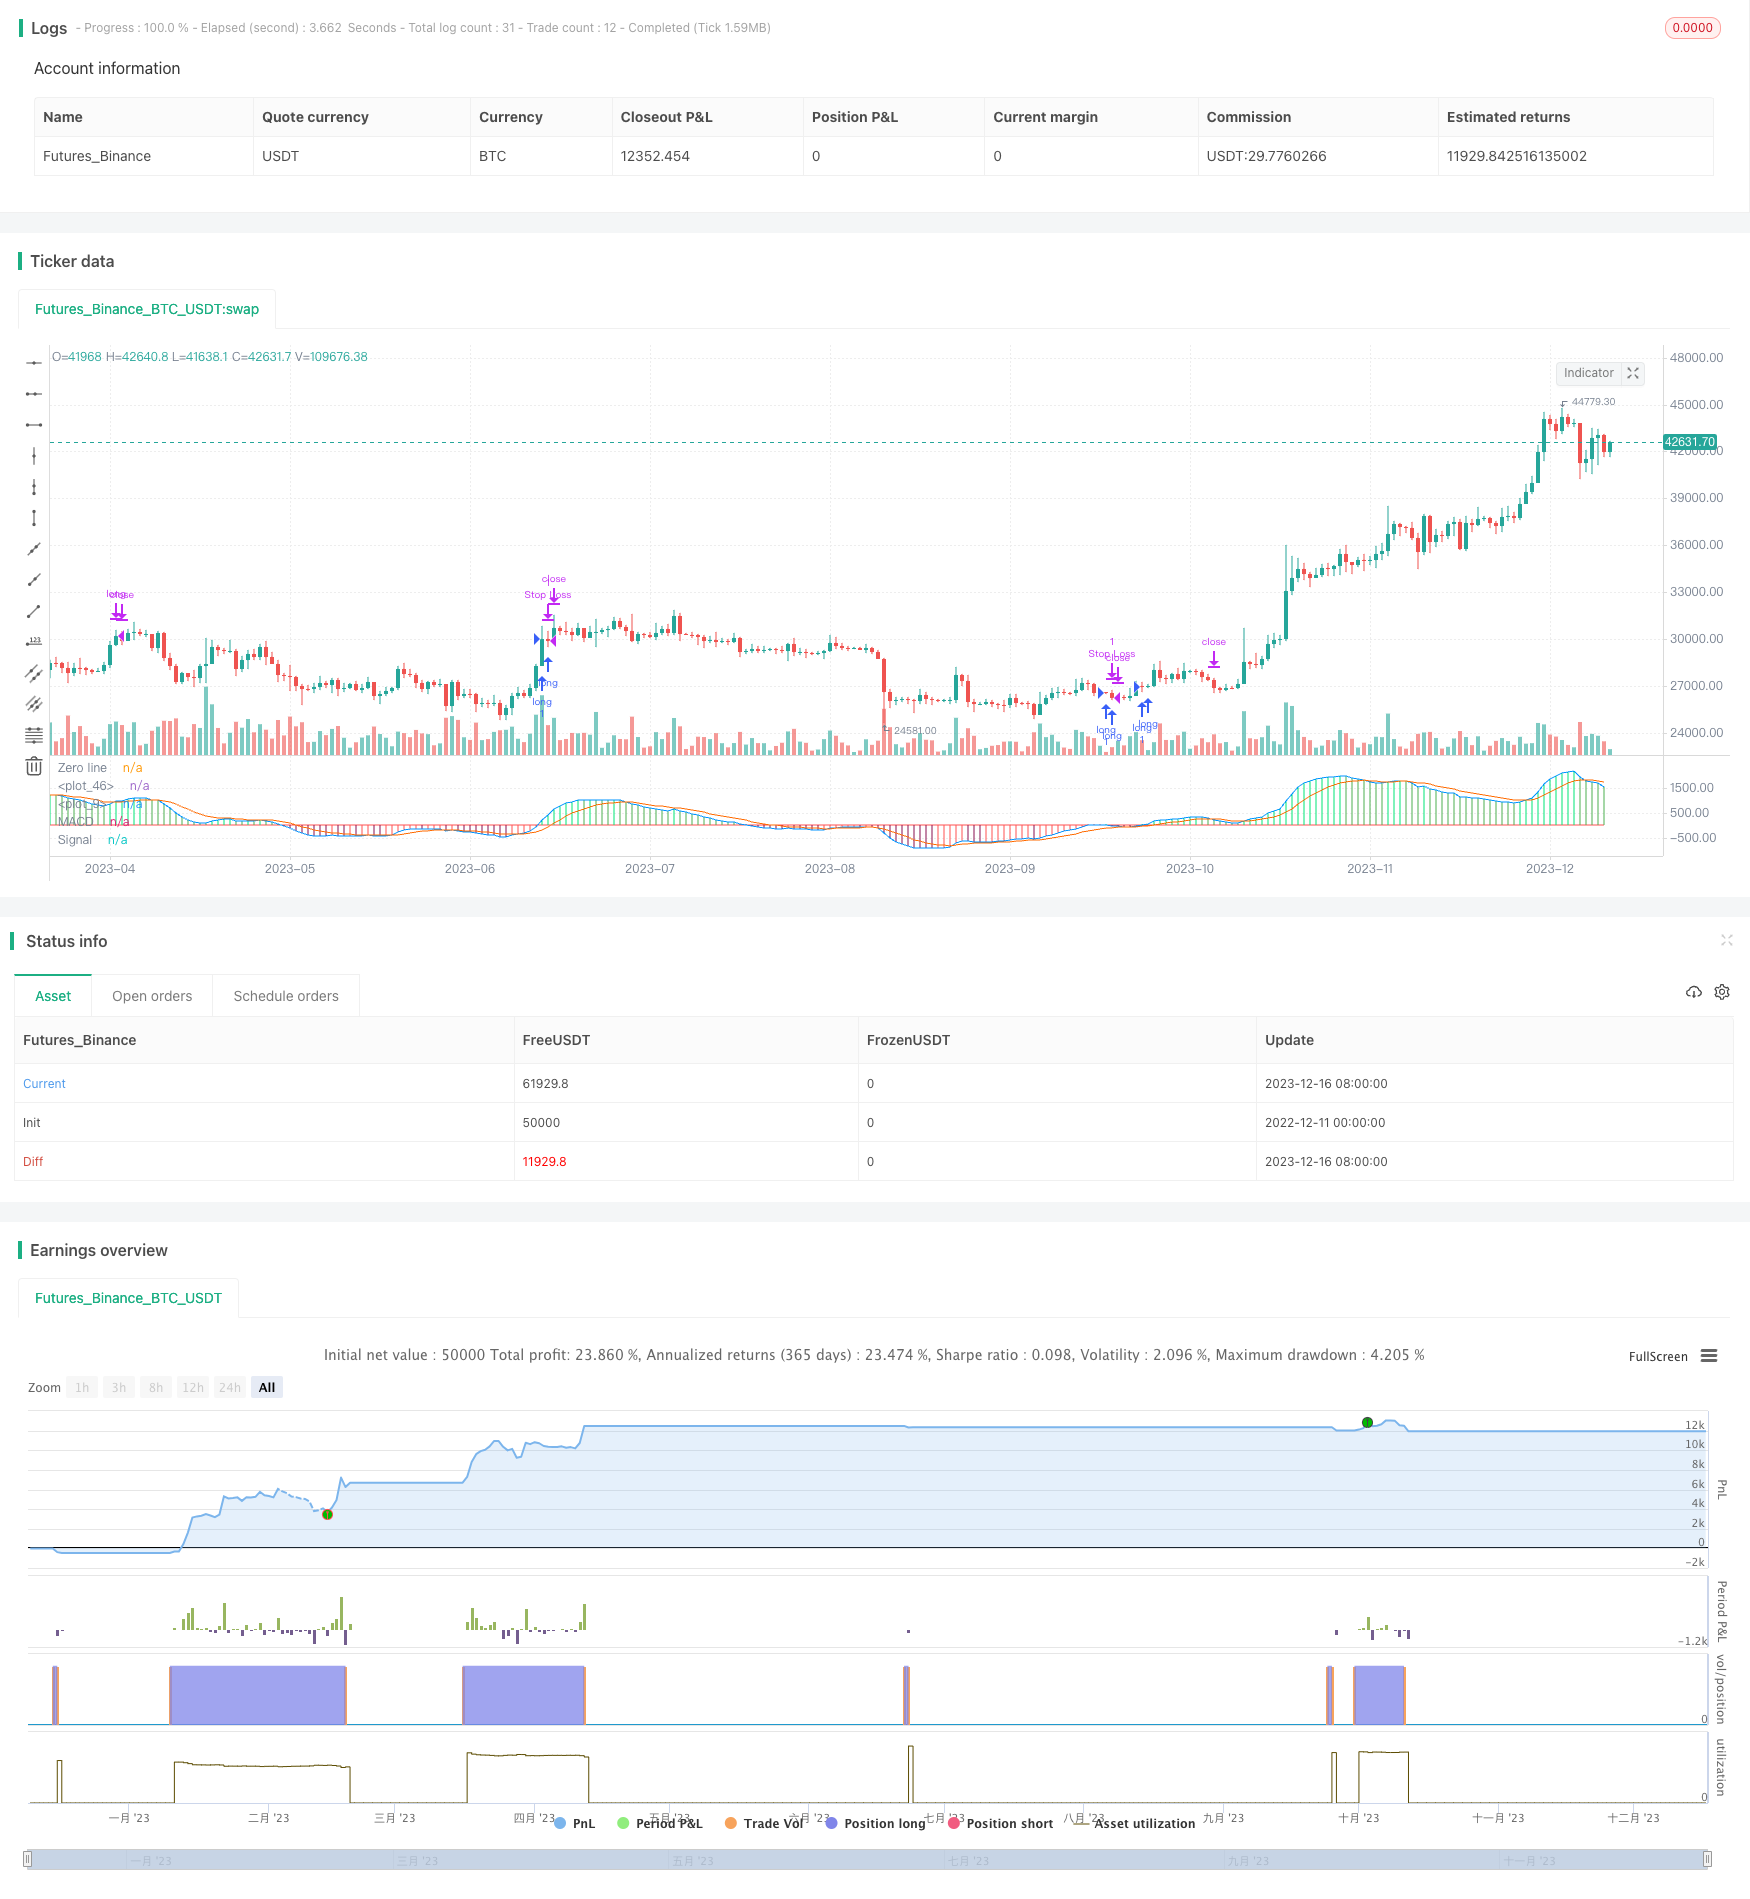
개요
이 전략은 MACD 로봇 거래 전략이라 불린다. 이 전략은 MACD 지표의 빠른 선과 느린 선의 관계를 계산하여 시장의 매수 시기를 판단하고, 스톱 로스를 추적하여 위험을 제어한다.
전략 원칙
이 전략은 주로 MACD 지표에 기반하여 개발되었다. MACD 지표는 빠른 선과 느린 선으로 구성되어 있으며, 빠른 선은 단기 평균이며, 느린 선은 장기 평균이며, 두 가지의 관계는 시장의 매매 상태를 반영한다. 빠른 선이 긴 선을 통과하면 구매 신호가 되고, 아래로 통과하면 판매 신호가 된다.
이 전략에서, 빠른 선과 느린 선은 각각 EMA 알고리즘을 사용하여 계산되며, 주기를 사용자 정의할 수 있다. 신호 품질을 향상시키기 위해, 신호 선이 추가되어, EMA 알고리즘을 사용하여 MACD 값을 다시 한 번 부드럽게 처리한다.
구매 시기를 판단할 때, 빠른 속도 와이어 포크를 보는 것뿐만 아니라 MACD 절대 값이 사용자 정의 된 구매 라인보다 크는지 판단해야합니다. 만족하면 구매 신호를 발산하고, 추적 스톱을 사용하여 위험을 제어하십시오.
판매 시점을 판단할 때, 동시에 빠른 느린 선의 사각지대와 신호 선이 양수인 조건을 충족시키려면 판매 신호를 발사하여 포지션을 평정한다.
우위 분석
이 전략에는 다음과 같은 장점이 있습니다.
- MACD 지표 사용으로 매매 시기를 판단하고 신뢰성이 높다.
- 신호선을 추가하여 신호의 질을 향상시킵니다.
- 제휴를 통해 수익을 창출하는 방법
- 구매 라인은 사용자 정의 전략 감수성을 조정할 수 있습니다.
- 모든 조건은 지표에 기반하고 외부 영향을 받지 않습니다.
위험 분석
이 전략에는 몇 가지 위험도 있습니다.
- MACD 지표가 지연되어 단선 조작 기회를 놓칠 수 있습니다.
- 부적절한 스톱포인트 설정으로 불필요한 손실이 발생할 수 있습니다.
- 파라미터 튜닝은 테스트와 조정을 위해 많은 시간을 필요로 합니다.
- 거래 비용과 슬라이드 포인트의 영향
이러한 위험은 적절한 매개 변수 조정, 다른 지표의 조합 등의 방법으로 줄일 수 있습니다.
최적화 방향
이 전략은 다음과 같은 방향으로 최적화될 수 있습니다.
- KDJ, RSI 등과 같은 다른 지표의 필터 신호와 함께
- 기계 학습 알고리즘을 추가하여 매매 지점을 결정합니다.
- 동적 스톱로스 대신 정적 스톱로스를 채택
- MACD 변수 및 구매 라인을 테스트 최적화
- 거래 비용의 영향을 고려한 조정 전략
요약하다
이 전략overall는 높은 신뢰성 트렌드 추적 전략. MACD 지표로 트렌드를 판단, 추적 스톱 손실 제어 위험을 취하여 안정적인 투자 수익을 얻을 수 있습니다. NEXT STEP는 추가로 최적화 파라미터를 조합 다른 지표, 결합 기계 학습 등의 방법으로 전략 수익성을 높입니다.
/*backtest
start: 2022-12-11 00:00:00
end: 2023-12-17 00:00:00
period: 1d
basePeriod: 1h
exchanges: [{"eid":"Futures_Binance","currency":"BTC_USDT"}]
*/

//@version=3
strategy(shorttitle = "GBPUSD MACD", title = "GBPUSD MACD")
fastMA = input(title="Fast moving average",  defval = 12, minval = 7)
slowMA = input(title="Slow moving average",  defval = 26, minval = 7)
lastColor = yellow
[currMacd,_,_] = macd(close[0], fastMA, slowMA, 9)
[prevMacd,_,_] = macd(close[1], fastMA, slowMA, 9)
plotColor = currMacd > 0 ? currMacd > prevMacd ? lime : green : currMacd < prevMacd ? maroon : red
plot(currMacd, style = histogram, color = plotColor, linewidth = 3)
plot(0, title = "Zero line", linewidth = 1, color = gray)

//MACD
// Getting inputs
fast_length = input(title="Fast Length",  defval=12)
slow_length = input(title="Slow Length",  defval=26)
src = input(title="Source", defval=close)
signal_length = input(title="Signal Smoothing",  minval = 1, maxval = 50, defval =9)
sma_source = input(title="Simple MA(Oscillator)", type=bool, defval=false)
sma_signal = input(title="Simple MA(Signal Line)", type=bool, defval=false)

// Plot colors
col_grow_above = #26A69A
col_grow_below = #FFCDD2
col_fall_above = #B2DFDB
col_fall_below = #EF5350
col_macd = #0094ff
col_signal = #ff6a00

// Calculating
fast_ma = sma_source ? sma(src, fast_length) : ema(src, fast_length)
slow_ma = sma_source ? sma(src, slow_length) : ema(src, slow_length)
macd = fast_ma - slow_ma
signal = sma_signal ? sma(macd, signal_length) : ema(macd, signal_length)
hist = macd - signal

//plot(hist, title="Histogram", style=columns, color=(hist>=0 ? (hist[1] < hist ? col_grow_above : col_fall_above) : (hist[1] < hist ? col_grow_below : col_fall_below) ), transp=0 )
plot(macd, title="MACD", color=col_macd, transp=0)
plot(signal, title="Signal", color=col_signal, transp=0)
///END OF MACD

//Long and Close Long Lines
linebuy = input(title="Enter Long", type=float, defval=-0.00045)
linesell = input(title="Close Long", type=float, defval=0.0001)

//Plot Long and Close Long Lines
plot(linebuy,color=green),plot(linesell,color=red)


//Stop Loss Input
sl_inp = input(0.05, title='Stop Loss %', type=float)/100


//Order Conditions
longCond = crossover(currMacd, linebuy)
exitLong = crossover(currMacd, signal) and signal > 0
stop_level = strategy.position_avg_price * (1 - sl_inp)


//Order Entries
strategy.entry("long", strategy.long,  when=longCond==true)
strategy.close("long", when=exitLong==true)
strategy.exit("Stop Loss", stop=stop_level)