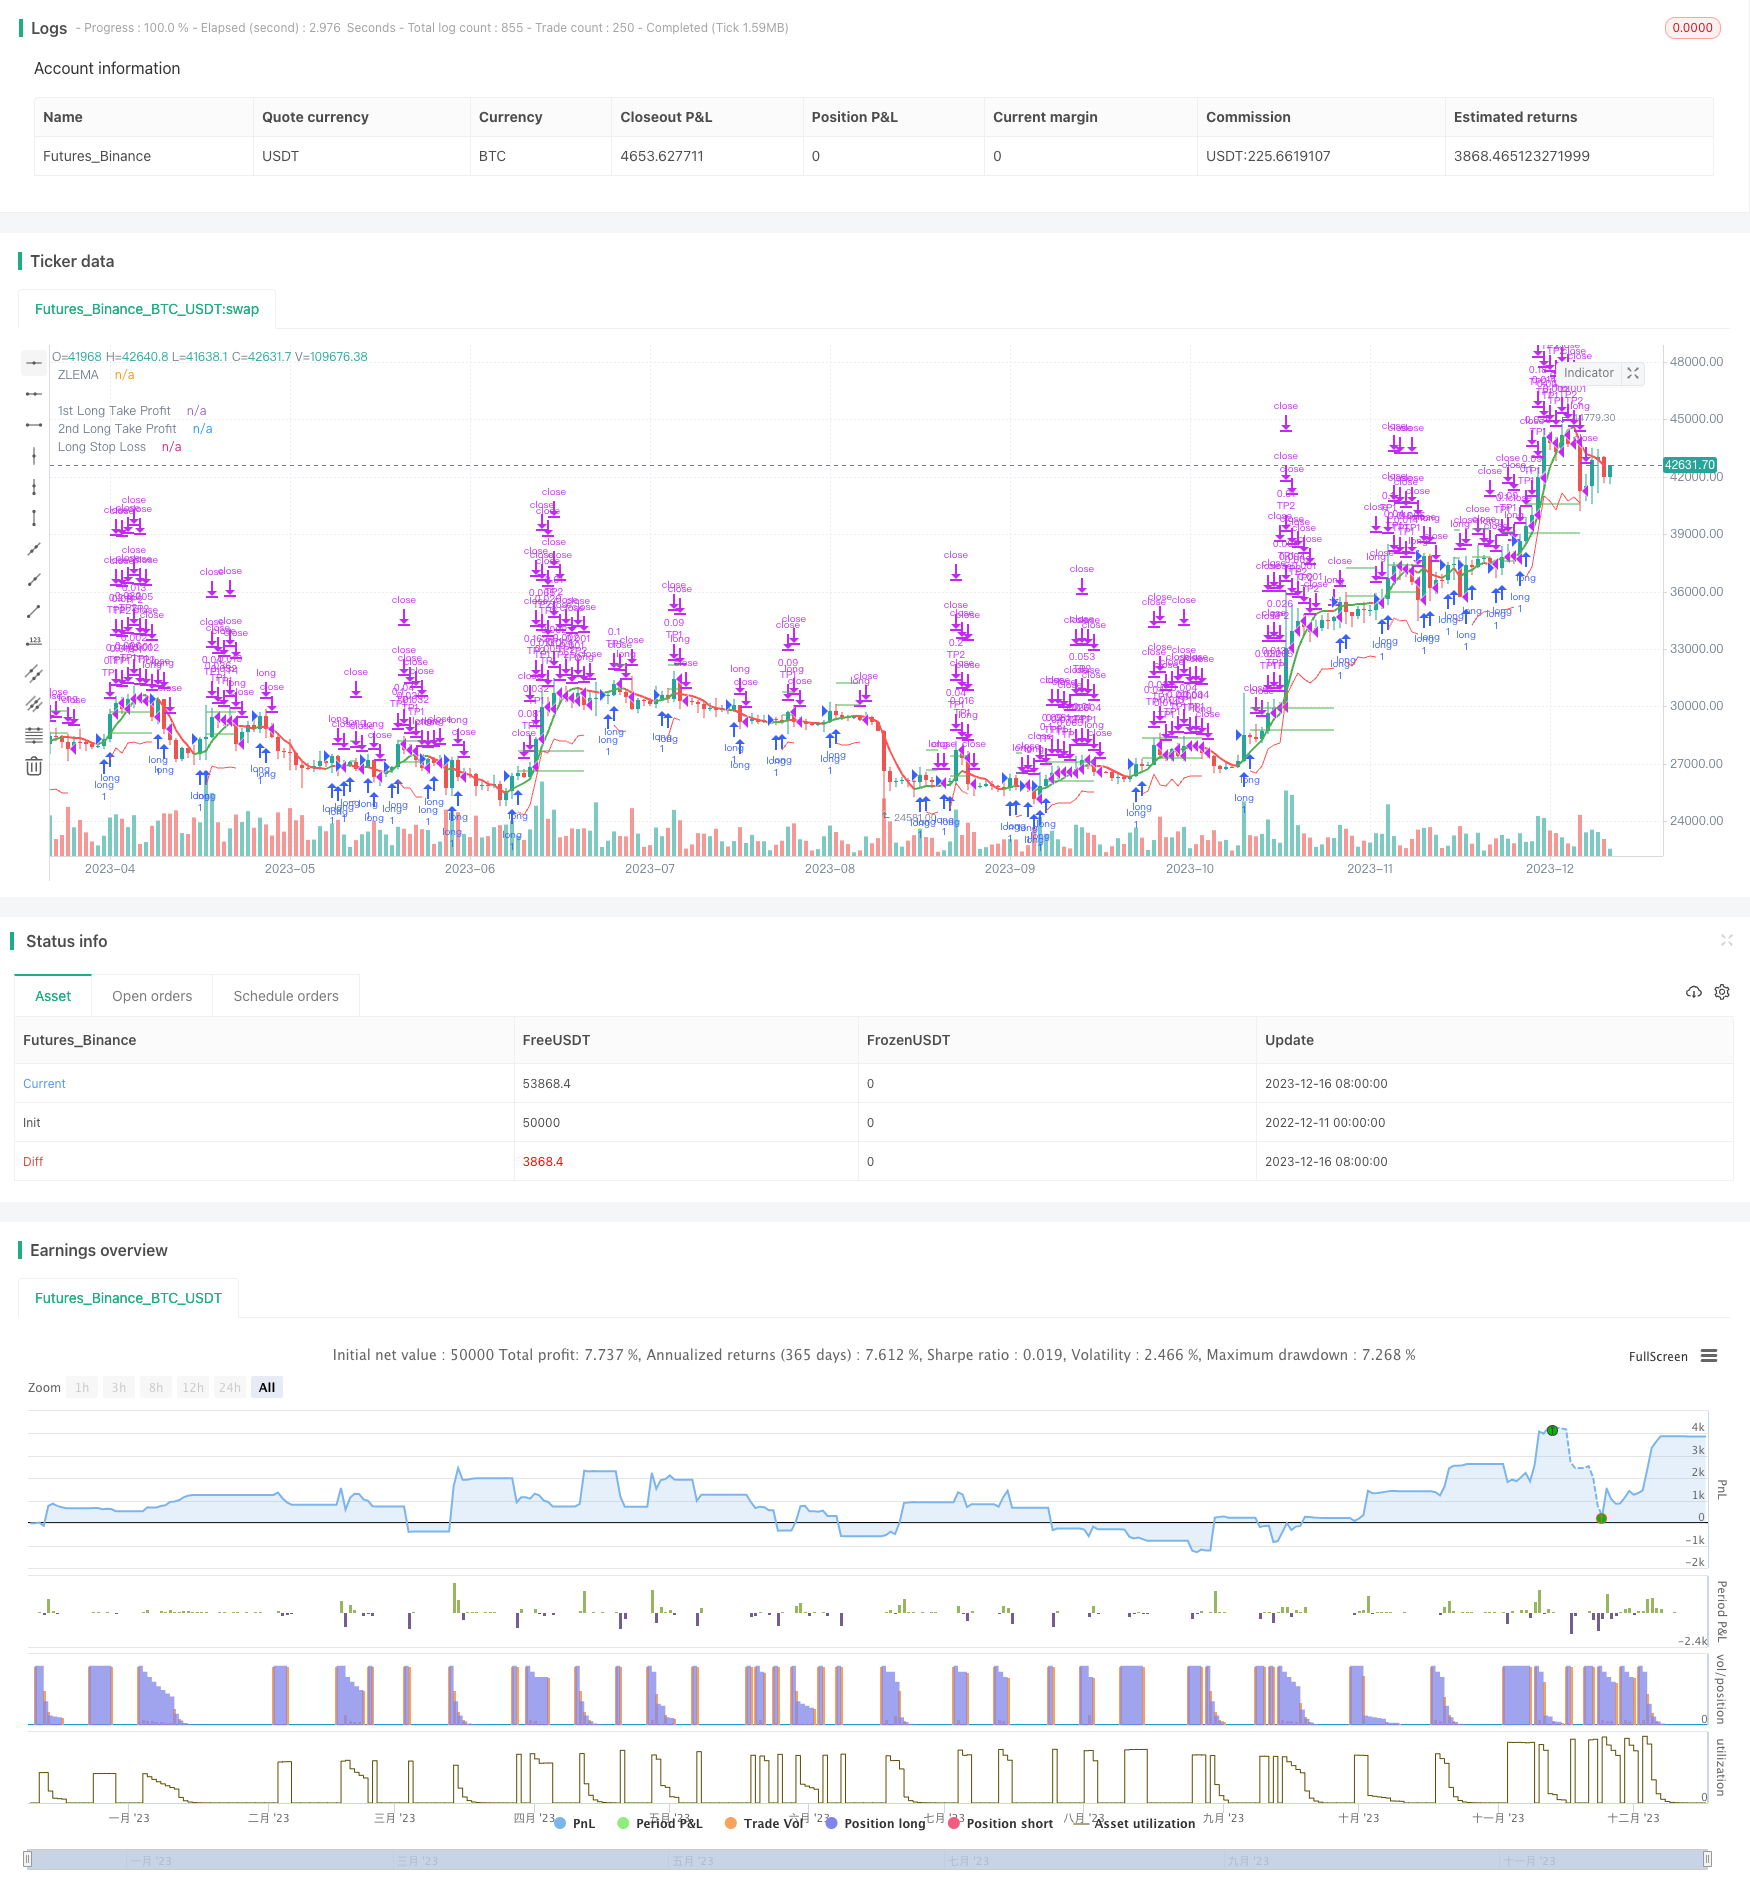
개요
이 전략은 SMA 평균선에 기반한 간단한 포지션 전략이다. 단기 SMA 라인에서 긴 SMA 라인을 뚫을 때, 더 많은 포지션을 열고, 단기 SMA 라인 아래에서 긴 SMA 라인을 뚫을 때, 평소 포지션을 한다.
전략 원칙
이 전략은 두 개의 SMA 평균선을 사용한다. 단기 20 일선과 장기 50 일선이다. 단기선은 가격 변화의 추세를 더 빨리 포착하고, 장기선은 단기간의 잡음을 필터링한다. 단기간의 급격한 상승이 장기간 평균선을 초과할 때, 시장이 장기간 상승을 시작할 수 있음을 나타냅니다. 단기선은 장기간 평균선 아래로 내려가며, 상승 추세가 끝날 수 있음을 나타냅니다.
전체적으로, 이 전략은 SMA 평균의 곡선 특성을 활용하여, 두 시간 차원에서 가격 운동의 추세를 판단하고, 보다 안정적인 포지션 방식을 사용하여 수익을 얻습니다.
우위 분석
이 전략은 다음과 같은 장점을 가지고 있습니다.
- 작동이 간단하고 이해하기 쉽으며, 관점은 낮습니다.
- SMA 평균의 장점을 활용하여 비교적 안정적
- 지분 보유 기간이 길고, 단기 시장 소음에 영향을 받지 않는다.
- 구성 가능한 파라미터가 적고 최적의 파라미트 조합을 찾기 위해 최적화하기 쉽습니다.
위험 분석
이 전략에는 다음과 같은 위험도 있습니다.
- 시장이 장기적으로 흔들리면 더 많은 손실이 발생할 수 있습니다.
- SMA는 가격변동에 대한 지연성을 가지고 있지 않다.
- 단기적 상승과 하락을 효율적으로 활용할 수 없는 상황
- 단독 손실을 통제할 수 없습니다.
최적화 방향
이 전략은 다음과 같은 부분에서 최적화될 수 있습니다.
- MACD 지표에 참여하여 하위 반향을 판단하여 충격적인 상황에서 손실을 줄이기위한 시간
- 다양한 변수들의 SMA 평균선 조합을 테스트하여 최적의 변수를 찾습니다.
- 국내 지표 판단 트렌드 이탈, 포지션 개시 정확성 향상
- 단편적 손실을 통제하기 위한 스톱로스 전략의 증강
요약하다
전체적으로, 이 SMA는 안정적이고, 간단하며, 작동하기 쉽고, 초보자에게 적합하다. 수량 거래의 지속적인 발전으로, 이 전략은 더 많은 지표와 기술적 수단을 도입하여 최적화하여 더 나은 효과를 얻을 수 있다.
전략 소스 코드
/*backtest
start: 2022-12-11 00:00:00
end: 2023-12-17 00:00:00
period: 1d
basePeriod: 1h
exchanges: [{"eid":"Futures_Binance","currency":"BTC_USDT"}]
*/

//@version=5
strategy('Zlema Strateg Long 5m', overlay=true )

// FUNCTIONS

Atr(p) =>
    atr = 0.
    Tr = math.max(high - low, math.max(math.abs(high - close[1]), math.abs(low - close[1])))
    atr := nz(atr[1] + (Tr - atr[1]) / p, Tr)
    atr

// ZLEMA
length = input(title='Length', defval=14)
highlightMovements = input(title='Highlight Movements ?', defval=true)
src = input(title='Source', defval=close)

lag = math.floor((length - 1) / 2)

zlema = ta.ema(src + src - src[lag], length)

zlemaColor = highlightMovements ? zlema > zlema[1] ? color.green : color.red : #6d1e7f
plot(zlema, title='ZLEMA', linewidth=2, color=zlemaColor, transp=0)


// TAKE PROFIT AND STOP LOSS
long_tp1_inp = input.float(1, title='Long Take Profit 1 %', step=0.1) / 100
long_tp1_qty = input.int(10, title='Long Take Profit 1 Qty', step=1)

long_tp2_inp = input.float(5, title='Long Take Profit 2%', step=0.1) / 100
long_tp2_qty = input.int(50, title='Long Take Profit 2 Qty', step=1)

long_take_level_1 = strategy.position_avg_price * (1 + long_tp1_inp)
long_take_level_2 = strategy.position_avg_price * (1 + long_tp2_inp)


// Stop Loss
multiplier = input.float(2.2, 'SL Mutiplier', minval=1, step=0.1)
ATR_period = input.int(17, 'ATR period', minval=1, step=1)

// Strategy
entry_long = zlema > zlema[1]
entry_price_long = ta.valuewhen(entry_long, close, 0)
SL_floating_long = entry_price_long - multiplier * Atr(ATR_period)
exit_long = zlema < zlema[1]

///// BACKTEST PERIOD ///////
testStartYear = input(2022, 'Backtest Start Year')
testStartMonth = input(1, 'Backtest Start Month')
testStartDay = input(1, 'Backtest Start Day')
testPeriodStart = timestamp(testStartYear, testStartMonth, testStartDay, 0, 0)

testStopYear = input(9999, 'Backtest Stop Year')
testStopMonth = input(12, 'Backtest Stop Month')
testStopDay = input(31, 'Backtest Stop Day')
testPeriodStop = timestamp(testStopYear, testStopMonth, testStopDay, 0, 0)

testPeriod() =>
    time >= testPeriodStart and time <= testPeriodStop ? true : false

if testPeriod()
    strategy.entry('long', strategy.long, comment='Long', when=entry_long)
    strategy.exit('TP1', 'long', qty_percent=long_tp1_qty, limit=long_take_level_1)  //, trail_points=entry_price_long * long_trailing / syminfo.mintick, trail_offset=entry_price_long * long_trailing / syminfo.mintick)
    strategy.exit('TP2', qty_percent=long_tp2_qty, limit=long_take_level_2)  //, trail_points=entry_price_long * long_trailing / syminfo.mintick, trail_offset=entry_price_long * long_trailing / syminfo.mintick)
    strategy.close('long', when=exit_long, comment='exit long')


// LONG POSITION
plot(strategy.position_size > 0 ? long_take_level_1 : na, style=plot.style_linebr, color=color.new(color.green, 0), linewidth=1, title='1st Long Take Profit')
plot(strategy.position_size > 0 ? long_take_level_2 : na, style=plot.style_linebr, color=color.new(color.green, 0), linewidth=1, title='2nd Long Take Profit')
plot(strategy.position_size > 0 ? SL_floating_long : na, style=plot.style_linebr, color=color.new(color.red, 0), linewidth=1, title='Long Stop Loss')


if testPeriod()
    strategy.entry('long', strategy.long, comment='Long', when=entry_long)


// LONG POSITIONplot(strategy.position_size > 0 ? SL_floating_long : na, style=plot.style_linebr, color=color.new(color.red, 0), linewidth=1, title='Long Stop Loss')