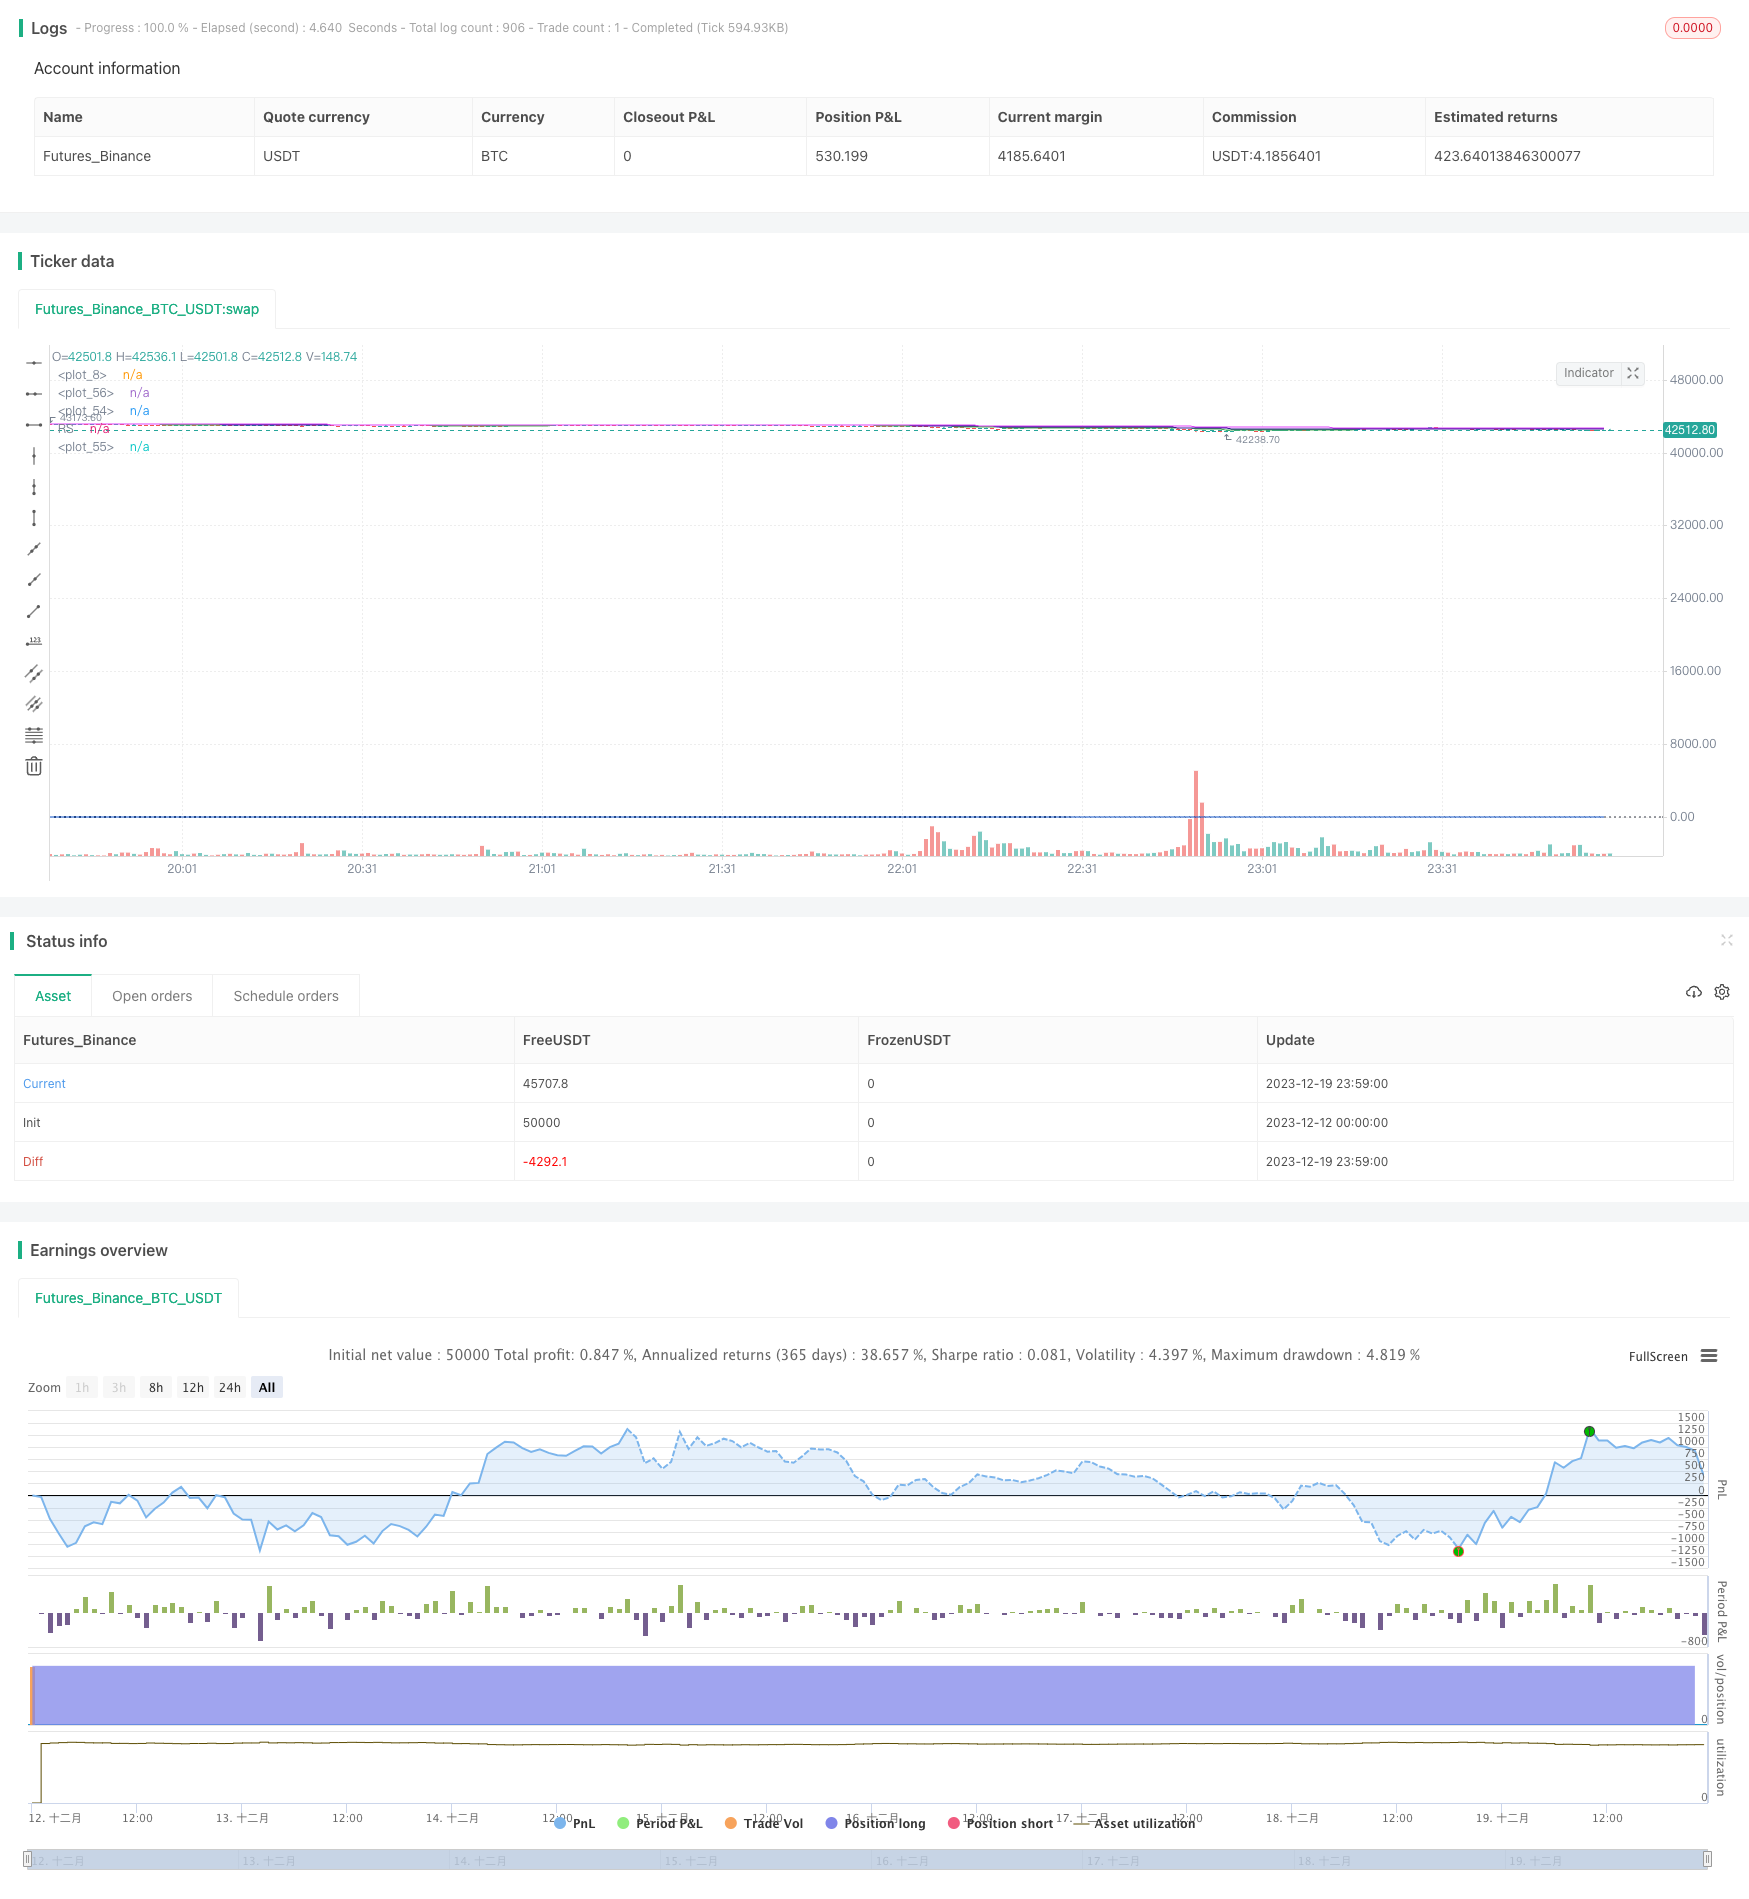
개요
이 전략은 쌍평균선과 상대 강도 지표에 기초하여, 주식의 역사적인 변동률과 결합하여, 주식의 자동 구매와 판매를 구현한다. 전략의 장점은 긴 선과 짧은 선의 결합을 구현하여 위험을 효과적으로 제어할 수 있다. 그러나 또한 약간의 개선의 여지가 있으며, 예를 들어 손실 제도를 추가하는 것을 고려할 수 있다.
전략 원칙
전략은 150주 라인아 평균선과 50일 라인 빠른 평균선으로 구성된 쌍평평선 시스템과 20일 라인 가장 빠른 평균선을 사용한다. 가격이 150주 라인아 상선을 통과했을 때 상행 시작이라고 생각하고, 가격이 50일 라인아 상선을 통과했을 때 상행 시작이라고 생각한다. 이렇게 하면 상행 중 추격 하락, 하락 중 언제든지 중지 손실을 실현할 수 있다.
또한, 전략은 연간 변동률 최고 가격과 상대 강도 지표를 사용하여 특정 구매 시점을 결정한다. 매매가격이 연간 변동률을 계산한 최고 가격을 초과하고 상대 강도 지표가 긍정적일 때만 구매 신호를 낸다.
전략적 이점
- 이중 동선 시스템을 사용하여 주요 트렌드의 변화를 효과적으로 판단하여 추락을 추적 할 수 있습니다.
- 변동률 지표와 강도 지표의 추가로, 흔들리는 상황에서 파동적 흐름을 피할 수 있다.
- 20일 급속한 평균선 추가로 손실을 더 빨리 막을 수 있다.
전략적 위험
- “이런 일이 벌어진다면, 우리는 더 이상 이 문제를 해결할 수 없을 것입니다.
- 스톱 리스트가 설정되지 않아 큰 손실이 발생할 수 있습니다.
- 매개 변수 최적화 부족, 매개 변수 설정이 상대적으로 주관적
위험을 해결하기 위해, 중지 수준을 설정하거나, ATR 지표의 배수를 중지 범위로 사용할 수 있습니다. 또한 더 엄격한 재검토를 통해 파라미터를 최적화 할 수 있습니다.
전략 최적화 방향
- 손해 방지 장치
- 매개 변수 최적화 방법을 사용하여 최적의 매개 변수를 찾습니다.
- 타 지표의 필터링 신호를 추가하는 것을 고려하십시오. 예를 들어 거래량 지표와 같은
- 전략이 다중 요소 모델로 만들어져 더 많은 지표와 결합되는 것을 고려할 수 있습니다.
요약하다
이 전략은 전반적으로 비교적 보수적인 주식 투자 전략이다. 쌍평균선을 사용하여 주요 트렌드를 판단하고, 변동률과 강도 지표와 결합하여 진입을 효과적으로 필터링 할 수 있다. 빠른 평평선이 추가되면서도 손실이 더 빨리 멈출 수 있다. 그러나 전략은 추가될 수 있다.
전략 소스 코드
/*backtest
start: 2023-12-12 00:00:00
end: 2023-12-20 00:00:00
period: 1m
basePeriod: 1m
exchanges: [{"eid":"Futures_Binance","currency":"BTC_USDT"}]
*/

//@version=4
//Relative Strength
strategy("Stan my man", overlay=true)
comparativeTickerId = input("BTC_USDT:swap",  title="Comparative Symbol")
l = input(50, type=input.integer, minval=1, title="Period")
baseSymbol = security(syminfo.tickerid, timeframe.period, close)
comparativeSymbol = security(comparativeTickerId, timeframe.period, close)
hline(0, color=color.black, linestyle=hline.style_dotted)
res = baseSymbol / baseSymbol[l] /(comparativeSymbol / comparativeSymbol[l]) - 1
plot(res, title="RS", color=#1155CC)

//volume ma
vol1 = sma(volume,20)
// 30 week ma
ema1 = ema(close, 150)
//consolidation
h1 = highest(high[1],365)

fastPeriod = input(title="Fast MA", type=input.integer, defval=50)
slowPeriod = input(title="Slow MA", type=input.integer, defval=150)
fastestperiod = input(title="Fastest MA", type=input.integer, defval=20)

fastEMA = ema(close, fastPeriod)
slowEMA = ema(close, slowPeriod)
fastestEMA = ema(close, fastestperiod)

monitorStrategy = close < close[20]


// trade conditions
buytradecondition1 = close >ema1 and res>0 and volume> 1.5*vol1 and close > h1
buytradecondition2 = close > fastEMA  and volume> 1.5* vol1
selltradecondition1  = close< 0.95 * fastEMA
selltradecondition2  = close< 0.90 * open

if (buytradecondition1)
    strategy.entry("long",strategy.long,alert_message ="Seems ready to Buy")
    alert("Buy Alert Price (" + tostring(close) + ") crossed over Slow moving average",alert.freq_all)

if (buytradecondition2)
    strategy.entry("long",strategy.long,alert_message ="Seems ready to Buy")
    alert("Buy Alert Price (" + tostring(close) + ") crossed over fast moving average",alert.freq_all)

if (selltradecondition1)
    strategy.close("long",alert_message ="Seems ready to Sell")
    alert("Sell Alert Price (" + tostring(close) + ") crossed down fast moving average",alert.freq_all)

if (selltradecondition2)
    strategy.close("long",alert_message ="Seems ready to Sell")
    alert("Sell Alert Price (" + tostring(close) + ") crossed down 10% below open price  ",alert.freq_all)

//alertcondition(buytradecondition1,title ="BuySignal", message ="Price Crossed Slow Moving EMA ")

plot(fastEMA, color=color.navy)
plot(slowEMA, color=color.fuchsia)
plot(fastestEMA, color=color.green)