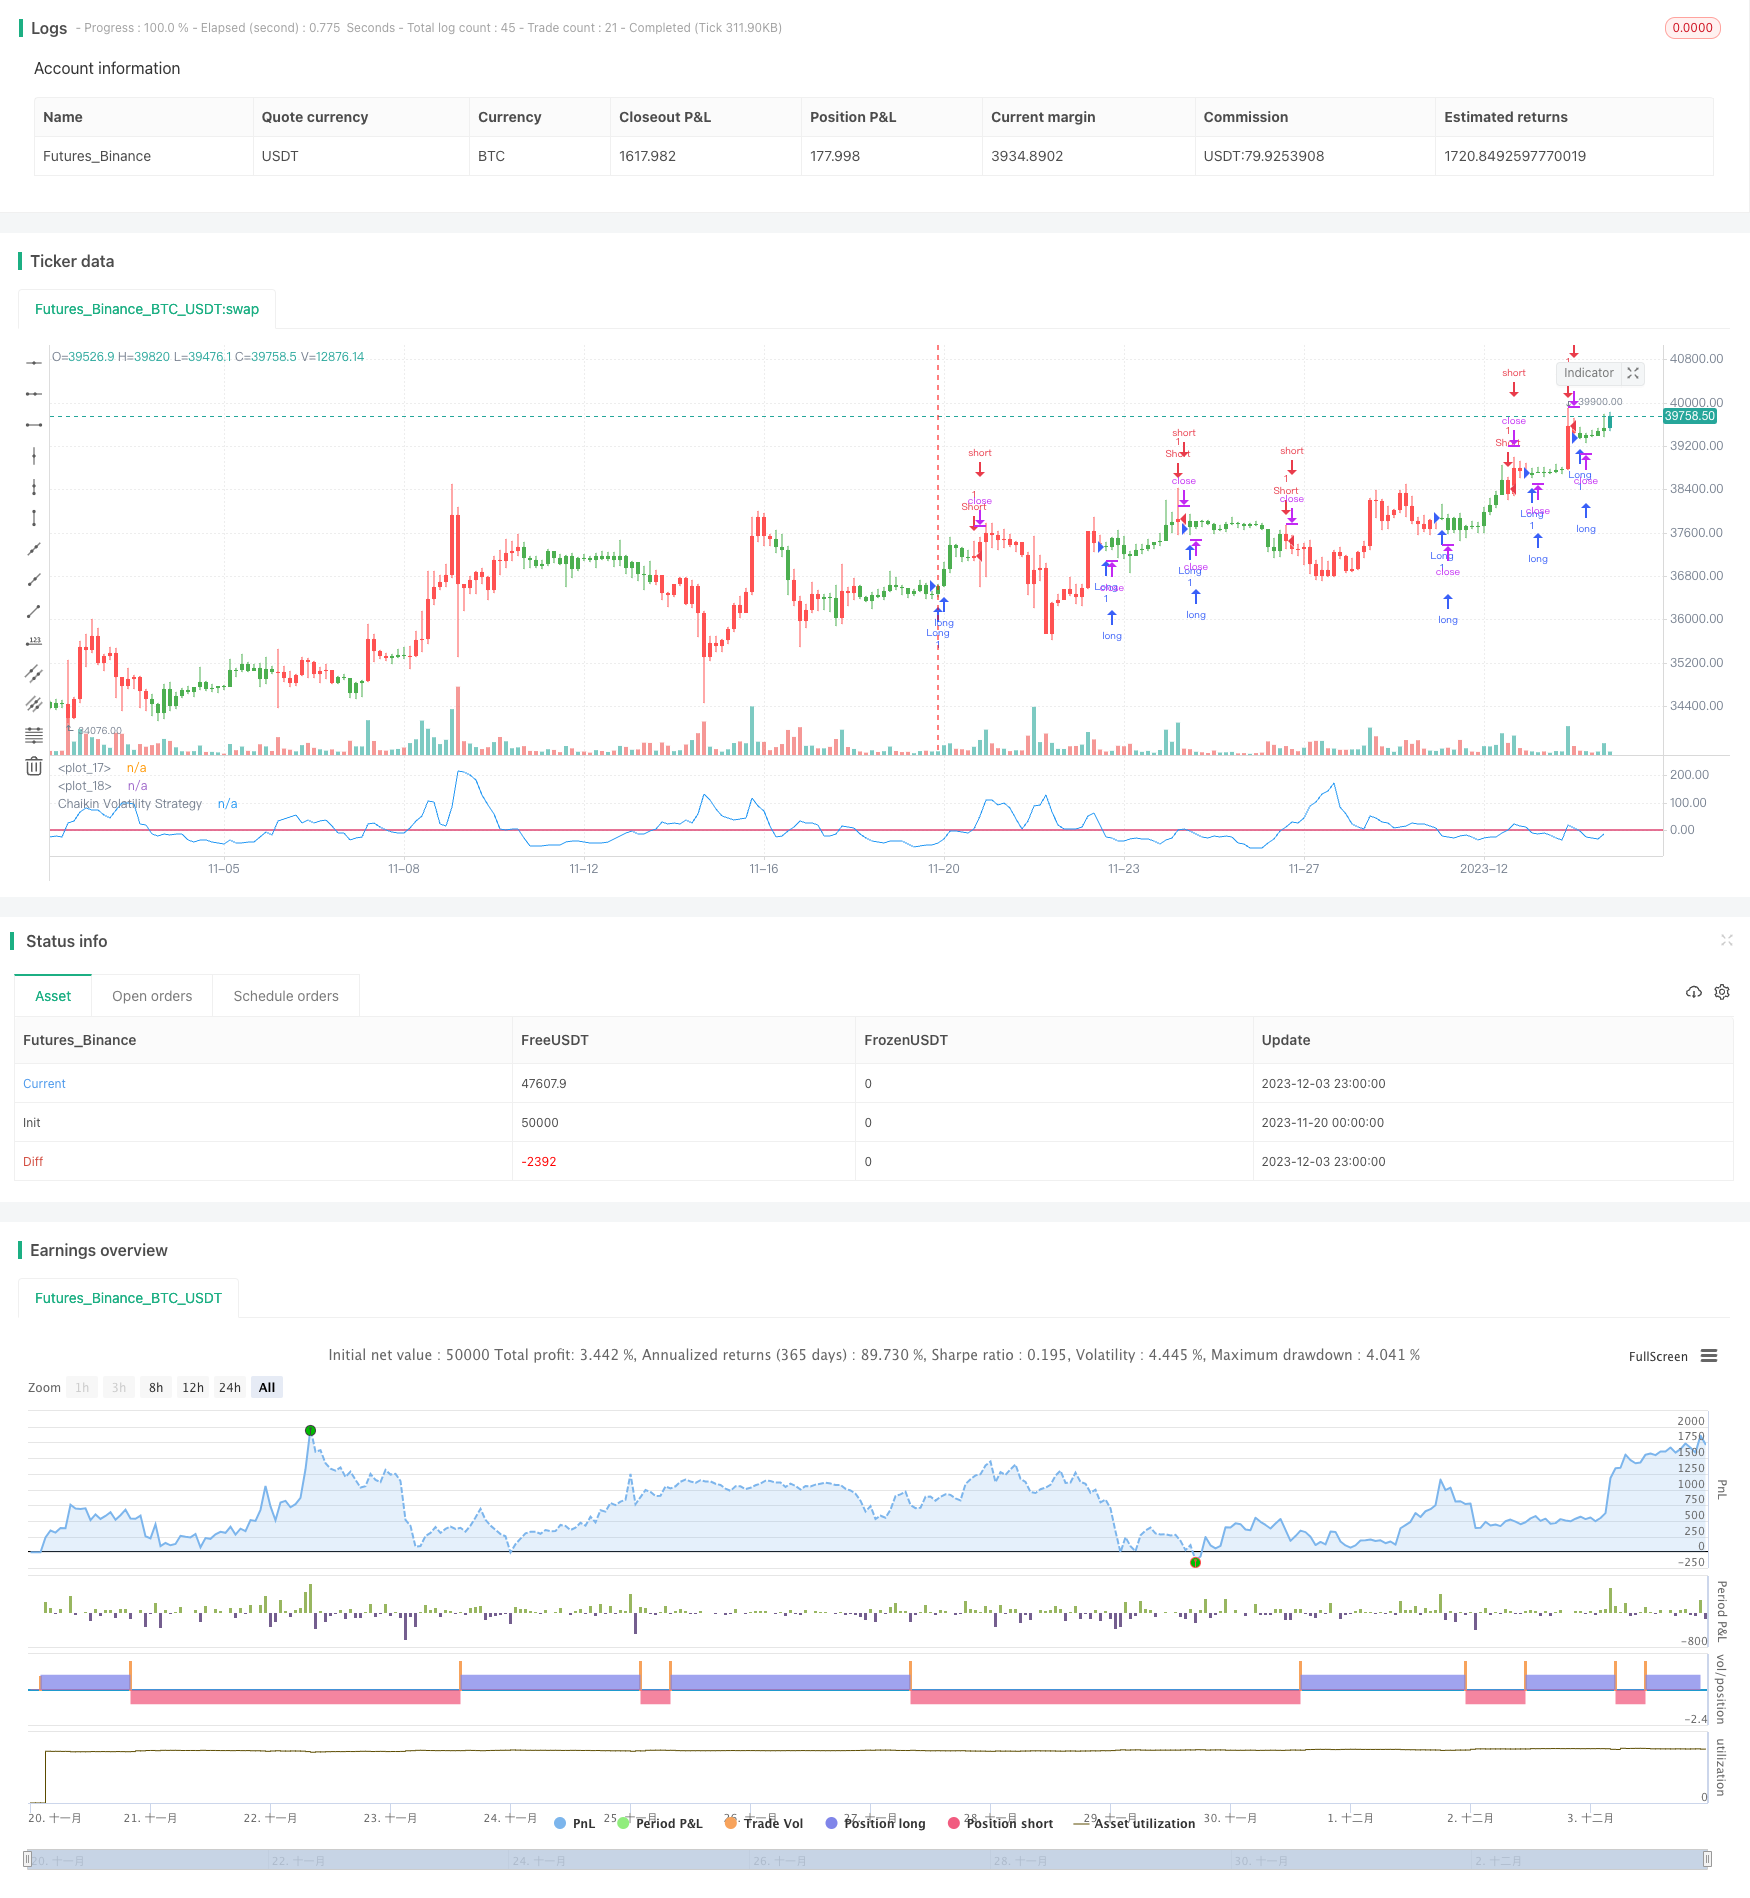
체이킨 변동성 지표에 기초한 단기 거래 전략
저자:차오장, 날짜: 2023-12-21 16:14:56태그:

전반적인 설명
이 전략은 체이킨 변동성 지표에 기반한 단기 거래 시스템을 설계하여 단기 시장 변동을 포착합니다. 주요 아이디어는 체이킨 변동성 지표가 지정된 임계 이상 또는 이하를 넘을 때 긴 또는 짧은 포지션을 입력하는 것입니다.
전략 논리
차킨 변동성 지표는 증권의 최고와 최저 가격 사이의 스프레드를 측정함으로써 변동성을 정량화합니다. 높은 가격과 낮은 가격 사이의 범위가 넓어지면 변동성이 증가합니다.
이 전략의 구체적인 논리는 다음과 같습니다.
- Chaikin 변동성 지표 (xROC_EMA) 를 계산합니다
- 트리거 문턱을 설정 (Trigger)
- xROC_EMA가 트리거 위에 넘어가면 길게; xROC_EMA가 트리거 아래에 넘어가면 짧게
- 역방향 거래 옵션
이점 분석
이 전략의 장점은 다음과 같습니다.
- 빠른 반응, 단기 거래에 적합
- 상대적으로 적은 적립, 일부 자본 관리 효과
- 적용이 간단하고 이해하기 쉽다
- 다양한 시장 환경에 대한 유연한 매개 변수 조정
위험 분석
또한 몇 가지 위험이 있습니다.
- 거래 빈도가 높으면 과잉 거래 위험이 증가합니다.
- 길이와 트리거와 같은 매개 변수는 오버 피팅 할 수 있습니다
- 거래가 역전될 때 손실에 취약하다
- 시장 소음을 효과적으로 필터 할 수 없습니다, 일부 잘못된 거래
해결책:
- 거래 빈도를 제어하기 위한 매개 변수를 조정
- 과도한 부착을 방지하기 위해 매개 변수를 최적화
- 더 넓은 정지점을 사용 하 여 일부 가격 리트레이싱을 허용
- 잘못된 신호를 줄이기 위해 필터를 추가합니다.
최적화
이 전략은 다음과 같이 개선될 수 있습니다.
- 트렌드 및 지원 수준을 식별하기 위한 구조 지표를 포함
- 부피와 이동 평균과 같은 필터를 추가하여 윙사브를 줄이십시오.
- 변화하는 시장 조건에 기초한 매개 변수들의 동적 조정
- 더 많은 수익을 확보하기 위해 트레일링 스톱 또는 캔들리어 출구와 같은 스톱 로스 메커니즘을 강화하십시오.
결론
이 전략은 단기 거래에 적합한 간단하고 명확한 논리를 가지고 있습니다. 유연한 매개 변수는 필요에 따라 조정 될 수 있습니다. 과잉 조정 및 높은 거래 빈도 위험이 있습니다. 추가 최적화는 더 안정적인 성능을 위해 전략을 더 견고하게 할 수 있습니다.
/*backtest
start: 2023-11-20 00:00:00
end: 2023-12-04 00:00:00
period: 3h
basePeriod: 15m
exchanges: [{"eid":"Futures_Binance","currency":"BTC_USDT"}]
*/

//@version = 2
////////////////////////////////////////////////////////////
//  Copyright by HPotter v1.0 01/12/2016
// Chaikin's Volatility indicator compares the spread between a security's
// high and low prices. It quantifies volatility as a widening of the range
// between the high and the low price.
// You can use in the xPrice1 and xPrice2 any series: Open, High, Low, Close, HL2,
// HLC3, OHLC4 and ect...
// You can change long to short in the Input Settings
// Please, use it only for learning or paper trading. Do not for real trading.
///////////////////////////////////////////////////////////
strategy(title="Chaikin Volatility Strategy Backtest")
Length = input(10, minval=1)
ROCLength = input(12, minval=1)
Trigger = input(0, minval=1)
reverse = input(false, title="Trade reverse")
hline(0, color=purple, linestyle=line)
hline(Trigger, color=red, linestyle=line)
xPrice1 = high
xPrice2 = low
xPrice = xPrice1 - xPrice2
xROC_EMA = roc(ema(xPrice, Length), ROCLength)
pos = iff(xROC_EMA < Trigger, 1,
	   iff(xROC_EMA > Trigger, -1, nz(pos[1], 0)))
possig = iff(reverse and pos == 1, -1,
         iff(reverse and pos == -1, 1, pos))
if (possig == 1)
    strategy.entry("Long", strategy.long)
if (possig == -1)
    strategy.entry("Short", strategy.short)
barcolor(pos == -1 ? red: pos == 1 ? green : blue )
plot(xROC_EMA, color=blue, title="Chaikin Volatility Strategy")
더 많은
- 양적 거래 가격 돌파 전략
- 에일러스 피셔 스토카스틱 상대적 활력 지수 전략
- 이중 추진력 돌파구 및 변동성 필터링 알고리즘 거래 전략
- 다중 이동 평균 포괄적 전략
- 가격 역전 RSI 컴보 전략
- 클라우드 네블러 이중 이동 평균 돌파 전략
- MACD 골든 크로스 데스 크로스 트렌드
- 거북이 추세를 따르는 전략
- 이중 확증 Donchian 채널 트렌드 전략
- 멀티 팩터 모델에 기반한 모멘트 역전 전략
- 이중 MA 크로스오버 트렌드 추적 전략
- 슈퍼 트렌드 트리플 전략
- 동적 트레일링 스톱 로스 전략
- 중동 평균 크로스오버 전략 (Stop Loss 및 Take Profit)
- 이동 평균에 기초한 평균 역전 역전 전략
- 볼링거 밴드 기반의 고주파 거래 전략
- 양적 이치모쿠 클라우드 거래 전략
- 이중 하위 파업 모델에 기초한 추진력 전략
- 스토카스틱 소용돌이 전략
- 변동성 지수와 스토카스틱 오시레이터에 기초한 다기간에 거래 전략