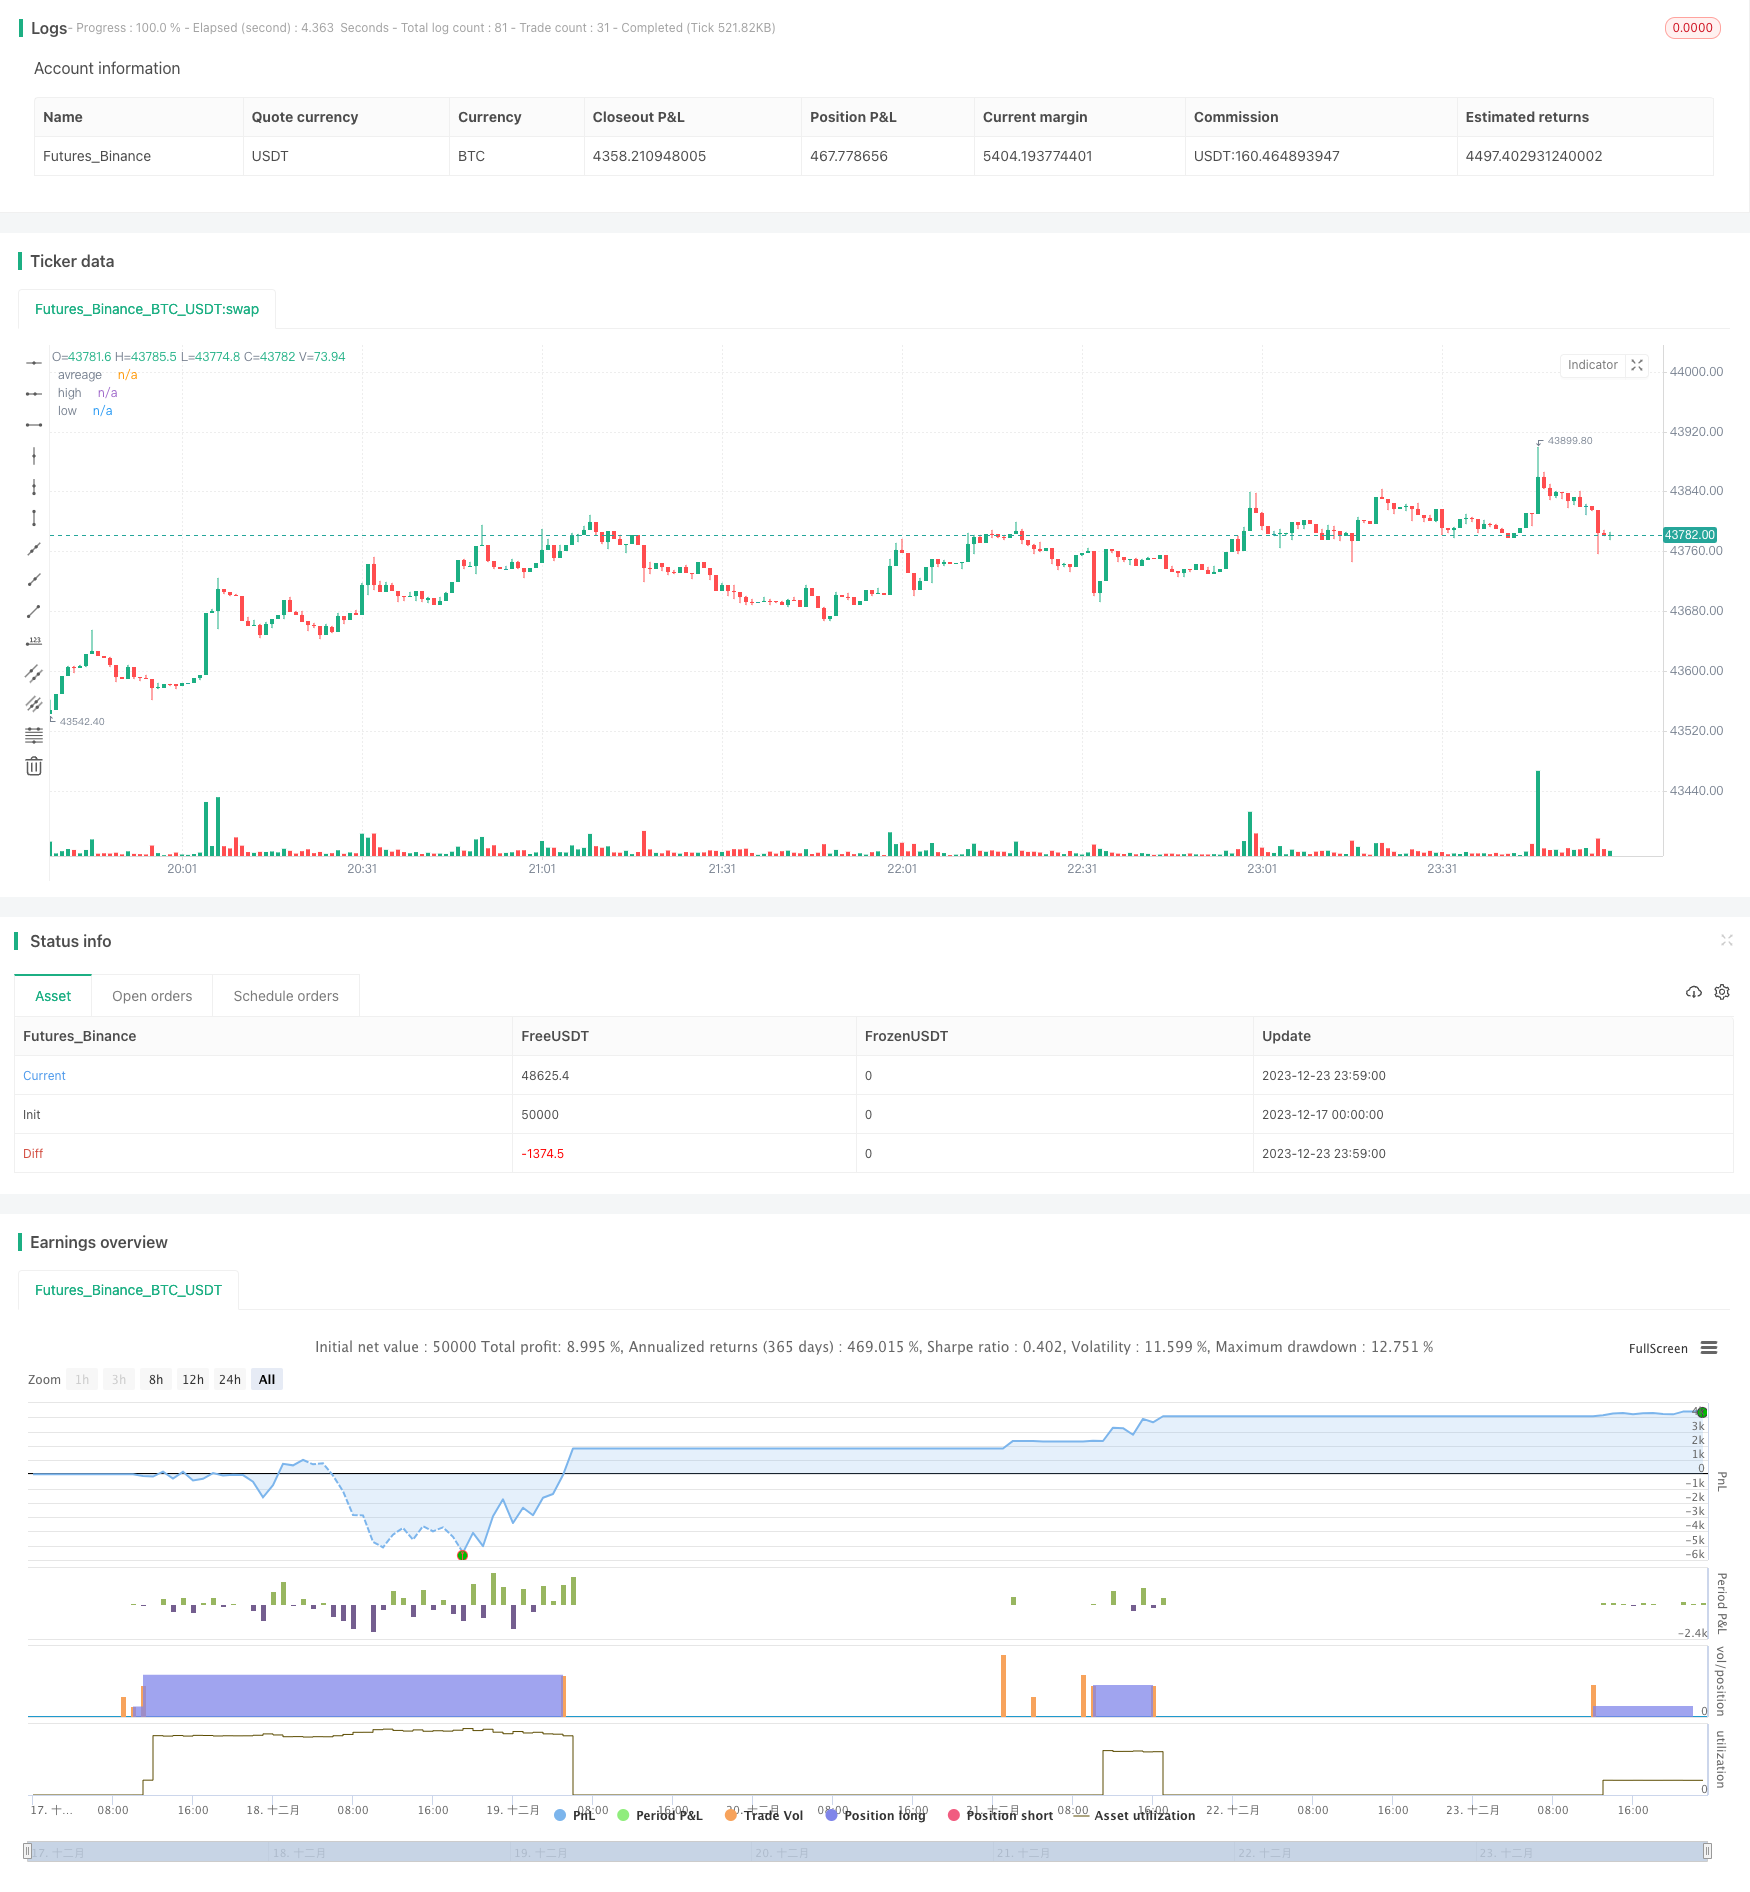
개요
이 전략은 상대적으로 강한 지수 ((RSI) 지표에 기반하여, RSI 낮은 지점에서 구매하고, 높은 지점에서 중지 손실을 막는 다중 트렌드 추적 거래 전략. RSI 지표가 초과 구매 라인보다 낮을 때 구매 신호를 생성하고, RSI 지표가 초과 판매 라인보다 높을 때 판매 신호를 생성합니다. 전략은 트렌드 추적의 성능을 최적화하여 거래 위험을 효과적으로 제어 할 수 있습니다.
전략 원칙
이 전략은 RSI 지표를 사용하여 주식 가격이 과대 평가되거나 과소 평가되었는지 판단합니다. RSI 지표는 오버 바이 오버 세일 라인을 결합하여 구매 및 판매 신호를 형성합니다. 구체적으로, RSI 지표 위에 20의 오버 세일 라인을 통과하면 구매 신호를 생성합니다.
다수 포지션에 진입한 후, 전략은 하향 위험을 제어하기 위해 초기 스톱 라인을 설정한다. 동시에 두 개의 다른 비율의 스톱 라인을 설정하고, 수익을 잠금하기 위해 스톱을 분할한다. 구체적으로, 먼저 50%의 포지션을 중지하고, 스톱 가격은 구매 가격의 3%입니다. 그리고 나머지 50%의 포지션을 중지하고, 스톱 가격은 구매 가격의 5%입니다.
이 전략은 RSI 지표를 사용하여 시장에 진입할 때를 간단하고 효과적으로 판단한다.
전략적 이점
- RSI를 이용해 빈자리를 판단하고, 맹목적으로 과잉을 피하십시오.
- RSI 지표의 매개 변수가 최적화되어 지표가 더 효과적입니다.
- 이중 정지 설계는 합리적이며, 더 많은 수익을 위해 정지 정지를 분할할 수 있습니다.
- 1차 및 연쇄상 손해배상금지
위험 분석
- “다중의 전략, 지속적인 수익성이 없는 황소 시장에서 좋지 않은 결과”
- RSI 지표가 잘못된 신호를 보내는 확률이 존재하며, 신호를 잘못 판단하면 손실이 증가할 수 있습니다.
- 스톱포인트가 너무 깊으면 멈출 수 없는 위험
- 상장 수와 비율에 대한 제한이 없어 손실이 커질 수 있습니다.
최적화 방향
- 다른 지표와 결합하여 RSI 신호를 필터링하여 신호의 정확도를 향상시킵니다.
- 상장 수와 비율에 대한 제한이 추가되었습니다.
- 다른 RSI 변수의 효과를 테스트합니다.
- 스톱포인트를 최적화하고 위험을 줄여라
요약하다
이 전략은 RSI 지표를 사용하여 상황을 판단하고, 스톱 스톱 손실 설치는 합리적입니다. 거래 추세를 효과적으로 판단하고, 거래 위험을 제어할 수 있으며, 다중 헤드 추적 전략으로 사용할 수 있습니다. 신호 필터링, 변수 테스트, 스톱 스톱 최적화 등의 방법으로 전략의 안정성을 더욱 향상시킬 수 있습니다.
/*backtest
start: 2023-12-17 00:00:00
end: 2023-12-24 00:00:00
period: 1m
basePeriod: 1m
exchanges: [{"eid":"Futures_Binance","currency":"BTC_USDT"}]
*/

// This source code is subject to the terms of the Mozilla Public License 2.0 at https://mozilla.org/MPL/2.0/

//@version=5

strategy(title='RSI Long Strategy', overlay=true, pyramiding=5, initial_capital=10000, default_qty_type=strategy.percent_of_equity, default_qty_value=100, calc_on_order_fills=false, slippage=0, commission_type=strategy.commission.percent, commission_value=0.075)
strat_dir_input = input.string(title='Strategy Direction', defval='long', options=['long', 'short', 'all'])
strat_dir_value = strat_dir_input == 'long' ? strategy.direction.long : strat_dir_input == 'short' ? strategy.direction.short : strategy.direction.all
strategy.risk.allow_entry_in(strat_dir_value)
//INPUTS


length = input(21)
overSold = input(20)
overBought = input(80)
p = close

vrsi = ta.rsi(p, length)
price = close
var bool long = na
var bool short = na

long := ta.crossover(vrsi, overSold)
short := ta.crossunder(vrsi, overBought)

var float last_open_long = na
var float last_open_short = na

last_open_long := long ? close : nz(last_open_long[1])
last_open_short := short ? close : nz(last_open_short[1])
mpoint=(last_open_long+last_open_short)/2

entry_value = last_open_long
entry_value1 = last_open_short

// Rounding levels to min tick
nround(x) =>
    n = math.round(x / syminfo.mintick) * syminfo.mintick
    n
//
disp_panels = input(true, title='Display info panels?')
fibs_label_off = input(40, title='fibs label offset')
fibs_label_size = input.string(size.normal, options=[size.tiny, size.small, size.normal, size.large, size.huge], title='fibs label size')
r1_x = timenow + math.round(ta.change(time) * fibs_label_off)
r1_y = last_open_short
text1 = 'High : ' + str.tostring(nround(last_open_short))
s1_y = last_open_long
text3 = 'low : ' + str.tostring(nround(last_open_long))

R1_label = disp_panels ? label.new(x=r1_x, y=r1_y, text=text1, xloc=xloc.bar_time, yloc=yloc.price, color=color.orange, style=label.style_label_down, textcolor=color.black, size=fibs_label_size) : na
S1_label = disp_panels ? label.new(x=r1_x, y=s1_y, text=text3, xloc=xloc.bar_time, yloc=yloc.price, color=color.lime, style=label.style_label_up, textcolor=color.black, size=fibs_label_size) : na

label.delete(R1_label[1])
label.delete(S1_label[1])
//
plot(mpoint, title='avreage', color=color.new(color.red, 40), style=plot.style_linebr, linewidth=3, trackprice=true, offset=-9999)
plot(last_open_short, title='high', color=color.new(color.red, 40), style=plot.style_linebr, linewidth=3, trackprice=true, offset=-9999)
plot(last_open_long, title='low', color=color.new(color.blue, 40), style=plot.style_linebr, linewidth=3, trackprice=true, offset=-9999)
//
trend = input(false)
if barstate.islast and trend == true
    line z = line.new(bar_index[1], last_open_short[1], bar_index, last_open_short, extend=extend.both, color=color.red, style=line.style_dashed, width=1)
    line f = line.new(bar_index[1], mpoint[1], bar_index, mpoint, extend=extend.both, color=color.blue, style=line.style_dashed, width=1)
    line w = line.new(bar_index[1], last_open_long[1], bar_index, last_open_long, extend=extend.both, color=color.green, style=line.style_dashed, width=1)
    line.delete(z[1])
    line.delete(f[1])
    line.delete(w[1])

//bu = ta.crossover(close, mpoint)
//sz = ta.crossunder(close, mpoint)
//bu1 = ta.crossover(close, last_open_short)
sz1 = ta.crossunder(close, last_open_short)
bu2 = ta.crossover(close, last_open_long)
//sz2 = ta.crossunder(close, last_open_long)
//plotshape(sz, style=shape.triangledown, location=location.abovebar, color=color.new(color.orange, 0), size=size.tiny)
//plotshape(bu, style=shape.triangleup, location=location.belowbar, color=color.new(color.blue, 0), size=size.tiny)
//plotshape(sz1, style=shape.triangledown, location=location.abovebar, color=color.new(color.red, 0), size=size.tiny)
//plotshape(bu1, style=shape.triangleup, location=location.belowbar, color=color.new(color.green, 0), size=size.tiny)
//plotshape(sz2, style=shape.triangledown, location=location.abovebar, color=color.new(color.red, 0), size=size.tiny)
//plotshape(bu2, style=shape.triangleup, location=location.belowbar, color=color.new(color.green, 0), size=size.tiny)

l = bu2
s = sz1
if l
    strategy.entry('buy', strategy.long)
if s
    strategy.entry('sell', strategy.short)
per(pcnt) =>
    strategy.position_size != 0 ? math.round(pcnt / 100 * strategy.position_avg_price / syminfo.mintick) : float(na)
stoploss = input.float(title=' stop loss', defval=5, minval=0.01)
los = per(stoploss)
q1 = input.int(title=' qty_percent1', defval=50, minval=1)
q2 = input.int(title=' qty_percent2', defval=50, minval=1)
tp1 = input.float(title=' Take profit1', defval=3, minval=0.01)
tp2 = input.float(title=' Take profit2', defval=5, minval=0.01)
//tp4 = input.float(title=' Take profit4', defval=5, minval=0.01)
strategy.exit('x1', qty_percent=q1, profit=per(tp1), loss=los)
strategy.exit('x2', qty_percent=q2, profit=per(tp2), loss=los)