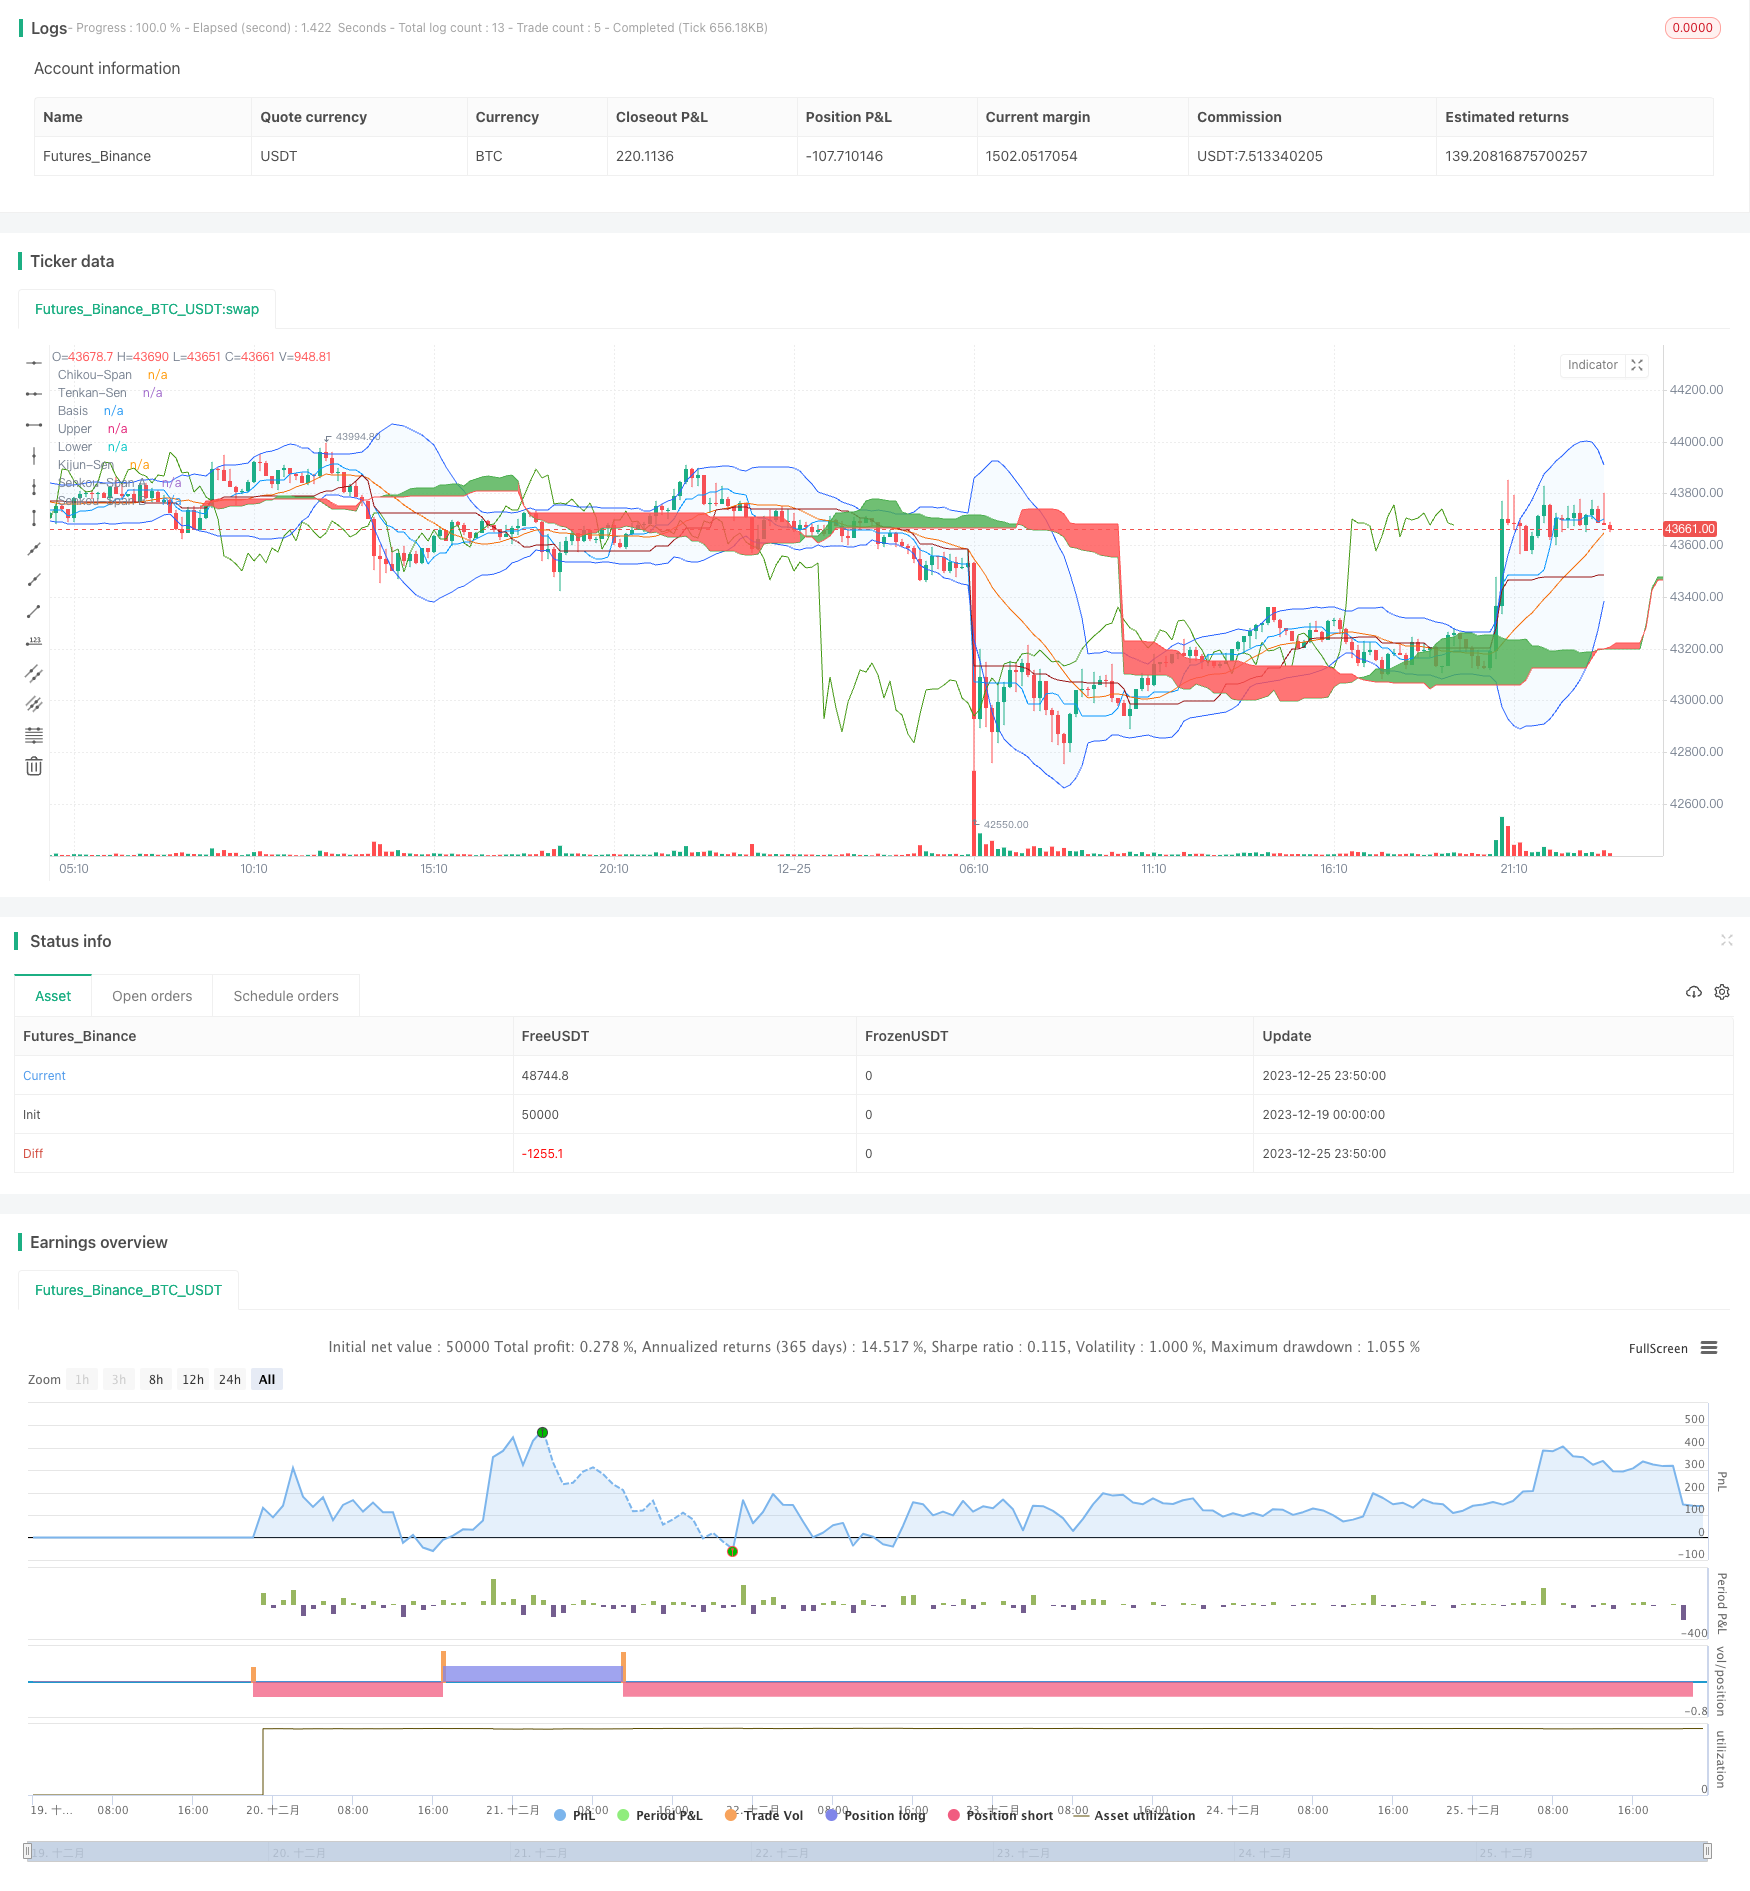
개요
이 전략은 일본 지표 일 구름 도표와 부린 띠 지표의 조합을 사용하여 거래 신호를 형성하여 다空 판단을 한다. 이 전략은 시장 추세를 효과적으로 판단하고 부린 띠 지표가 다空 신호를 발산할 때 판단을 하여 잘못된 거래를 방지할 수 있다.
전략 원칙
한 클라우드 도면은 변환선, 기준선, 지연선, 선행선으로 구성된다. 변환선은 9일 평균선, 기준선은 26일 평균선이다. 변환선이 기준선 위에 있을 때 다단계 신호이며, 반대로 허공 신호이다.
지연선은 가격의 지연 이동이다. 지연선은 위쪽에서 다단계 트렌드를 나타내며, 아래쪽은 공백이다.
구름띠는 두 개의 선행선으로 구성되어 있으며, 각각 52일 평균선과 26일 평균선의 평균값이다. 가격은 구름띠의 위쪽은 다단, 아래쪽은 공백으로 간주된다.
브린 지역은 n 일간 평균선과 표준 차로 구성되어 있으며, 주가 변동 지역이다. 가격이 상반대를 돌파 할 때 더 많이보고, 하반대를 돌파 할 때 더 많이 본다.
이 전략은 한 클라우드 그래프에서 다공간 신호를 발산할 때, 동시에 브린 대역의 돌파를 판단하여 거래 규칙을 형성한다. 예를 들어, 전환 라인이 위쪽으로 기준선을 돌파하고, 지연 라인이 위쪽으로, 가격이 클라우드 대역을 돌파하고, 브린 대역의 상단에 돌파할 때, 다공간 신호를 한다.
전략적 이점
한 구름 도표는 트렌드를 명확하게 판단하고, 전환선과 지연선은 단기 트렌드를 판단하고, 구름 띠는 중장기 트렌드 방향을 판단한다.
브린은 가격의 오차를 판단하여 불필요한 거래를 효과적으로 필터링 할 수 있습니다.
포트폴리오 지표, 거래 신호를 더 명확하고 신뢰할 수 있도록, 거래 위험을 피하십시오.
위험과 최적화
부린 밴드 파라미터를 잘못 설정하면 거래 신호가 정확하지 않을 수 있다. 각기 다른 기준에 따라 신중하게 파라미터를 설정해야 한다.
지분 비율을 적절하게 조정하여 위험을 통제하십시오. 지분 비율이 너무 커지면 손실이 확대 될 수 있습니다.
가격의 불리한 방향으로 운행될 때 특정 범위를 넘어서서 손실을 막는 전략이 고려될 수 있다.
더 많은 지표를 테스트할 수 있고, 클라우드 그래프와 결합하여 더 신뢰할 수 있는 거래 전략을 만들 수 있습니다.
요약하다
이 전략은 트렌드 방향을 판단하는 클라우드 그래프를 효과적으로 활용하고 브린 밴드 지표 필터링 신호. 전략 신호는 명확하고 신뢰할 수 있으며, 매개 변수 조정 및 스톱 로즈 최적화를 통해 거래 위험을 줄이고 더 나은 수익을 얻을 수 있습니다.
/*backtest
start: 2023-12-19 00:00:00
end: 2023-12-26 00:00:00
period: 10m
basePeriod: 1m
exchanges: [{"eid":"Futures_Binance","currency":"BTC_USDT"}]
*/

// This source code is subject to the terms of the Mozilla Public License 2.0 at https://mozilla.org/MPL/2.0/
// © Coinrule

//@version=5
strategy("Ichimoku Cloud and Bollinger Bands",
         overlay=true,
         initial_capital=1000,
         process_orders_on_close=true,
         default_qty_type=strategy.percent_of_equity,
         default_qty_value=30,
         commission_type=strategy.commission.percent,
         commission_value=0.1)

showDate = input(defval=true, title='Show Date Range')
timePeriod = true
notInTrade = strategy.position_size <= 0


//Ichimoku Cloud
//Inputs
ts_bars = input.int(9, minval=1, title="Tenkan-Sen Bars")
ks_bars = input.int(26, minval=1, title="Kijun-Sen Bars")
ssb_bars = input.int(52, minval=1, title="Senkou-Span B Bars")
cs_offset = input.int(26, minval=1, title="Chikou-Span Offset")
ss_offset = input.int(26, minval=1, title="Senkou-Span Offset")
long_entry = input(true, title="Long Entry")
short_entry = input(true, title="Short Entry")

middle(len) => math.avg(ta.lowest(len), ta.highest(len))

// Components of Ichimoku Cloud
tenkan = middle(ts_bars)
kijun = middle(ks_bars)
senkouA = math.avg(tenkan, kijun)
senkouB = middle(ssb_bars)

// Plot Ichimoku Cloud
plot(tenkan, color=#0496ff, title="Tenkan-Sen")
plot(kijun, color=#991515, title="Kijun-Sen")
plot(close, offset=-cs_offset+1, color=#459915, title="Chikou-Span")
sa=plot(senkouA, offset=ss_offset-1, color=color.green, title="Senkou-Span A")
sb=plot(senkouB, offset=ss_offset-1, color=color.red, title="Senkou-Span B")
fill(sa, sb, color = senkouA > senkouB ? color.green : color.red, title="Cloud color")

ss_high = math.max(senkouA[ss_offset-1], senkouB[ss_offset-1])
ss_low = math.min(senkouA[ss_offset-1], senkouB[ss_offset-1])

// Entry/Exit Conditions
tk_cross_bull = tenkan > kijun
tk_cross_bear = tenkan < kijun
cs_cross_bull = ta.mom(close, cs_offset-1) > 0
cs_cross_bear = ta.mom(close, cs_offset-1) < 0
price_above_kumo = close > ss_high
price_below_kumo = close < ss_low


//Bollinger Bands Indicator
length = input.int(20, minval=1)
src = input(close, title="Source")
mult = input.float(2.0, minval=0.001, maxval=50, title="StdDev")
basis = ta.sma(src, length)
dev = mult * ta.stdev(src, length)
upper = basis + dev
lower = basis - dev
offset = input.int(0, "Offset", minval = -500, maxval = 500)
plot(basis, "Basis", color=#FF6D00, offset = offset)
p1 = plot(upper, "Upper", color=#2962FF, offset = offset)
p2 = plot(lower, "Lower", color=#2962FF, offset = offset)
fill(p1, p2, title = "Background", color=color.rgb(33, 150, 243, 95))

bullish = tk_cross_bull and cs_cross_bull and price_above_kumo and ta.crossover(lower, close)
bearish = tk_cross_bear and cs_cross_bear and price_below_kumo and ta.crossover(close, lower)

strategy.entry('Long', strategy.long, when=bullish and long_entry and timePeriod)
strategy.close('Long', when=bearish and not short_entry)

strategy.entry('Short', strategy.short, when=bearish and short_entry and timePeriod)
strategy.close('Short', when=bullish and not long_entry)


//Works well on BTC 30m/1h (11.29%), ETH 2h (29.05%), MATIC 2h/30m (37.12%), AVAX 1h/2h (49.2%), SOL 45m (45.43%)