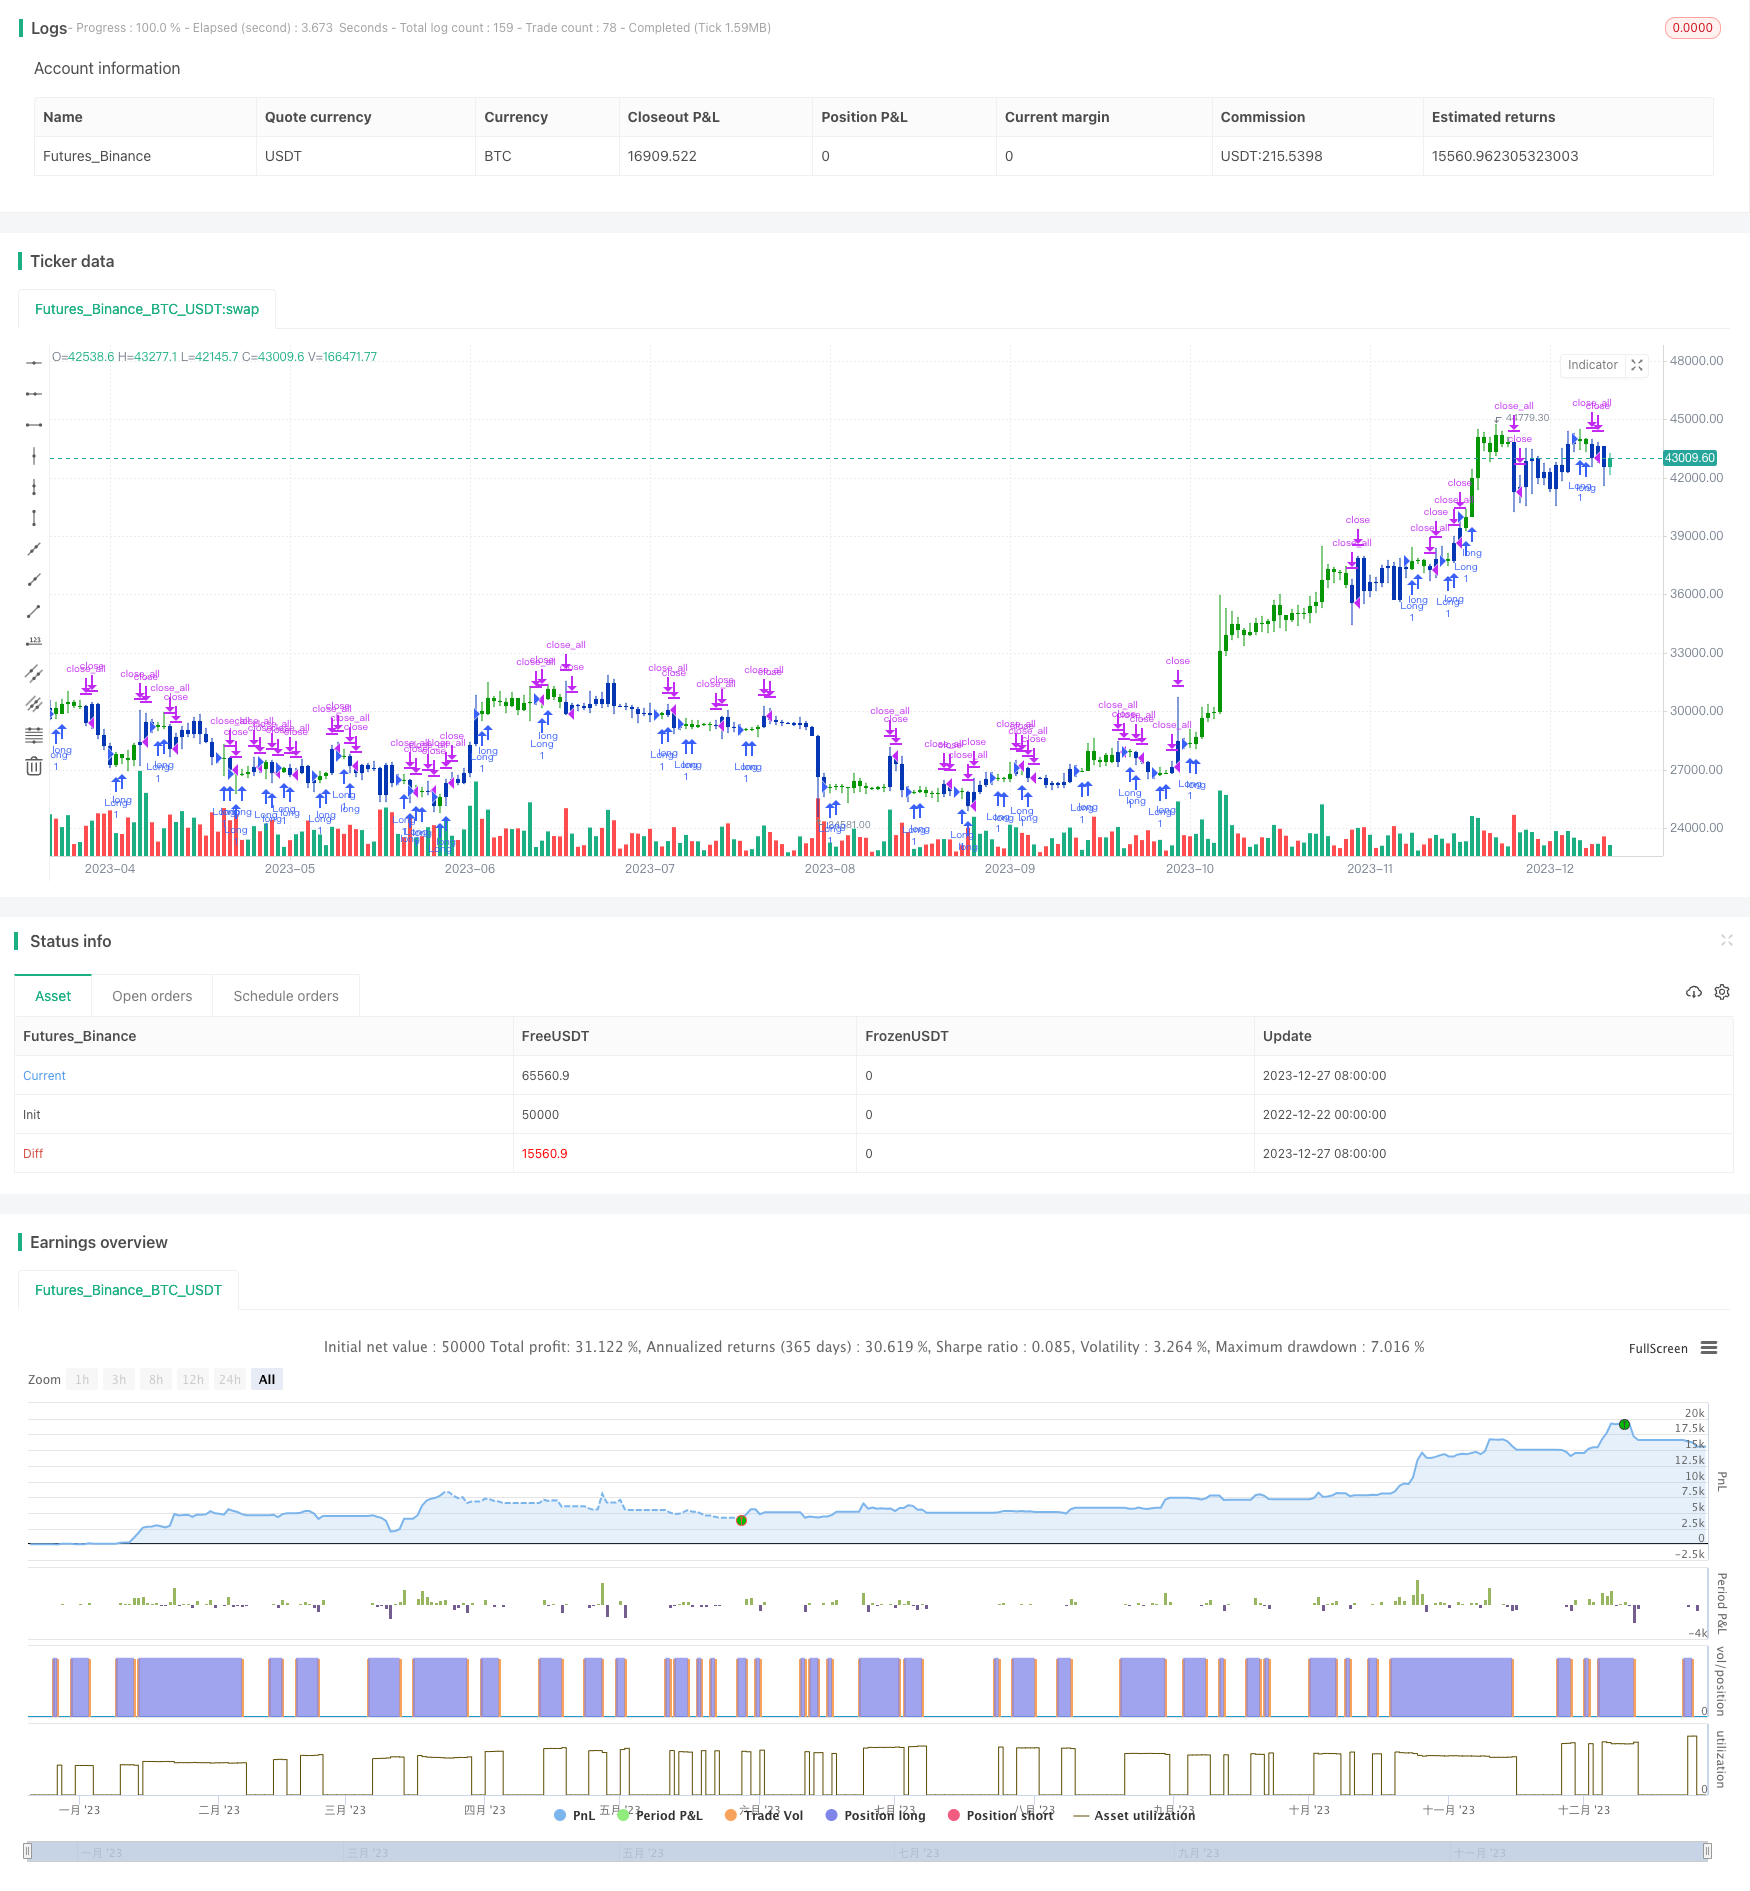
양적 이중 지표 전략
저자:차오장, 날짜: 2023-12-29 16:29:21태그:

전반적인 설명
이 전략은 이중 EMA 지표와 불 파워 지표를 기반으로 한 조합 전략입니다. 전략 이름에는 양적 및 이중 지표와 같은 키워드가 포함되어 있으며 두 개의 독립적인 지표를 사용하는 특징을 강조합니다.
전략 논리
이 전략은 두 부분으로 구성됩니다.
-
2/20 EMA 지표. 이 지표는 2일 및 20일 EMA를 계산합니다. 가격이 EMA를 넘을 때 구매 신호를 생성하고 가격이 EMA를 넘을 때 판매 신호를 생성합니다.
-
올 파워 인디케이터. 이 인디케이터는 현재 바와 이전 바의 관계를 기반으로 올파워/하파워를 계산합니다. 올파워/하파워가 임계치를 초과하면 거래 신호를 생성합니다.
두 부분
이점 분석
- 가짜 신호를 필터링하기 위해 지표를 결합한다. 단일 지표는 가짜 신호를 생성하는 외부 요인에 의해 영향을받을 가능성이 있다. 이중 지표 조합은 서로를 확인하고 가짜 신호를 필터링하여 신호 품질을 향상시킬 수 있다.
- 사용자 정의 가능한 매개 변수: EMA 기간과 Bull Power의 문턱은 다른 시장 환경에 적응하도록 사용자 정의 할 수 있습니다.
- 단순하고 명확한 논리. 전략은 단순하고 명확한 논리를 가진 두 가지 공통 지표를 사용합니다. 이해하기 쉽고 실행하기 쉽습니다.
위험 분석
- 지표 실패 위험: 조합 지표를 사용함에도 불구하고 극한 시장 조건은 여전히 지표 실패를 유발할 수 있습니다.
- 매개 변수 최적화 위험. 부적절한 매개 변수 설정은 전략 성능을 약화시키는 불충분하거나 과도한 거래로 이어질 수 있습니다. 최적 매개 변수를 찾기 위해 충분한 테스트가 필요합니다.
최적화 방향
- 스톱 손실 메커니즘을 추가합니다. 단일 거래 손실을 제어하기 위해 이동 또는 룩백 스톱 손실을 설정합니다.
- 매개 변수 설정을 최적화합니다. 더 나은 성능을 위해 최적의 매개 변수를 찾기 위해 다른 매개 변수 조합을 테스트합니다.
- 필터링 조건을 추가합니다. 거래량이나 변동성 같은 조건을 추가하여 포지션을 열 때 비정상적인 시장 조건을 필터합니다.
결론
이 전략은 이중 EMA와 불 파워 지표를 결합하여 거래 결정을 실현합니다. 단일 지표 전략과 비교하면 이 조합은 사용자 정의 가능한 매개 변수를 유지하면서 가짜 신호를 효과적으로 제거합니다. 결론적으로이 전략은 양적 거래 전략으로서 단순함과 유연성 및 강력한 실용성을 갖추고 있습니다.
/*backtest
start: 2022-12-22 00:00:00
end: 2023-12-28 00:00:00
period: 1d
basePeriod: 1h
exchanges: [{"eid":"Futures_Binance","currency":"BTC_USDT"}]
*/

//@version=5
////////////////////////////////////////////////////////////
//  Copyright by HPotter v1.0 12/07/2022
// This is combo strategies for get a cumulative signal.
//
// First strategy
// This indicator plots 2/20 exponential moving average. For the Mov
// Avg X 2/20 Indicator, the EMA bar will be painted when the Alert criteria is met.
//
// Second strategy
//  Bull Power Indicator
//  To get more information please see "Bull And Bear Balance Indicator"
//  by Vadim Gimelfarb.
//
// WARNING:
// - For purpose educate only
// - This script to change bars colors.
////////////////////////////////////////////////////////////
EMA20(Length) =>
    pos = 0.0
    xPrice = close
    xXA = ta.ema(xPrice, Length)
    nHH = math.max(high, high[1])
    nLL = math.min(low, low[1])
    nXS = nLL > xXA or nHH < xXA ? nLL : nHH
    iff_1 = nXS < close[1] ? 1 : nz(pos[1], 0)
    pos := nXS > close[1] ? -1 : iff_1
    pos


BP(SellLevel) =>
    pos = 0.0
    value = close < open ?
             close[1] < open ?  math.max(high - close[1], close - low): math.max(high - open, close - low):
              close > open ?
               close[1] > open ?  high - low : math.max(open - close[1], high - low) :
                 high - close > close - low ?
                  close[1] < open ? math.max(high - close[1], close - low) : high - open :
                   high - close < close - low ?
                     close[1] > open ?  high - low : math.max(open - close, high - low) :
                      close[1] > open ? math.max(high - open, close - low) :
                       close[1] < open? math.max(open - close, high - low): high - low
    val2 = ta.sma(value, 15)
    pos :=  val2 > SellLevel ? 1 : -1
    pos

strategy(title='Combo 2/20 EMA & Bull Power', shorttitle='Combo', overlay=true)
var I1 = '●═════ 2/20 EMA ═════●'
Length = input.int(14, minval=1, group=I1)
var I2 = '●═════  Bull Power ═════●'
SellLevel = input.float(-15, step=0.01, group=I2)
var misc = '●═════ MISC ═════●'
reverse = input.bool(false, title='Trade reverse', group=misc)
var timePeriodHeader = '●═════ Time Start ═════●'
d = input.int(1, title='From Day', minval=1, maxval=31, group=timePeriodHeader)
m = input.int(1, title='From Month', minval=1, maxval=12, group=timePeriodHeader)
y = input.int(2005, title='From Year', minval=0, group=timePeriodHeader)
StartTrade = time > timestamp(y, m, d, 00, 00) ? true : false
posEMA20 = EMA20(Length)
prePosBP = BP(SellLevel)
iff_1 = posEMA20 == -1 and prePosBP == -1 and StartTrade ? -1 : 0
pos = posEMA20 == 1 and prePosBP == 1 and StartTrade ? 1 : iff_1
iff_2 = reverse and pos == -1 ? 1 : pos
possig = reverse and pos == 1 ? -1 : iff_2
if possig == 1
    strategy.entry('Long', strategy.long)
if possig == -1
    strategy.entry('Short', strategy.short)
if possig == 0
    strategy.close_all()
barcolor(possig == -1 ? #b50404 : possig == 1 ? #079605 : #0536b3)
더 많은
- BankNifty 슈퍼트렌드 거래 전략
- 과도한 구역 전략
- 트래일링 스톱 손실 이중 이동 평균 전략
- 멀티 타임프레임 모멘텀 브레이크업 전략
- 중추점 골든 비율 구매 높은 판매 낮은 전략
- 단순한 이동 평균에 기초한 거북이 거래 전략
- 이중 이동 평균 볼링거 대역 MACD 거래 전략
- 볼링거 밴드 및 RSI 크로스오버 전략
- QQE와 MA에 기반한 전략을 따르는 경향
- 부피 가중된 평균 가격 전략
- 모멘텀 추적 전략
- RSI 인디케이터 개선 거래 전략
- 트렌드 역전 동력 지표 크로스오버 추적 전략
- 멀티 타임프레임 브레이크업 전략
- 동력 및 현금 흐름을 전환하는 전략
- 트렌드 전략에 따라 동적 수익
- 10EMA 이중 횡단 트렌드 추적 전략
- 동적 회전점 역시험 전략
- 이중 EMA 크로스오버 트렌드 전략
- 앵커링 CVDVWAP 신호 전략