단순한 이동 평균에 기초한 거북이 거래 전략
저자:차오장, 날짜: 2023-12-29 16:45:51태그:

전반적인 설명
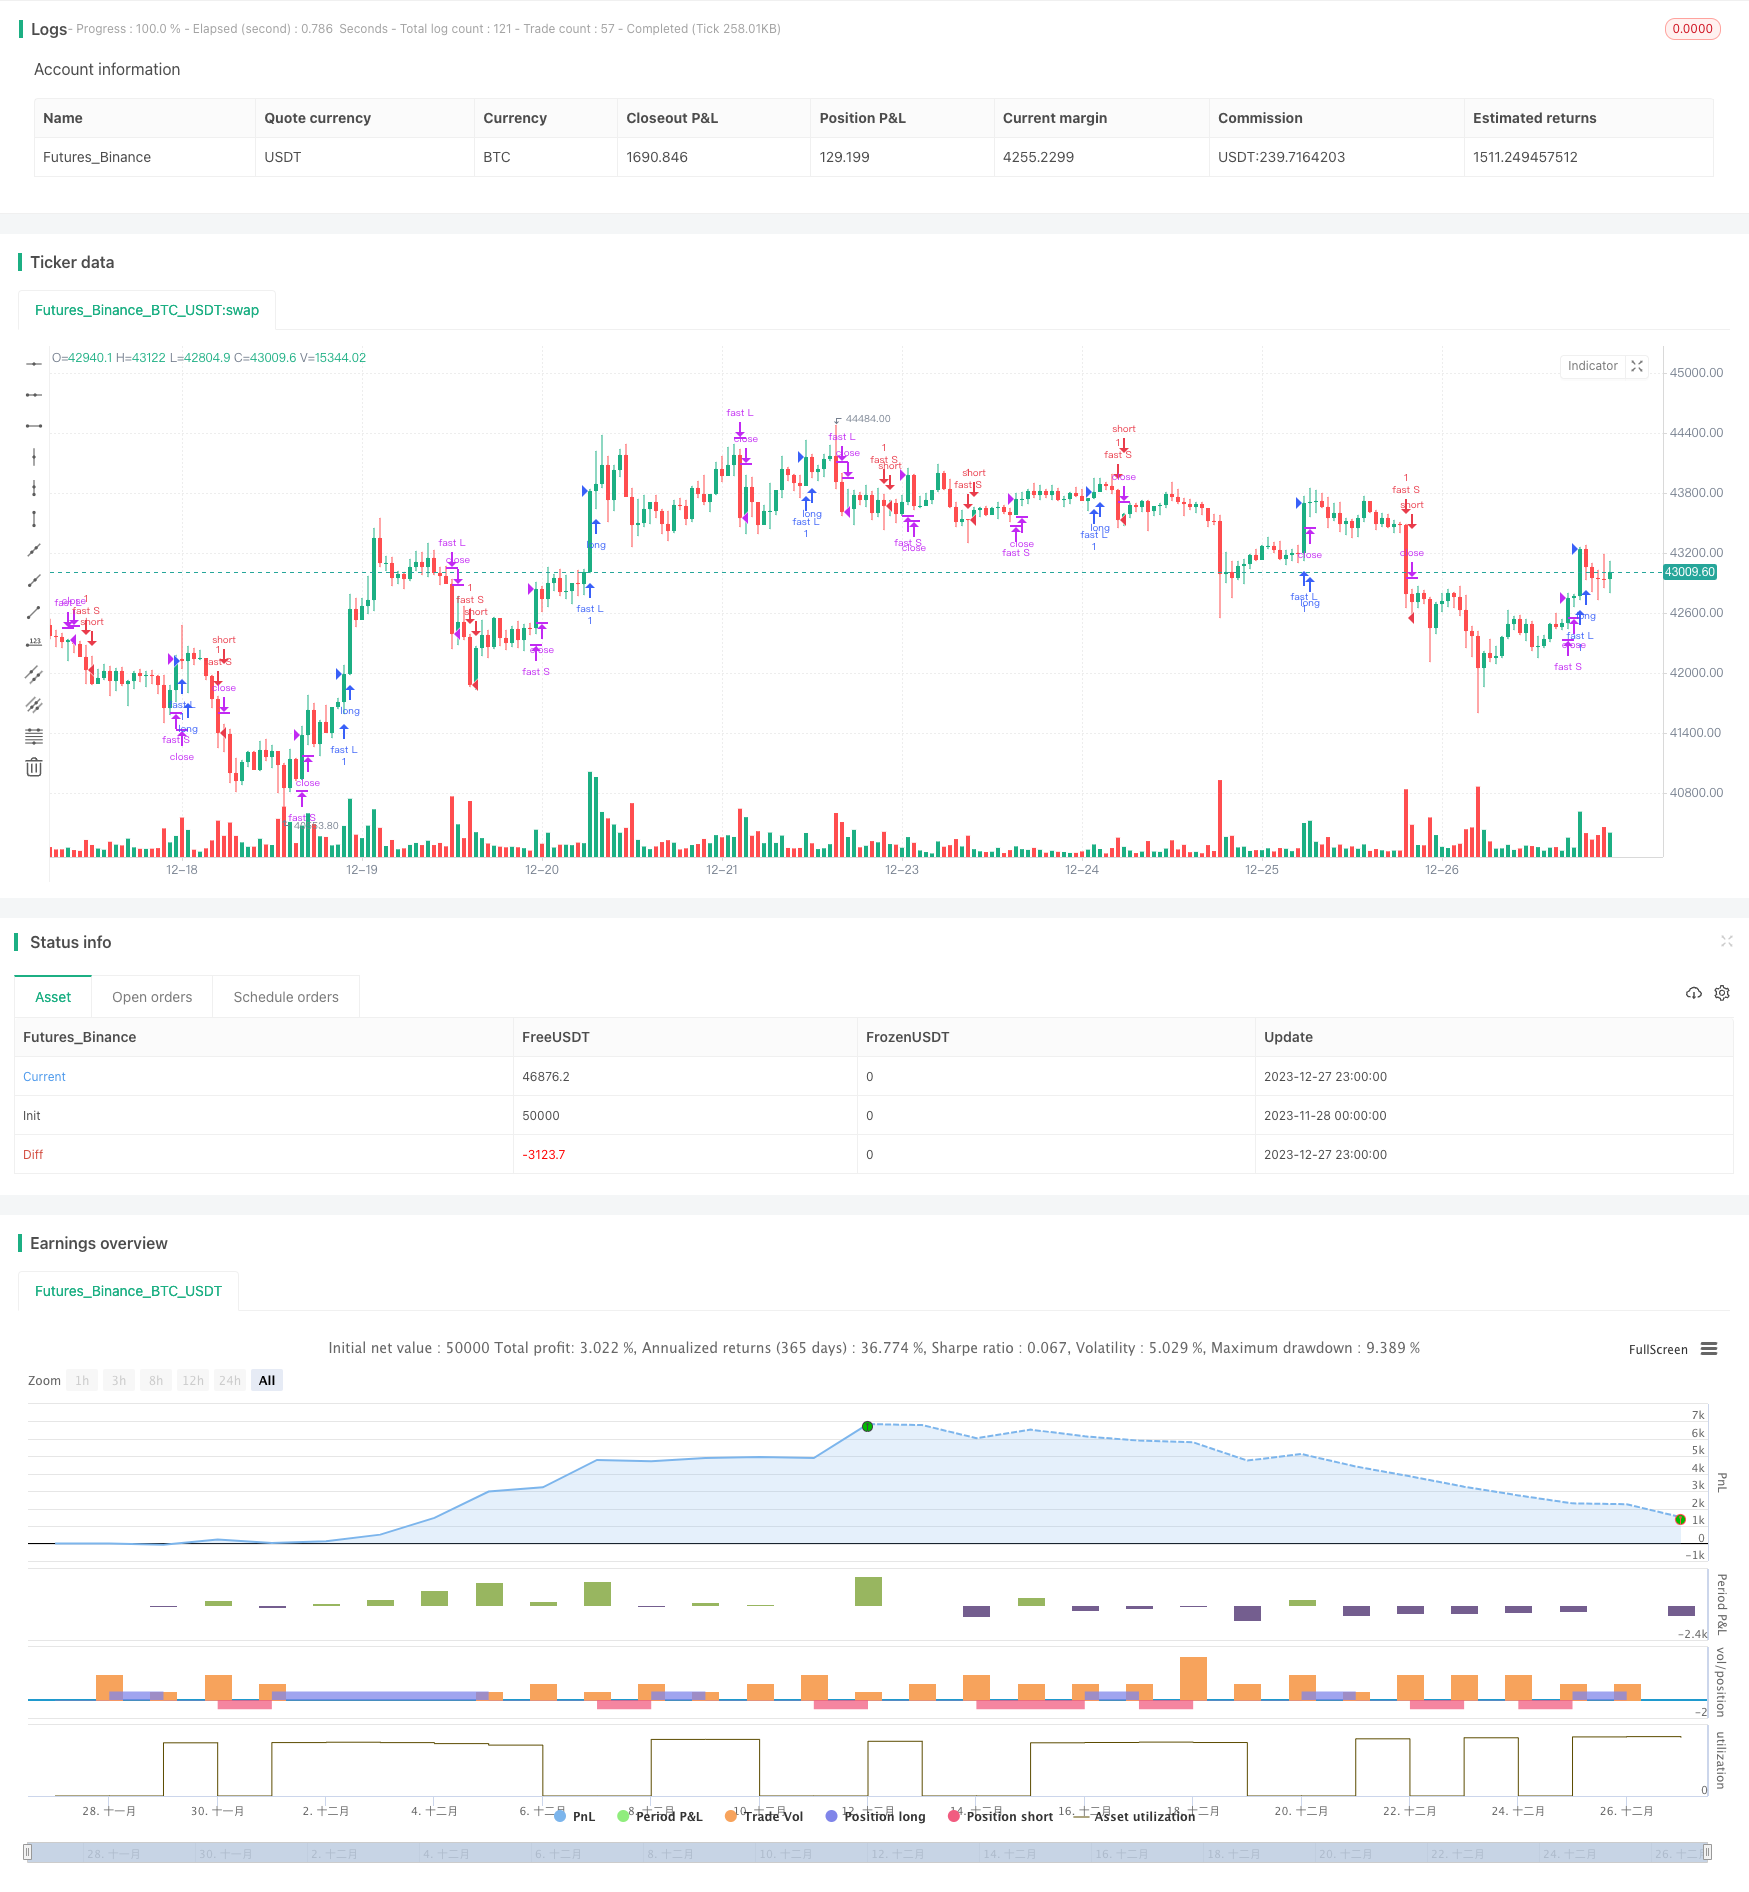
이 전략은 다른 매개 변수와 간단한 이동 평균의 두 그룹을 계산하고 포지션을 열고 닫는 신호로 사용하여 수익을 창출합니다. 이 전략은 1983년 미국 거래자 리처드 데니스에 의해 처음 제안되었습니다. 간단한 규칙을 따라 안정적인 수익을 얻었으며 커티스 피스 (Curtis Faith) 에 의해 널리 알려졌습니다.
원칙
이 전략은 동시에 두 그룹의 빠른 라인과 느린 라인을 계산한다. 빠른 라인 매개 변수는 포지션을 열고 10 일로 설정된다. 느린 라인 매개 변수는 각각 55 일과 20 일이다. 가격이 빠른 라인의 오픈 기간의 가장 높은 값을 넘으면 긴 신호를 유발한다. 가격이 빠른 라인의 오픈 기간의 가장 낮은 값 아래로 떨어지면 짧은 신호를 유발한다. 마찬가지로 가격이 빠른 라인의 폐쇄 기간의 가장 낮은 값 아래로 떨어지면 긴 포지션을 닫는다. 가격이 빠른 라인의 폐쇄 기간의 가장 높은 값을 넘으면 짧은 포지션을 닫는다. 느린 라인은 빠른 라인과 같은 열고 닫는 논리를 가지고 있다.
이 전략은 수익을 창출하기 위해 이동 평균 이론에 의존합니다. 즉, 단기 이동 평균이 장기 평균을 넘을 때 상승 신호로 간주됩니다. 아래를 넘을 때 하락 추세를 나타냅니다. 이 전략의 빠르고 느린 선은 비슷한 역할을합니다.
장점
- 단순하고 명확한 규칙, 이해하기 쉽고 적용하기 쉽고 초보자에도 적합합니다.
- 포지션 개설 및 폐쇄에 대한 명확한 기준, 빈번한 거래를 피하는 것
- 빠르고 느린 이중 이동 평균을 결합하면 가격 변동이 완화되고 더 명확한 거래 신호가 생성됩니다.
- 여러 매개 변수 집합을 사용하는 것은 위험을 통제하고 잘못된 거래를 방지하는데 도움이 됩니다.
- 장기적으로 안정적인 수익이 생생한 거래에서 검증됩니다.
위험 및 완화
- 전략 자체는 기계적이고 특별한 시장 조건에 대한 판단을 할 수 없으며 따라서 이익 제한이 있습니다.
- 의사결정을 돕기 위해 더 많은 지표 또는 기계 학습 모델을 통합하려는 시도
- 지연 지표로서 이동 평균은 약간의 지연 시간을 가지고 있습니다.
- 개장 및 폐쇄 기간을 적절하게 단축
- 최대 수요를 제한할 수 없습니다.
- 스톱 로스 포인트를 설정
최적화 방향
- 최대 마이너운드를 제어하기 위해 스톱 손실 모듈을 추가합니다.
- 신호를 필터링하기 위해 다른 지표를 포함
- 동적으로 이동 평균 매개 변수를 조정
- 비정상적인 데이터의 영향을 제거 하기 위해 데이터 처리 모듈을 추가
- 추세를 결정하기 위해 기계 학습 모델을 통합
요약
이것은 전형적인 트렌드-추천 전략이다. 간단한 이중 이동 평균을 기반으로 거래 규칙을 설정하고 시장 트렌드를 추적함으로써 안정적인 수익을 달성합니다. 전략은 명확한 오픈 신호와 라이브 트레이딩에서 장기적으로 검증 된 수익으로 이해하고 구현하기가 쉽습니다. 이는 초보자가 배우고 연구하는 데 매우 적합합니다. 또한 더 복잡한 양적 거래의 기초를 마련합니다. 추가 최적화는 더 나은 성과로 이어질 수 있습니다.
/*backtest
start: 2023-11-28 00:00:00
end: 2023-12-28 00:00:00
period: 1h
basePeriod: 15m
exchanges: [{"eid":"Futures_Binance","currency":"BTC_USDT"}]
*/

//@version=2
//coded by tmr0
//original idea from «Way of the Turtle: The Secret Methods that Turned Ordinary People into Legendary Traders» (2007) CURTIS FAITH
strategy("20 years old Turtles strategy by tmr0", shorttitle = "Turtles", overlay=true)

enter_fast = input(20, minval=1)
exit_fast = input(10, minval=1)
enter_slow = input(55, minval=1)
exit_slow = input(20, minval=1)

fastL = highest(enter_fast)
fastLC = lowest(exit_fast)
fastS = lowest(enter_fast)
fastSC = highest(exit_fast)

slowL = highest(enter_slow)
slowLC = lowest(exit_slow)
slowS = lowest(enter_slow)
slowSC = highest(exit_slow)

enterL1 = high > fastL[1]
exitL1 = low <= fastLC[1]
enterS1 = low < fastS[1]
exitS1 = high >= fastSC[1]

enterL2 = high > slowL[1]
exitL2 = low <= slowLC[1]
enterS2 = low < slowS[1]
exitS2 = high >= slowSC[1]


//bgcolor(exitL1 or exitL2? red: enterL1 or enterL2? navy:white)

strategy.entry("fast L", strategy.long, when = enterL1)
strategy.entry("fast S", strategy.short, when = enterS1)
strategy.close("fast L", when = exitL1)
strategy.close("fast S", when = exitS1)

strategy.entry("slow L", strategy.long, when = enterL2)
strategy.entry("slow S", strategy.short, when = enterS2)
strategy.close("slow L", when = exitL2)
strategy.close("slow S", when = exitS2)
//zl=0
//z=strategy.netprofit / 37 * koef  //ежемесячная прибыль
//z=strategy.grossprofit/strategy.grossloss
//z1=plot (z, style=line, linewidth=3, color = z>zl?green:red, transp = 30)
//hline(zl, title="Zero", linewidth=1, color=gray, linestyle=dashed)
- 이동평균의 9가지 유형의 크로스오버 전략
안 OKX 영구 자동 헤딩 - 전략에 따른 동적 파업 추세
- 칼만 필터와 평균 반전을 기반으로 한 변동 비율 거래 전략
- 역선형 회귀 전략
- BankNifty 슈퍼트렌드 거래 전략
- 과도한 구역 전략
- 트래일링 스톱 손실 이중 이동 평균 전략
- 멀티 타임프레임 모멘텀 브레이크업 전략
- 중추점 골든 비율 구매 높은 판매 낮은 전략
- 이중 이동 평균 볼링거 대역 MACD 거래 전략
- 볼링거 밴드 및 RSI 크로스오버 전략
- QQE와 MA에 기반한 전략을 따르는 경향
- 부피 가중된 평균 가격 전략
- 양적 이중 지표 전략
- 모멘텀 추적 전략
- RSI 인디케이터 개선 거래 전략
- 트렌드 역전 동력 지표 크로스오버 추적 전략
- 멀티 타임프레임 브레이크업 전략
- 동력 및 현금 흐름을 전환하는 전략