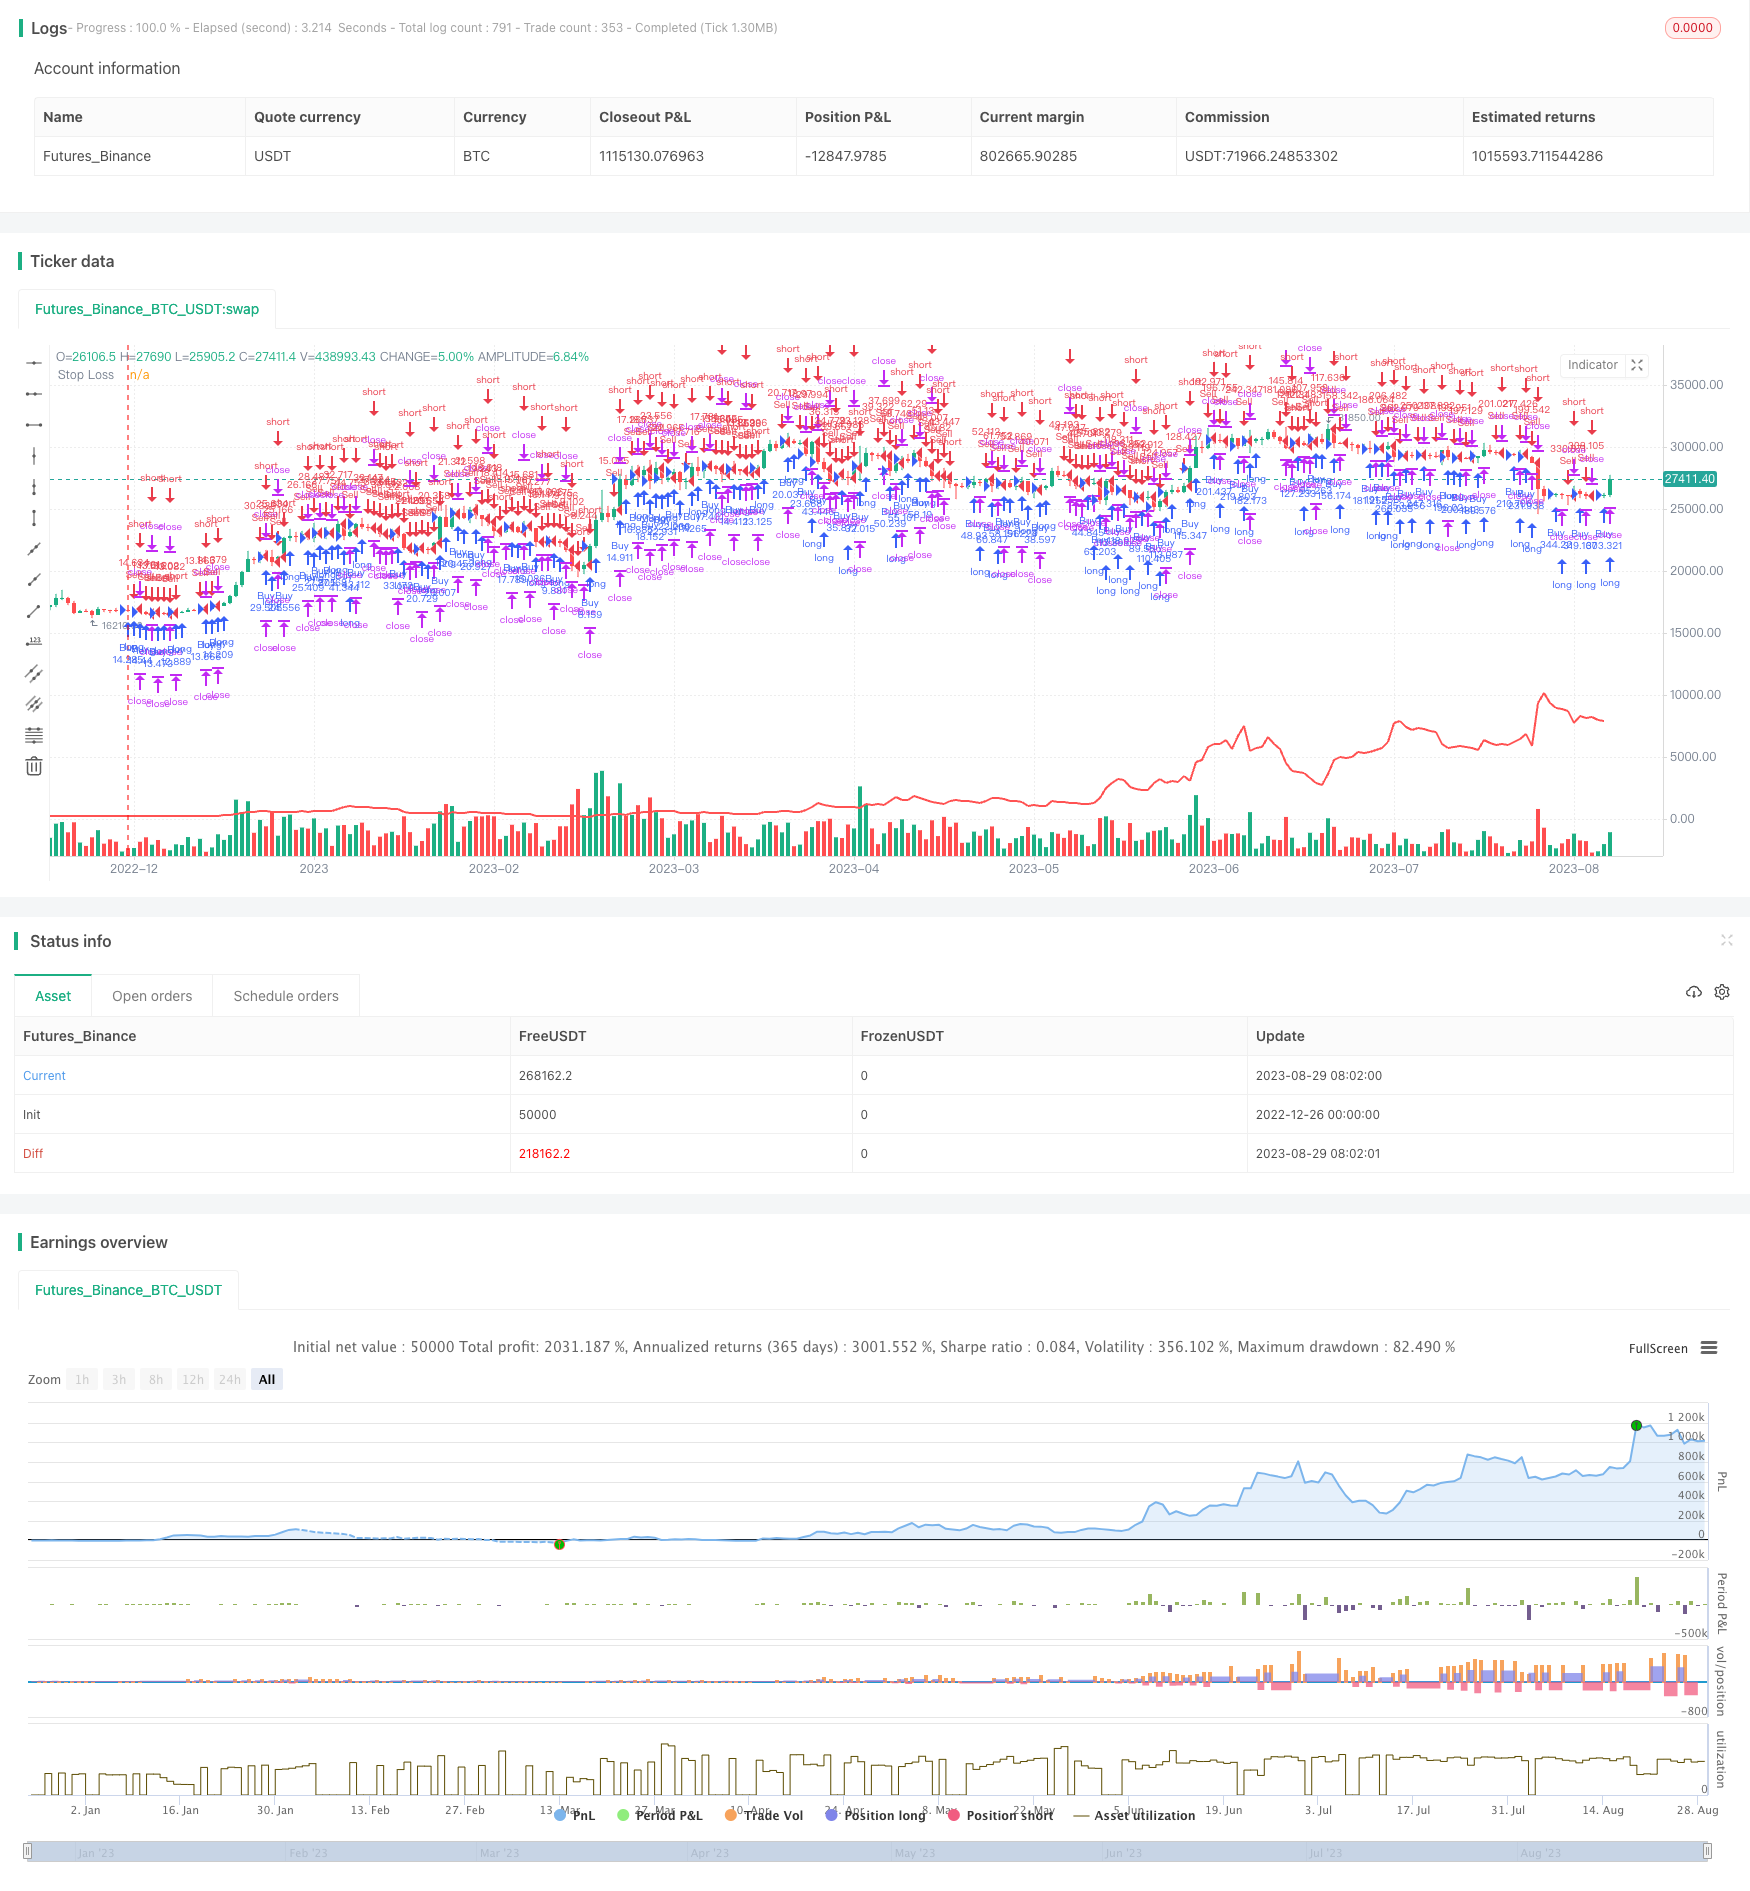
매일의 탈출 전략
저자:차오장, 날짜: 2024-01-02 13:57:42태그:

전반적인 설명
일일 브레이크아웃 전략은 일일 촛불 차트에 기반한 간단한 트렌드 다음 전략입니다. 시장 동력을 결정하기 위해 전날의 개장 및 폐쇄 가격 사이의 관계를 관찰하여 거래 신호를 생성합니다.
전략 논리
이 전략의 핵심 논리는 다음과 같습니다.
만약 전날의 촛불이 초록색이라면 (폐기 가격은 개장 가격보다 높습니다), 그것은 그 날 상승 추세를 나타냅니다. 전략은 다음 날의 개시에 장거리 될 것입니다. 만약 전날의 촛불이 빨간색이라면 (폐기 가격은 개장 가격보다 낮습니다), 그것은 하락 추세를 나타냅니다. 전략은 다음 날의 개시에 짧게 갈 것입니다.
이 간단한 방법으로, 전략은 최근 한 촛불 사이클 내에서 시장의 동력을 식별하고 그에 따라 거래를 할 수 있습니다. 이것은 전략이 최신 시장 추세를 따라 할 수 있습니다.
특히 전략은 다음과 같이 거래 신호를 생성합니다.
- 매일 오픈 시장에서 이전 거래 날의 촛불 데이터를 얻으십시오
- 그 촛불의 열기와 닫기 가격을 비교하십시오.
- 오픈 < 닫는 경우 (녹색 촛불), 긴 신호를 생성, 사용 가능한 자금의 비율에 긴 이동
- 오픈 > 닫는 경우 (붉은 촛불), 짧은 신호를 생성, 사용 가능한 자금의 비율에 짧은 이동
- 출구 포지션에 스톱 로스를 사용
이 논리를 통해 전략은 단기 가격 동향을 활용할 수 있습니다.
장점
이 전략의 주요 장점은 다음과 같습니다.
- 단순함- 핵심 논리는 직접 촛불의 색을 비교하고 매우 간단하고 명확합니다.
- 추세- 그것은 짧은 기간의 동력을 따라 마지막 거래일의 경향 방향을 식별합니다.
- 유연성- 포지션 크기와 같은 매개 변수, 스톱 로스는 리스크 대 보상으로 조정할 수 있습니다.
- 최적화 가능성- 더 많은 개선 사항이 추가될 수 있습니다. 여러 시간 프레임 분석과 안정성을 향상시키기 위해 데이터 적합성 같은 것들이요.
위험 과 개선
몇 가지 위험과 개선 영역:
- 윙사 위험- 그것은 단지 매일 촛불을 볼 수 있습니다. 그래서 거짓으로 시장에서 실제 추세 대신 pullbacks를 구입할 수 있습니다. 추가 시간 프레임 또는 지표가 통합을 판단하기 위해 추가 될 수 있습니다.
- 단축 위험- 짧은 포지션은 불특정 하향 위험을 가지고 있습니다. 엄격한 스톱 손실이 구현되어야 합니다.
- 매개 변수 조정- 더 나은 위험 조정 수익을 달성하기 위해 Stop Loss 레벨, 포지션 사이징 등을 정밀 조정합니다.
- 지표를 추가합니다- 더 많은 기술적 지표를 포함하여 안정성과 안정성을 향상시킵니다.
결론
일일 브레이크아웃 전략은 일일 촛불의 간단하고 효과적인 비교를 통해 시장 모멘텀을 식별하여 단기 트렌드 방향으로 거래할 수 있습니다. 간단하고 구현하기 쉽지만, 윙사 리스크가 있습니다. 매개 변수 및 추가 지표에 대한 추가 최적화는 전략 신뢰성을 향상시킬 수 있습니다.
/*backtest
start: 2022-12-26 00:00:00
end: 2023-08-30 00:00:00
period: 1d
basePeriod: 1h
exchanges: [{"eid":"Futures_Binance","currency":"BTC_USDT"}]
*/

//@version=5
strategy("Daily Candle Strategy", overlay=true, default_qty_type=strategy.percent_of_equity, default_qty_value=0.0)

// Input parameters
initialCapital = 10000
riskFactor = 3500

// Calculate the opening and closing values for the last day's candle
lastDayOpen = request.security(syminfo.tickerid, "D", open[1], lookahead=barmerge.lookahead_on)
lastDayClose = request.security(syminfo.tickerid, "D", close[1], lookahead=barmerge.lookahead_on)

// Determine the color of the last day's candle
lastDayColor = lastDayOpen < lastDayClose ? color.green : color.red

// Plot the last day's candle on the chart
plotshape(series=na, color=lastDayColor, style=shape.triangledown, location=location.abovebar)

// Calculate trade size based on available capital at last day's closing
availableCapital = strategy.equity
tradeSize = availableCapital / riskFactor

// Trading conditions
buyCondition = lastDayColor == color.green
sellCondition = lastDayColor == color.red

// Execute strategy orders with calculated trade size
strategy.entry("Buy", strategy.long, qty=tradeSize, when=buyCondition)
strategy.entry("Sell", strategy.short, qty=tradeSize, when=sellCondition)

// Exit strategy
stopLoss = 0.001 * lastDayOpen * tradeSize
strategy.exit("StopLoss/Profit", from_entry="Buy", loss=stopLoss)
strategy.exit("StopLoss/Profit", from_entry="Sell", loss=stopLoss)

// Plot stop loss level on the chart
plot(stopLoss, color=color.red, linewidth=2, title="Stop Loss")
더 많은
- 이중 볼링거 밴드 브레이크업 전략
- T3 및 ATR에 기반한 자동 트렌드 추적 전략
- ATR 채널 브레이크오웃 트렌드를 따르는 전략
- MACD 200 일간 이동 평균 크로스오버 거래 전략
- 골든 크로스 상승 추세 추적 전략
- 이중 EMA 크로스오버 오스실레이션 추적 전략
- 딱딱성 돌파구 전략
- 옆으로 돌파하는 오시슬레이션 전략
- RSI 지표 및 포용 패턴에 기초한 양적 거래 전략
- 볼링거 밴드 ATR 트레일링 스톱 전략
- 양적 거래에 기반한 신호-소음 이동 평균 거래 전략
- 모멘텀 크로스오버 이동 평균 및 MACD 필터 하이킨-아시 촛불 전략
- 여러 상대적 강도 지표의 합성 전략
- 랜덤 피셔 변환 일시 정지 역 스톡 지표 양적 전략
- 적응식 스톱 손실 철도 전략
- 볼링거 밴드 부피 확인 양적 거래 전략
- 양적 전략에 따라 매개 변수 최적화 경향
- 베가스 채널 크로스오버 전략
- 동적 이동 평균에 기초한 전략을 따르는 경향
- 콤보 트렌드 추적 전략