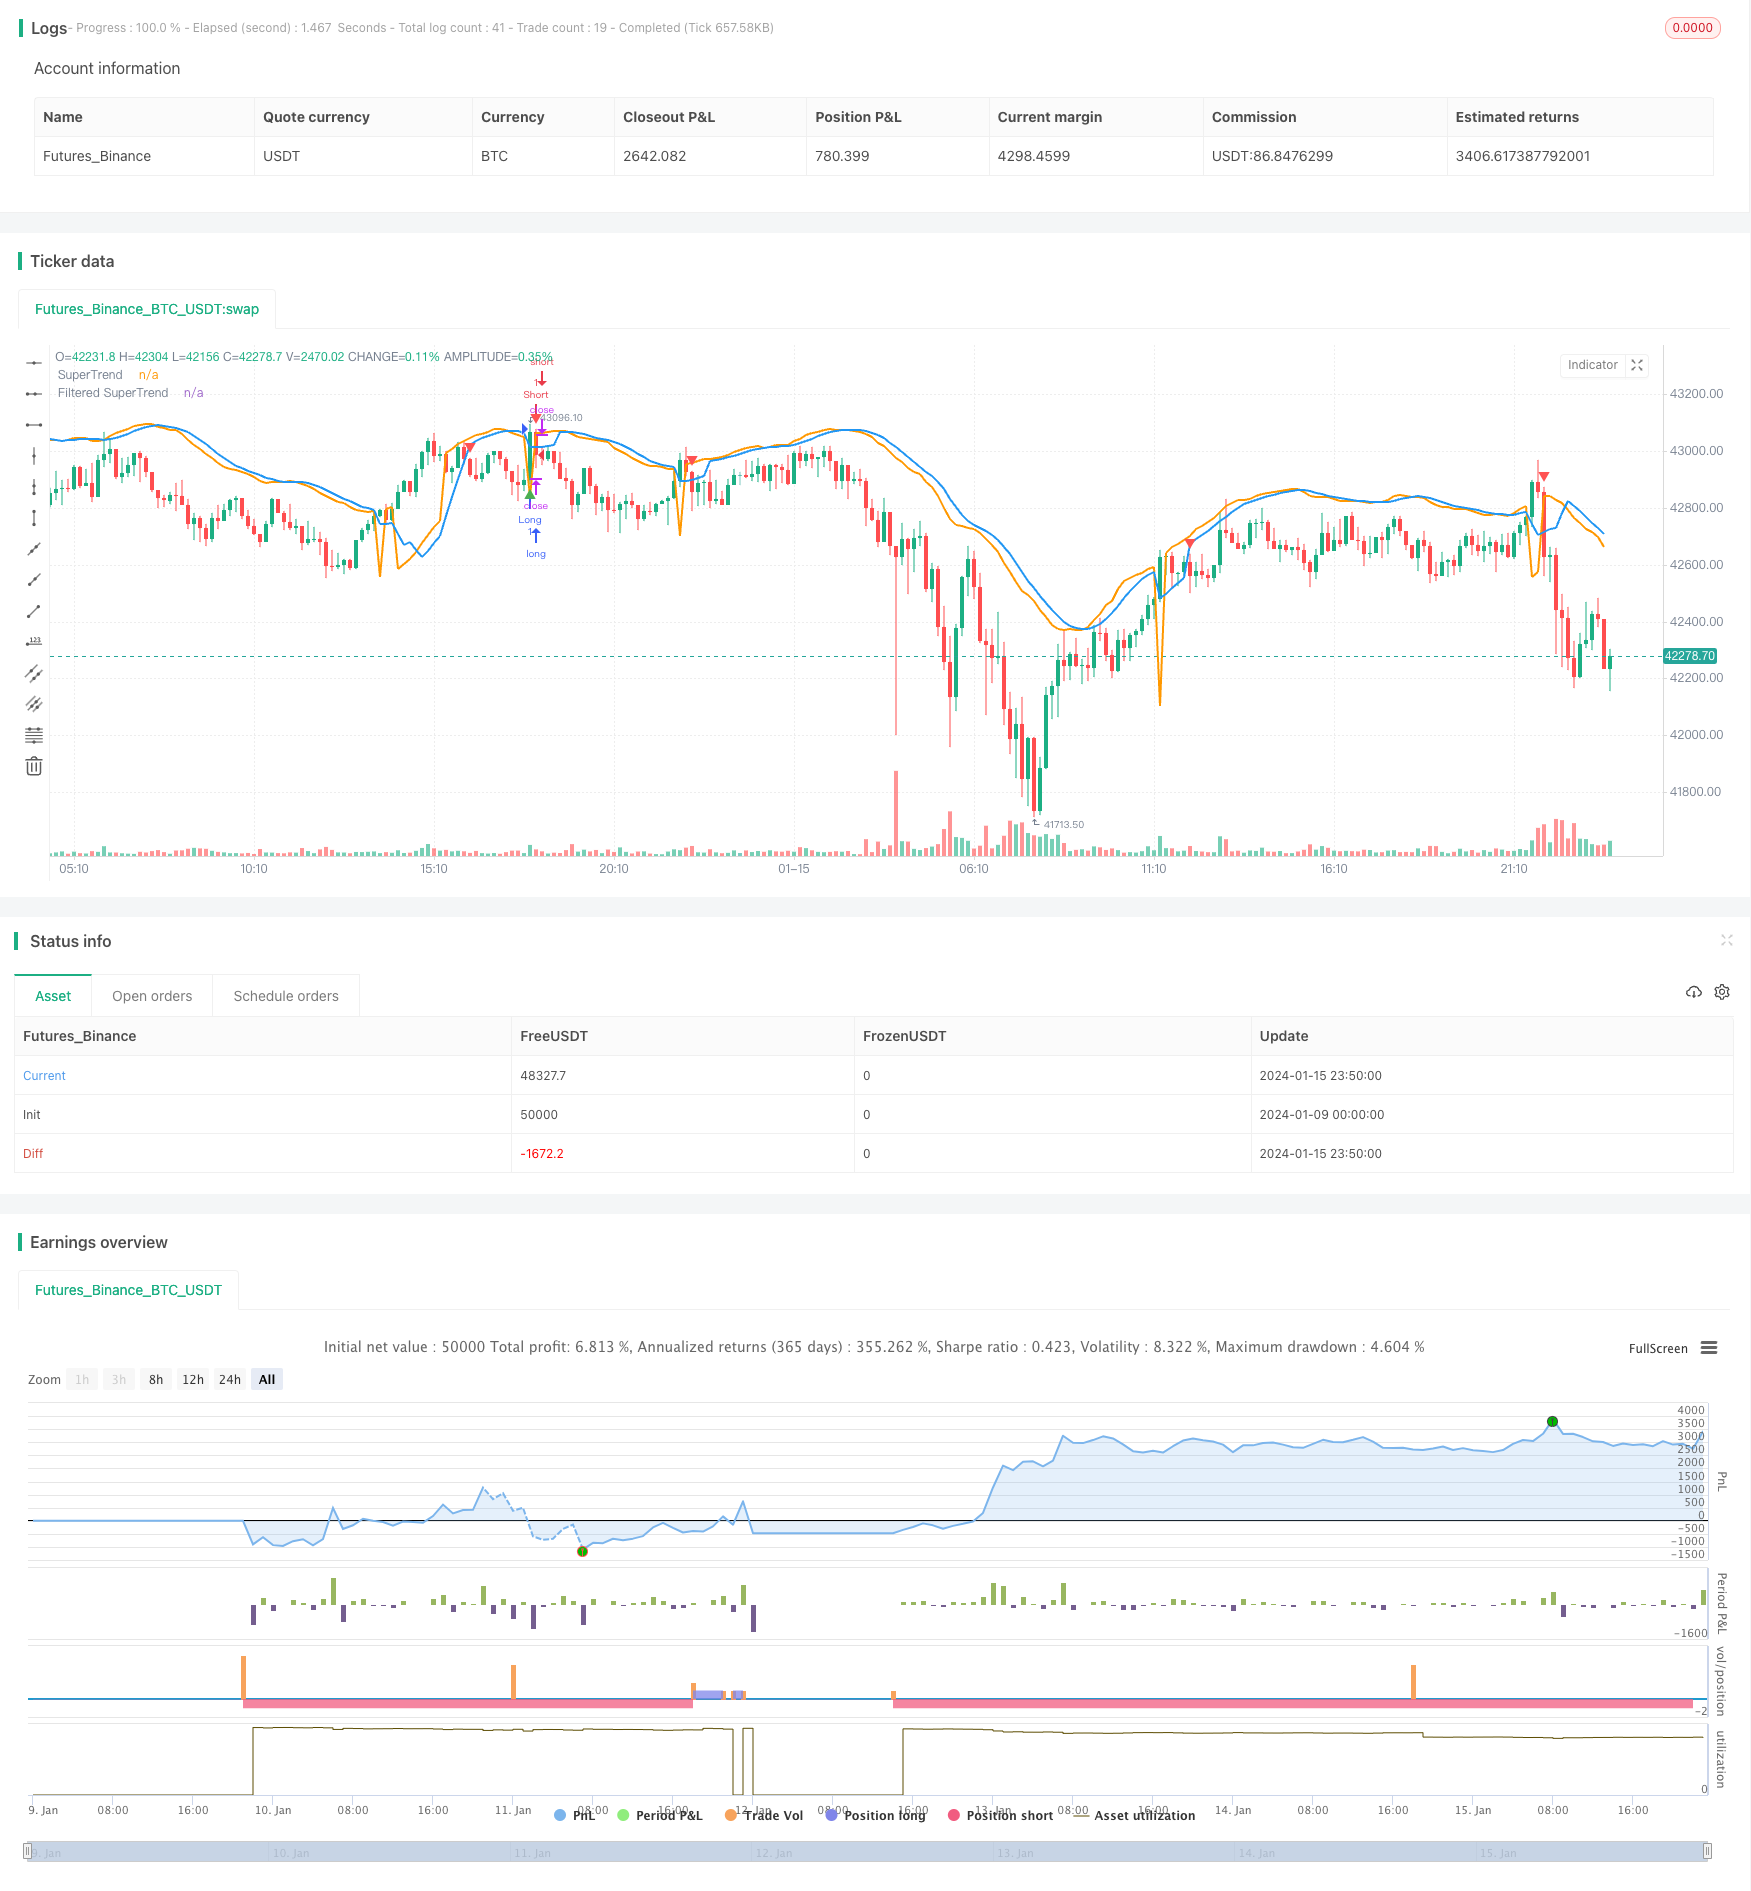
개선된 슈퍼 트렌드 전략
저자:차오장, 날짜: 2024-01-17 15:55:15태그:

전반적인 설명
이 문서에서는 트렌드 다음 전략을 심층적으로 분석하여 슈퍼트렌드 지표와 스토카스틱 RSI 필터를 결합하여 정확성을 향상시킵니다. 기존 트렌드를 고려하고 잘못된 신호를 줄이는 동안 구매 및 판매 신호를 생성하는 것을 목표로합니다. 스토카스틱 RSI는 과잉 구매 및 과잉 판매 상태에서 잘못된 신호를 필터합니다.
전략 논리
슈퍼트렌드 계산
먼저 True Range (TR) 와 Average True Range (ATR) 를 계산합니다. 다음으로 ATR을 사용하여 상위 및 하위 대역을 계산합니다.
상단 대역 = SMA ((결결, ATR 기간) + ATR 곱기 * ATR 하위 대역 = SMA (Close, ATR Period) - ATR 곱기 * ATR
상승 추세는 하위 범위를 닫을 때 확인됩니다. 하락 추세는 상위 범위를 닫을 때 확인됩니다.
상승 트렌드 중, 슈퍼 트렌드는 하위 대역으로 설정됩니다. 하락 트렌드 중, 슈퍼 트렌드는 상위 대역으로 설정됩니다.
필터링 메커니즘
거짓 신호를 줄이기 위해, 슈퍼 트렌드는 필터화된 슈퍼 트렌드를 얻기 위해 이동 평균을 사용하여 평평화됩니다.
스토카스틱 RSI
RSI 값은 계산되고, 그 다음 스토카스틱 지표가 적용되어 스토카스틱 RSI를 생성합니다. RSI가 과소매 또는 과소매인지 보여줍니다.
입국 및 출국 조건
긴 엔트리: 상승 추세와 스토카스틱 RSI < 80의 필터링된 슈퍼트렌드 이상의 클로즈 크로스 짧은 엔트리: 하향 추세와 스토카스틱 RSI의 필터링된 슈퍼트렌드 이하의 크로스를 닫습니다. > 20
긴 출구: 올림 트렌드에서 필터 된 슈퍼 트렌드 아래의 크로스를 닫습니다.
짧은 출구: 하락 트렌드에서 필터 된 슈퍼 트렌드 위의 크로스를 닫습니다.
전략 의 장점
이 개선된 트렌드 다음 전략은 간단한 이동 평균보다 다음과 같은 우위를 가지고 있습니다:
- 슈퍼트렌드 자체는 좋은 트렌드 식별과 거짓 신호 필터링 능력을 가지고 있습니다.
- 필터링 메커니즘은 더 신뢰할 수 있는 신호로 이어지는 잘못된 신호를 더 줄입니다.
- 스토카스틱 RSI는 과잉 구매/ 과잉 판매 상태에서 중요한 지원/ 저항 수준을 둘러싼 잘못된 신호를 피합니다.
- 이 전략은 트렌드 방향과 과잉 구매/ 과잉 판매 조건을 모두 고려하여 트렌드를 따르고 잘못된 신호를 피하는 것 사이의 더 나은 균형을 제공합니다.
- 유연한 매개 변수 조정으로 다른 시장 환경에 적응할 수 있습니다.
위험 과 최적화
잠재적 위험
- 높은 변동성 이동 중에 손실을 중지 할 수 있습니다.
- 슈퍼트렌드와 필터링 문제로 인해 최근 가격 변경이 사라졌습니다.
- 전략 성과에 영향을 미치는 잘못된 스토카스틱 RSI 매개 변수 설정
위험 관리
- 스톱 로스를 적절하게 조정하거나 후속 스톱 로스를 사용하십시오.
- ATR 기간과 필터 기간과 같은 매개 변수를 조정하여 지연 효과를 균형 잡습니다.
- 스토카스틱 RSI 매개 변수를 테스트하고 최적화합니다.
최적화 기회
- 최적의 매개 변수를 찾기 위해 다양한 매개 변수 조합을 테스트합니다.
- 다른 필터링 메커니즘을 시도해보세요. EMA 평형화 등.
- 기계 학습을 적용해서 매개 변수를 자동으로 최적화합니다.
- 진입 조건을 보완하기 위해 다른 지표를 포함합니다.
결론
이 전략은 효과적인 트렌드 식별 및 품질 무역 신호를 위해 슈퍼 트렌드 및 스토카스틱 RSI의 강점을 결합하고, 또한 필터링 메커니즘을 통해 시장 소음에 대한 전략을 견고하게합니다. 파라미터 최적화 또는 다른 지표 / 모델과 결합하여 추가 성능 향상을 달성 할 수 있습니다. 전반적으로이 전략은 안정적인 수익을 추구하는 사람들에게 좋은 트렌드 추적 능력과 약간의 위험 통제를 보여줍니다.
/*backtest
start: 2024-01-09 00:00:00
end: 2024-01-16 00:00:00
period: 10m
basePeriod: 1m
exchanges: [{"eid":"Futures_Binance","currency":"BTC_USDT"}]
*/

//@version=5
strategy("Improved SuperTrend Strategy with Stochastic RSI", shorttitle="IST+StochRSI", overlay=true)

// Input parameters
atr_length = input(14, title="ATR Length")
atr_multiplier = input(1.5, title="ATR Multiplier")
filter_length = input(5, title="Filter Length")
stoch_length = input(14, title="Stochastic RSI Length")
smooth_k = input(3, title="Stochastic RSI %K Smoothing")

// Calculate True Range (TR) and Average True Range (ATR)
tr = ta.rma(ta.tr, atr_length)
atr = ta.rma(tr, atr_length)

// Calculate SuperTrend
upper_band = ta.sma(close, atr_length) + atr_multiplier * atr
lower_band = ta.sma(close, atr_length) - atr_multiplier * atr

is_uptrend = close > lower_band
is_downtrend = close < upper_band

super_trend = is_uptrend ? lower_band : na
super_trend := is_downtrend ? upper_band : super_trend

// Filter for reducing false signals
filtered_super_trend = ta.sma(super_trend, filter_length)

// Calculate Stochastic RSI
rsi_value = ta.rsi(close, stoch_length)
stoch_rsi = ta.sma(ta.stoch(rsi_value, rsi_value, rsi_value, stoch_length), smooth_k)

// Entry conditions
long_condition = ta.crossover(close, filtered_super_trend) and is_uptrend and stoch_rsi < 80
short_condition = ta.crossunder(close, filtered_super_trend) and is_downtrend and stoch_rsi > 20

// Exit conditions
exit_long_condition = ta.crossunder(close, filtered_super_trend) and is_uptrend
exit_short_condition = ta.crossover(close, filtered_super_trend) and is_downtrend

// Plot SuperTrend and filtered SuperTrend
plot(super_trend, color=color.orange, title="SuperTrend", linewidth=2)
plot(filtered_super_trend, color=color.blue, title="Filtered SuperTrend", linewidth=2)

// Plot Buy and Sell signals
plotshape(series=long_condition, title="Buy Signal", color=color.green, style=shape.triangleup, location=location.belowbar)
plotshape(series=short_condition, title="Sell Signal", color=color.red, style=shape.triangledown, location=location.abovebar)

// Output signals to the console for analysis
plotchar(long_condition, "Long Signal", "▲", location.belowbar, color=color.green, size=size.small)
plotchar(short_condition, "Short Signal", "▼", location.abovebar, color=color.red, size=size.small)

// Strategy entry and exit
strategy.entry("Long", strategy.long, when=long_condition)
strategy.entry("Short", strategy.short, when=short_condition)
strategy.close("Long", when=exit_long_condition)
strategy.close("Short", when=exit_short_condition)
- 리버스 모멘텀 거래 전략
- 대역 통과 평균 PB 지표 전략
- RSI와 피보나치 5분 거래 전략
- MACD 양적 전략과 결합된 삼중 이동 평균
- 모멘텀 브레이크오웃 최적화
- 기준 크로스 클라이피커 ATR 변동성 & HMA 트렌드 비아스 평균 역전 전략
- 변동성 대역 및 VWAP 다중 시간 프레임 주식 트렌드 거래 전략
- 크로스오버 포집 전략으로 가격 반전
- 에일러스 스토카스틱 사이버 사이클 전략
- 피보나치 레벨을 기반으로 매일 높은-저한 가격의 돌파구
- MACD, RSI 및 RVOL을 통합하는 양적 거래 전략
- 모멘텀 인버션 추적 전략
- EMA와 SMA 교차에 기반한 전략을 따르는 경향
- 간단한 피보트 역전 알고리즘 거래 전략
- ADX 지표에 기반한 적응형 거래 전략
- 동적 채널 브레이크업 전략
- 다중 필터 볼링거 밴드 거래 전략
- 실제 범위에 기반한 가중화 이동 평균 크로스 기간 전략
- 이중 SMA 동력 전략
- 동력 평균 오차 돌파 전략