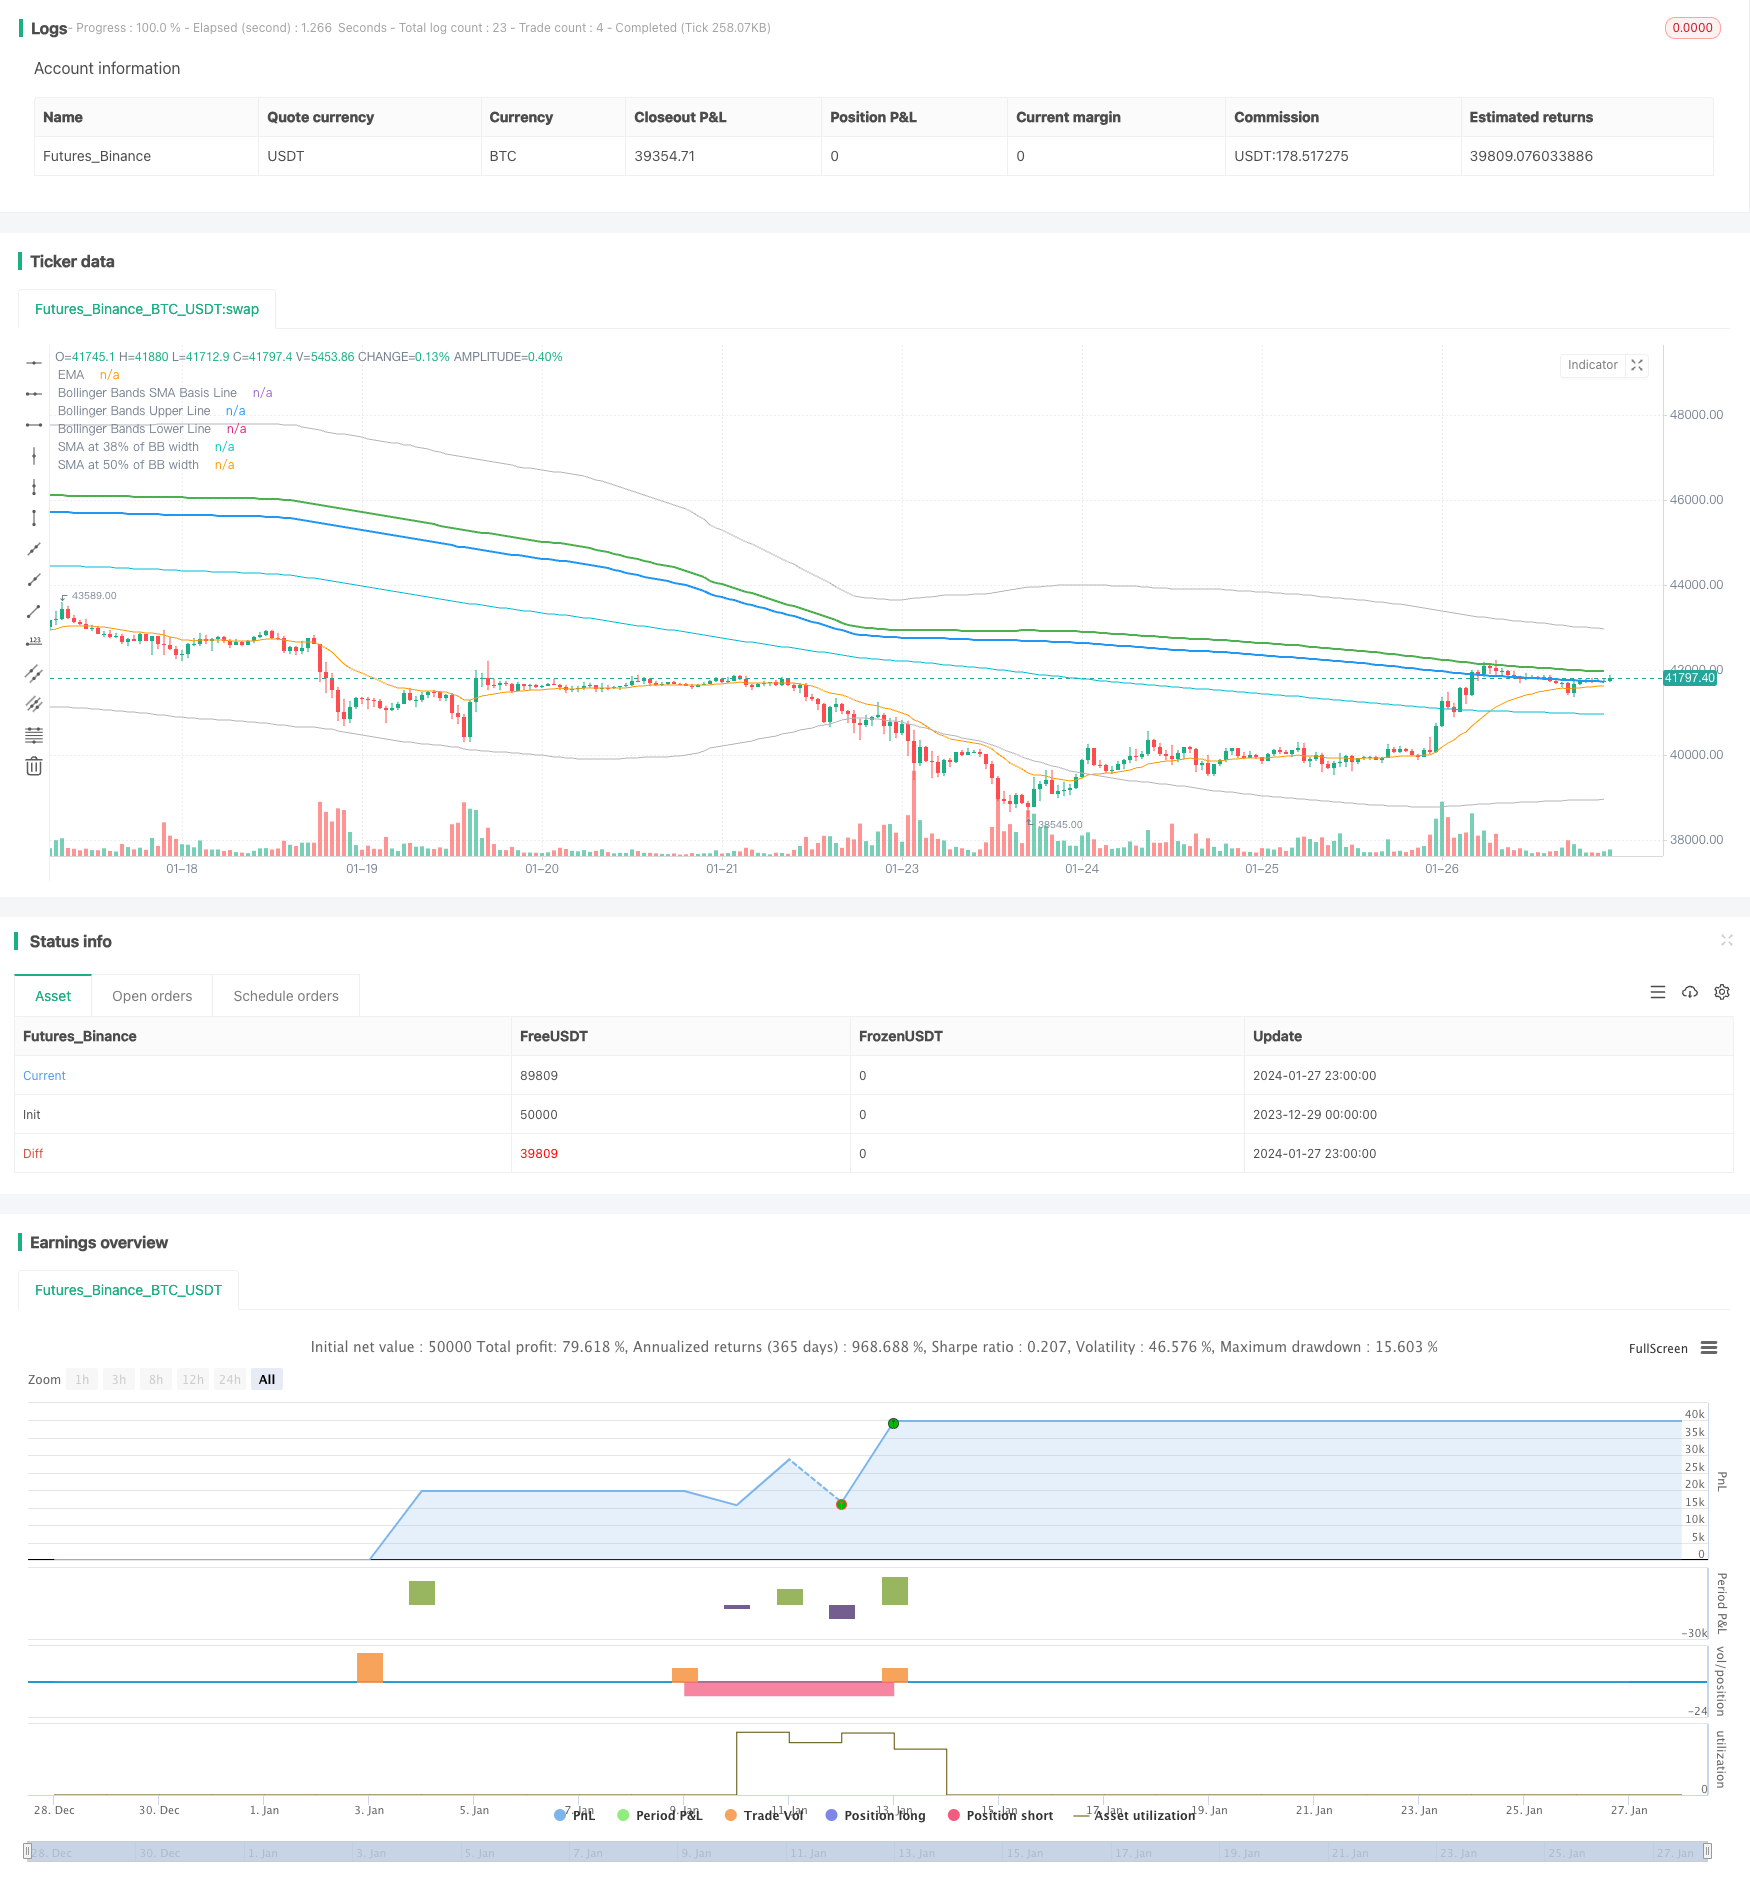
FNGU 양적 거래 전략 Bollinger Bands와 RSI를 기반으로
저자:차오장, 날짜: 2024-01-29 14:53:47태그:

전반적인 설명
이 전략은
전략 논리
이 전략의 핵심 논리는 볼링거 밴드와 RSI 지표의 조합에 기반합니다.
첫째, 볼링거 밴드는 세 개의 라인을 포함합니다: 중간 라인, 상위 라인 및 하위 라인. 중간 라인은 n 일간 간단한 이동 평균이며, 상위 라인과 하위 라인은 중간 라인의 위와 아래의 표준 편차의 k 배입니다. 가격이 상위 또는 하위 라인에 도달하거나 닿을 때 주가가 과잉 구매 또는 과잉 판매 상태에 있음을 나타냅니다.
이 전략에서 볼링거 밴드 중선의 기간 길이는 235일이며, 매개 변수 k 값은 2이다. 가격은 볼링거 하위선 이하로 떨어지거나 중선 위에 넘어가면 구매 신호를 생성하고, 가격이 볼링거 상위선 이상으로 상승하면 판매 신호를 생성한다.
두 번째로, RSI 지표는 주식의 과잉 구매/ 과잉 판매 수준을 반영합니다. RSI 70 이상은 과잉 구매 상태를, 30 이하의 과잉 판매 상태를 나타냅니다. 이 전략에서 RSI의 매개 변수 기간 길이는 2입니다.
이 전략에서는 볼링거 밴드와 RSI 지표가 함께 사용됩니다. 가격이 볼링거 하위선을 만지거나 아래로 떨어질 때 RSI가 과소매 수준을 넘어서면 구매 신호가 생성됩니다. 가격이 볼링거 상위선을 넘어서면 판매 신호가 생성됩니다.
전략 의 장점
이 전략은 다음과 같은 장점을 가지고 있습니다.
- 볼링거 밴드와 RSI를 결합하면 구매/판매 신호가 더 정확하고 신뢰할 수 있습니다.
- 볼링거 밴드는 과잉 구매/ 과잉 판매 가격 영역을 식별하고, RSI는 가짜 신호를 필터합니다. 둘은 상호 보완합니다.
- 단지 긴 거래를 하는 것 뿐이고, 단축 위험을 고려할 필요도 없습니다.
- 최적화된 매개 변수 때문에 특히 매우 변동성이 높은 FNGU 주식에 적합합니다.
- 손실 위험을 줄이기 위해 자동 스톱 로스를 구현합니다.
- 코딩 실현은 간단하고 명확하고 이해하기 쉽고 수정 할 수 있습니다.
위험 과 해결책
이 전략과 관련된 위험도 있습니다.
- 볼링거 대역과 RSI 모두 가짜 신호를 생성하여 쉽게 과도한 조정으로 이어질 수 있습니다. 매개 변수를 조정하거나 더 많은 필터를 추가 할 수 있습니다.
- FNGU 자체는 높은 변동성을 가지고 있습니다. 부적절한 스톱 로스 설정은 손실을 증가시킬 수 있습니다. 스톱 로스 범위는 확장되어야합니다.
- 이 전략은 FNGU와 같은 매우 변동적인 주식에만 적용되며 다른 주식에는 적용되지 않습니다. 매개 변수는 다른 주식에 따라 조정되어야합니다.
- 최적화되었지만, 매개 변수는 시장 변화에 따라 구식화 될 수 있으며, 지속적인 모니터링과 최적화를 요구합니다.
전략 최적화의 방향
이 전략을 더 이상 최적화하기 위한 몇 가지 방향이 있습니다.
- 더 정확한 신호를 만들기 위해 KDJ와 MACD와 같은 다른 기술 지표를 추가하십시오.
- 더 많은 주식 유형을 조정하기 위해 볼링거 밴드 및 RSI의 매개 변수를 최적화합니다.
- 더 많은 데이터로 의사결정을 돕기 위해 기계 학습 모델을 통합합니다.
- 더 높은 시간 프레임 데이터를 이용한 간 주기적인 거래를 구현합니다.
- 소셜 미디어 데이터를 사용하여 감정 분석을 결합하여 거래 신호를 생성합니다.
- 다양한 매개 변수 설정을 빠르게 테스트할 수 있는 양적 백테스팅 시스템을 개발합니다.
결론
이 전략은 특히 FNGU와 같은 매우 변동성 있는 주식에 적합합니다. 볼링거 밴드 (Bollinger Bands) 와 RSI를 결합함으로써, 가격 역전 기회를 포착하는 것을 목표로, 과소매/ 과소매 가격 수준을 중심으로 거래 신호를 생성합니다. 여전히 적용 가능성을 확대하고 성능을 향상시키기 위해 최적화 할 수있는 많은 공간이 있습니다.
/*backtest
start: 2023-12-29 00:00:00
end: 2024-01-28 00:00:00
period: 1h
basePeriod: 15m
exchanges: [{"eid":"Futures_Binance","currency":"BTC_USDT"}]
*/

//@version=4
strategy("Bollinger + RSI + EMA, Double Strategy Long-Only (by EMKM)", shorttitle="1Min Killer", overlay=true)

///////////// RSI
RSIlength = input(2, title="RSI Period Length") // Adjusted RSI period length
RSIoverSold = 50
RSIoverBought = 50
price = close
vrsi = rsi(price, RSIlength)

///////////// Bollinger Bands
BBlength = input(235, minval=1, title="Bollinger Period Length") // Adjusted Bollinger period length
BBmult = 2
BBbasis = sma(price, BBlength)
BBdev = BBmult * stdev(price, BBlength)
BBupper = BBbasis + BBdev
BBlower = BBbasis - BBdev
BBtarget38 = BBbasis + 0.38 * BBdev  // Line at 38% of Bollinger Band width
BBtarget50 = BBbasis + 0.50 * BBdev  // Line at 50% of Bollinger Band width

///////////// EMA
emaLength = input(20, title="EMA Period Length")
ema = ema(close, emaLength)

source = close
buyEntry = crossover(source, BBlower) or (close < BBlower and close > BBbasis) or (low < BBlower and close > BBbasis) // Add condition for low touching Bollinger Band
sellEntry = crossunder(source, BBupper)

///////////// Plotting
plot(BBbasis, color=color.aqua, title="Bollinger Bands SMA Basis Line")
plot(BBupper, color=color.silver, title="Bollinger Bands Upper Line")
plot(BBlower, color=color.silver, title="Bollinger Bands Lower Line")
plot(BBtarget38, color=color.blue, linewidth=2, title="SMA at 38% of BB width")  // Line at 38%
plot(BBtarget50, color=color.green, linewidth=2, title="SMA at 50% of BB width")  // Line at 50%
plot(ema, color=color.orange, title="EMA")  // Plot EMA

///////////// RSI + Bollinger Bands Strategy
longCondition = crossover(vrsi, RSIoverSold) and buyEntry
sellCondition = crossunder(vrsi, RSIoverBought) and close > BBupper

close_long = close > BBbasis
close_short = close < BBbasis

if (not na(vrsi))
    if longCondition
        strategy.entry("Buy", strategy.long, qty=10, stop=BBlower, comment="Buy")
    else
        strategy.cancel(id="Buy")

    if close_long
        strategy.close("Buy")

if (sellCondition)
    strategy.entry("Sell", strategy.short, qty=10, stop=BBupper, comment="Sell")
else
    strategy.cancel(id="Sell")

if close_short
    strategy.close("Sell")
- EMA 촛불 폐쇄 전략
- EMA의 크로스오버 양적 거래 전략
- 동적 스톱 로스 이동 평균 전략
- 점진적 진입 전략으로 평균 반전
- 동적 평균 가격 추적 전략
- 양적 거래 전략을 위한 ZZ 지표와 결합된 윌리엄스 프랙탈
- 다중 요인 트렌드 거래 전략
- 이중 이동 평균 크로스오버 거래 전략
- 거래 전략에 따른 부피 기반 트렌드
- 중요한 회전점 반전 전략
- 볼링거 밴드 RSI OBV 전략
- P 신호 반전 전략
- RSI 악어 트렌드 전략
- 이동 평균 및 윌리엄스 지표에 기초한 일일 FX 전략
- 이동 평균 채널 브레이크 트레이딩 전략
- 이중 이동 평균 스토카스틱 전략
- 돈치안 채널 탈출 전략
- 이동 평균 트렌드 추적 전략
- RSI 지표 그리드 거래 전략
- PPO 가격 감수성 모멘텀 이중 하위 방향 거래 전략