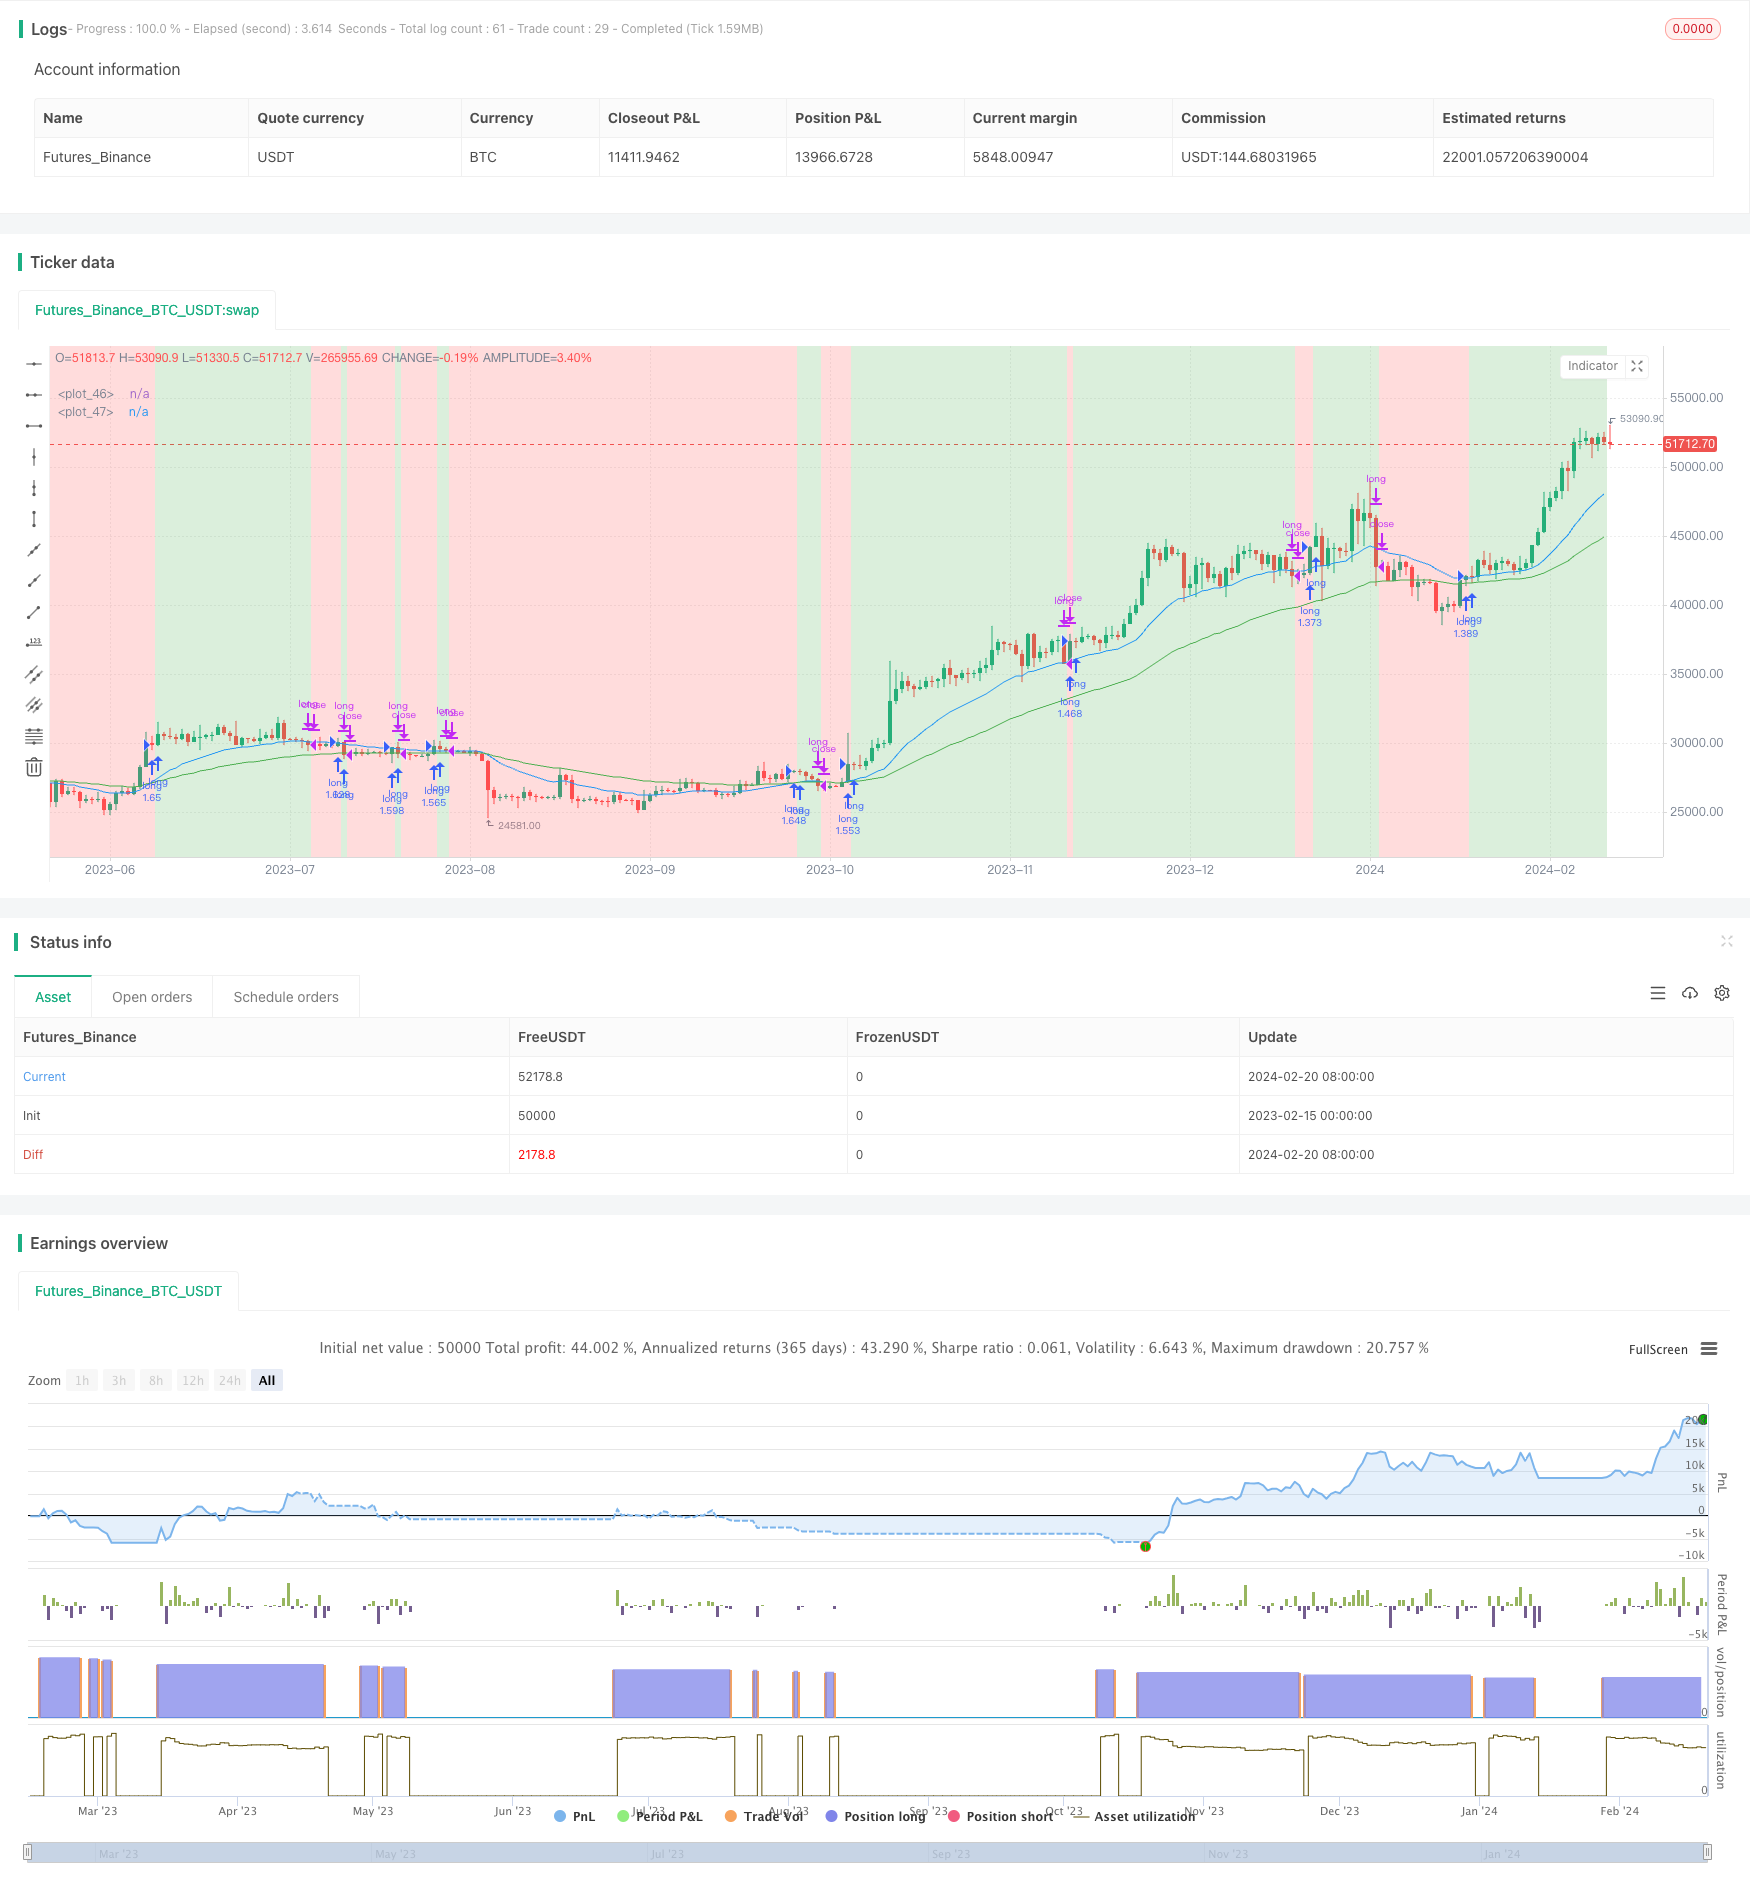
EMA 크로스오버에 기반한 전략을 따르는 경향
저자:차오장, 날짜: 2024-02-22 13:59:07태그:

전반적인 설명
이 전략은 빠른 EMA와 느린 EMA 라인의 교차를 통해 시장 트렌드 방향을 파악하고, 트렌드를 따라 거래합니다. 빠른 EMA가 느린 EMA를 넘을 때 길게 이동하고, 가격이 빠른 EMA를 넘을 때 포지션을 닫습니다.
전략 논리
이 전략은 입력 매개 변수에 기초하여 빠른 EMA (i_shortTerm) 와 느린 EMA (i_longTerm) 를 계산합니다. 단기 EMA가 장기 EMA (goLongCondition1) 를 넘어서고 가격이 단기 EMA (goLongCondition2) 를 넘어서면 긴 지점에 진입합니다. 가격이 단기 EMA (exitCondition2) 를 넘어서면 포지션을 닫습니다.
이 전략은 주요 시장 트렌드를 결정하고 트렌드를 따라 거래하기 위해 EMA 라인의 황금 십자가에 기반합니다. 단기 EMA가 장기 EMA를 넘으면 상승 추세를 나타냅니다. 가격이 단기 EMA 위에있을 때 상승 추세가 진행 중이라는 것을 나타냅니다. 따라서 길게 이동하십시오. 가격이 단기 EMA 아래로 떨어지면 트렌드 반전을 나타냅니다. 따라서 즉시 포지션을 닫습니다.
이점 분석
이 전략의 주요 장점은 다음과 같습니다.
EMA 크로스오버를 활용하여 주요 시장 추세를 파악하고 단기 변동을 피합니다.
빠른 및 느린 EMA 매개 변수를 통해 트렌드 감지에서 조정 가능한 민감도
단순하고 명확한 논리, 이해하기 쉽고 구현하기 쉬운 양자 거래 초보자에게 적합합니다.
다른 제품과 시장에 맞게 EMA 기간 매개 변수를 조정할 수 있습니다.
가격이 EMA 라인을 넘을 때 스톱 로스를 통해 효과적인 리스크 제어
위험 분석
또한 몇 가지 위험이 있습니다.
지연된 EMA 크로스오버 신호는 트렌드 역전 시 손실을 유발할 수 있습니다.
단기 EMA를 넘어선 거짓 파업은 실패한 엔트리를 유발할 수 있습니다.
부적절한 패러미터 설정은 전략 성능을 약화시킬 수 있습니다.
성능은 시장 상태에 크게 의존하고 있으며 모든 제품과 기간에 적합하지 않습니다.
대응한 위험 관리 측정:
EMA 매개 변수를 최적화하여 반전에 대한 더 나은 감수성을 제공합니다.
입력 신호를 필터링하기 위해 다른 기술적 지표를 추가합니다.
다양한 시장에 대한 매개 변수를 지속적으로 디버깅하고 최적화합니다.
전략을 적용하기 전에 적용 가능한 시장 조건을 완전히 이해하십시오.
최적화 방향
이 전략은 다음 측면에서 더 이상 최적화 될 수 있습니다.
MACD와 KD와 같은 다른 지표를 추가하여 입력 신호를 필터합니다.
수익을 확보하고 더 나은 위험 통제를 위해 후속 스톱 손실을 구현하십시오.
변동성 지표 ATR로 스톱 로스 배치 최적화
EMA 매개 변수 조정에 대한 더 나은 과학적 방법을 테스트하고 찾아내십시오.
정확도를 높이기 위해 여러 시간 프레임에서 신호를 검증합니다.
트렌드 가속화 단계에서 더 큰 움직임을 잡기 위해 BREAKOUT 변경을 시도하십시오.
결론
이 전략은 EMA 크로스오버 신호에 거래함으로써 시장 트렌드를 효과적으로 추적합니다. 명확한 논리와 제어 가능한 위험으로 양자 거래 초보자가 연습하기에 적합합니다. 매개 변수 조정, 엔트리 필터링, 스톱 로스 배치에 대한 추가 최적화는 전략 성능을 향상시킬 수 있습니다. 그러나 모든 전략에는 한계가 있습니다. 사용자는 라이브 거래시 시장 조건을 기반으로 신중하게 적용해야합니다.
/*backtest
start: 2023-02-15 00:00:00
end: 2024-02-21 00:00:00
period: 1d
basePeriod: 1h
exchanges: [{"eid":"Futures_Binance","currency":"BTC_USDT"}]
*/

// This Pine Script™ code is subject to the terms of the Mozilla Public License 2.0 at https://mozilla.org/MPL/2.0/
// © pradhan_abhishek

//@version=5
strategy('EMA cross-over strategy by AP', overlay=true, shorttitle='EMACS-AP', initial_capital=100000, default_qty_value=100, default_qty_type=strategy.percent_of_equity, commission_value=0.025)

// inputs
i_shortTerm = input(title='Fast EMA', defval=21)
i_longTerm = input(title='Slow EMA', defval=55)
// select backtest range: if this is not given, then tradingview goes back since inception / whereever it finds data
i_from = input(defval = timestamp("01 Jan 2023 00:00"), title = "From")
i_to = input(defval = timestamp("31 Dec 2033 23:59"), title = "To")
i_showBg = input(defval = true, title = "Show In-trade / Out-trade background")

// create date function "within window of time"
date() => true

// exponential moving average (EMA) variables, derived from input parameters
shortTermEMA = ta.ema(close, i_shortTerm)
longTermEMA = ta.ema(close, i_longTerm)
atr = ta.atr(14)

// ### Trade strategy: begins ###
inTrade = strategy.position_size > 0
notInTrade = strategy.position_size <= 0

goLongCondition1 = shortTermEMA > longTermEMA
goLongCondition2 = close > shortTermEMA

// exitCondition1 = shortTermEMA < midTermEMA
exitCondition2 = close < shortTermEMA

// enter if not in trade and long conditions are met
if date() and goLongCondition1 and goLongCondition2 and notInTrade
    strategy.entry('long', strategy.long)
    // exit on stop-Loss hit
    stopLoss = close - atr * 3
    strategy.exit('exit', 'long', stop=stopLoss)

// exit if already in trade and take profit conditions are met
if date() and exitCondition2 and inTrade
    strategy.close(id='long')
// ###Trade strategy: ends ###

// plot emas & background color for trade status
plot(shortTermEMA, color=color.new(color.blue, 0))
plot(longTermEMA, color=color.new(color.green, 0))
trade_bgcolor = notInTrade ? color.new(color.red, 75) : color.new(color.green, 75)
bgcolor(i_showBg ? trade_bgcolor : color.new(color.white, 75))
- Nifty 50 지원 및 저항 수준과 함께 동적 위치 조정에 기반한 양적 거래 전략
- 동적 채널 이동 평균 트렌드 추적 전략
- 하모닉 듀얼 시스템 전략
- 돌파구 콜백 장기 전략
- MA 크로스오버 거래 전략 단기 및 장기 이동 평균 크로스오버를 기반으로
- 이중 이동 평균 크로스오버 MACD 양적 전략
- 이중 이동 평균 압력 반사 전략
- 4 WMA 트렌드 추적 전략
- 나다라야-왓슨 회귀와 ATR 채널에 기초한 전략을 따르는 경향
- 이동평균 크로스오버에 기초한 트렌드 추적 전략
- 로그 이치모쿠 크로스 품종 전략
- RVI와 EMA에 기초한 비트코인 거래 전략
- 양적 거래 전략의 양방향 반전
- 볼링거 밴드 통합 전략
- 이치모쿠 클라우드를 이용한 클라우드 기반 트렌드 전략
- 이동 평균에 기초한 트렌드 역전 전략
- 렌코 이동 평균에 기초한 전략을 따르는 경향
- 3개의 RSI 이동평균 대역 전략
- 달 위상을 기반으로 한 양방향 거래 전략
- EMA 크로스오버 및 볼린거 밴드와 함께 반전 거래 전략