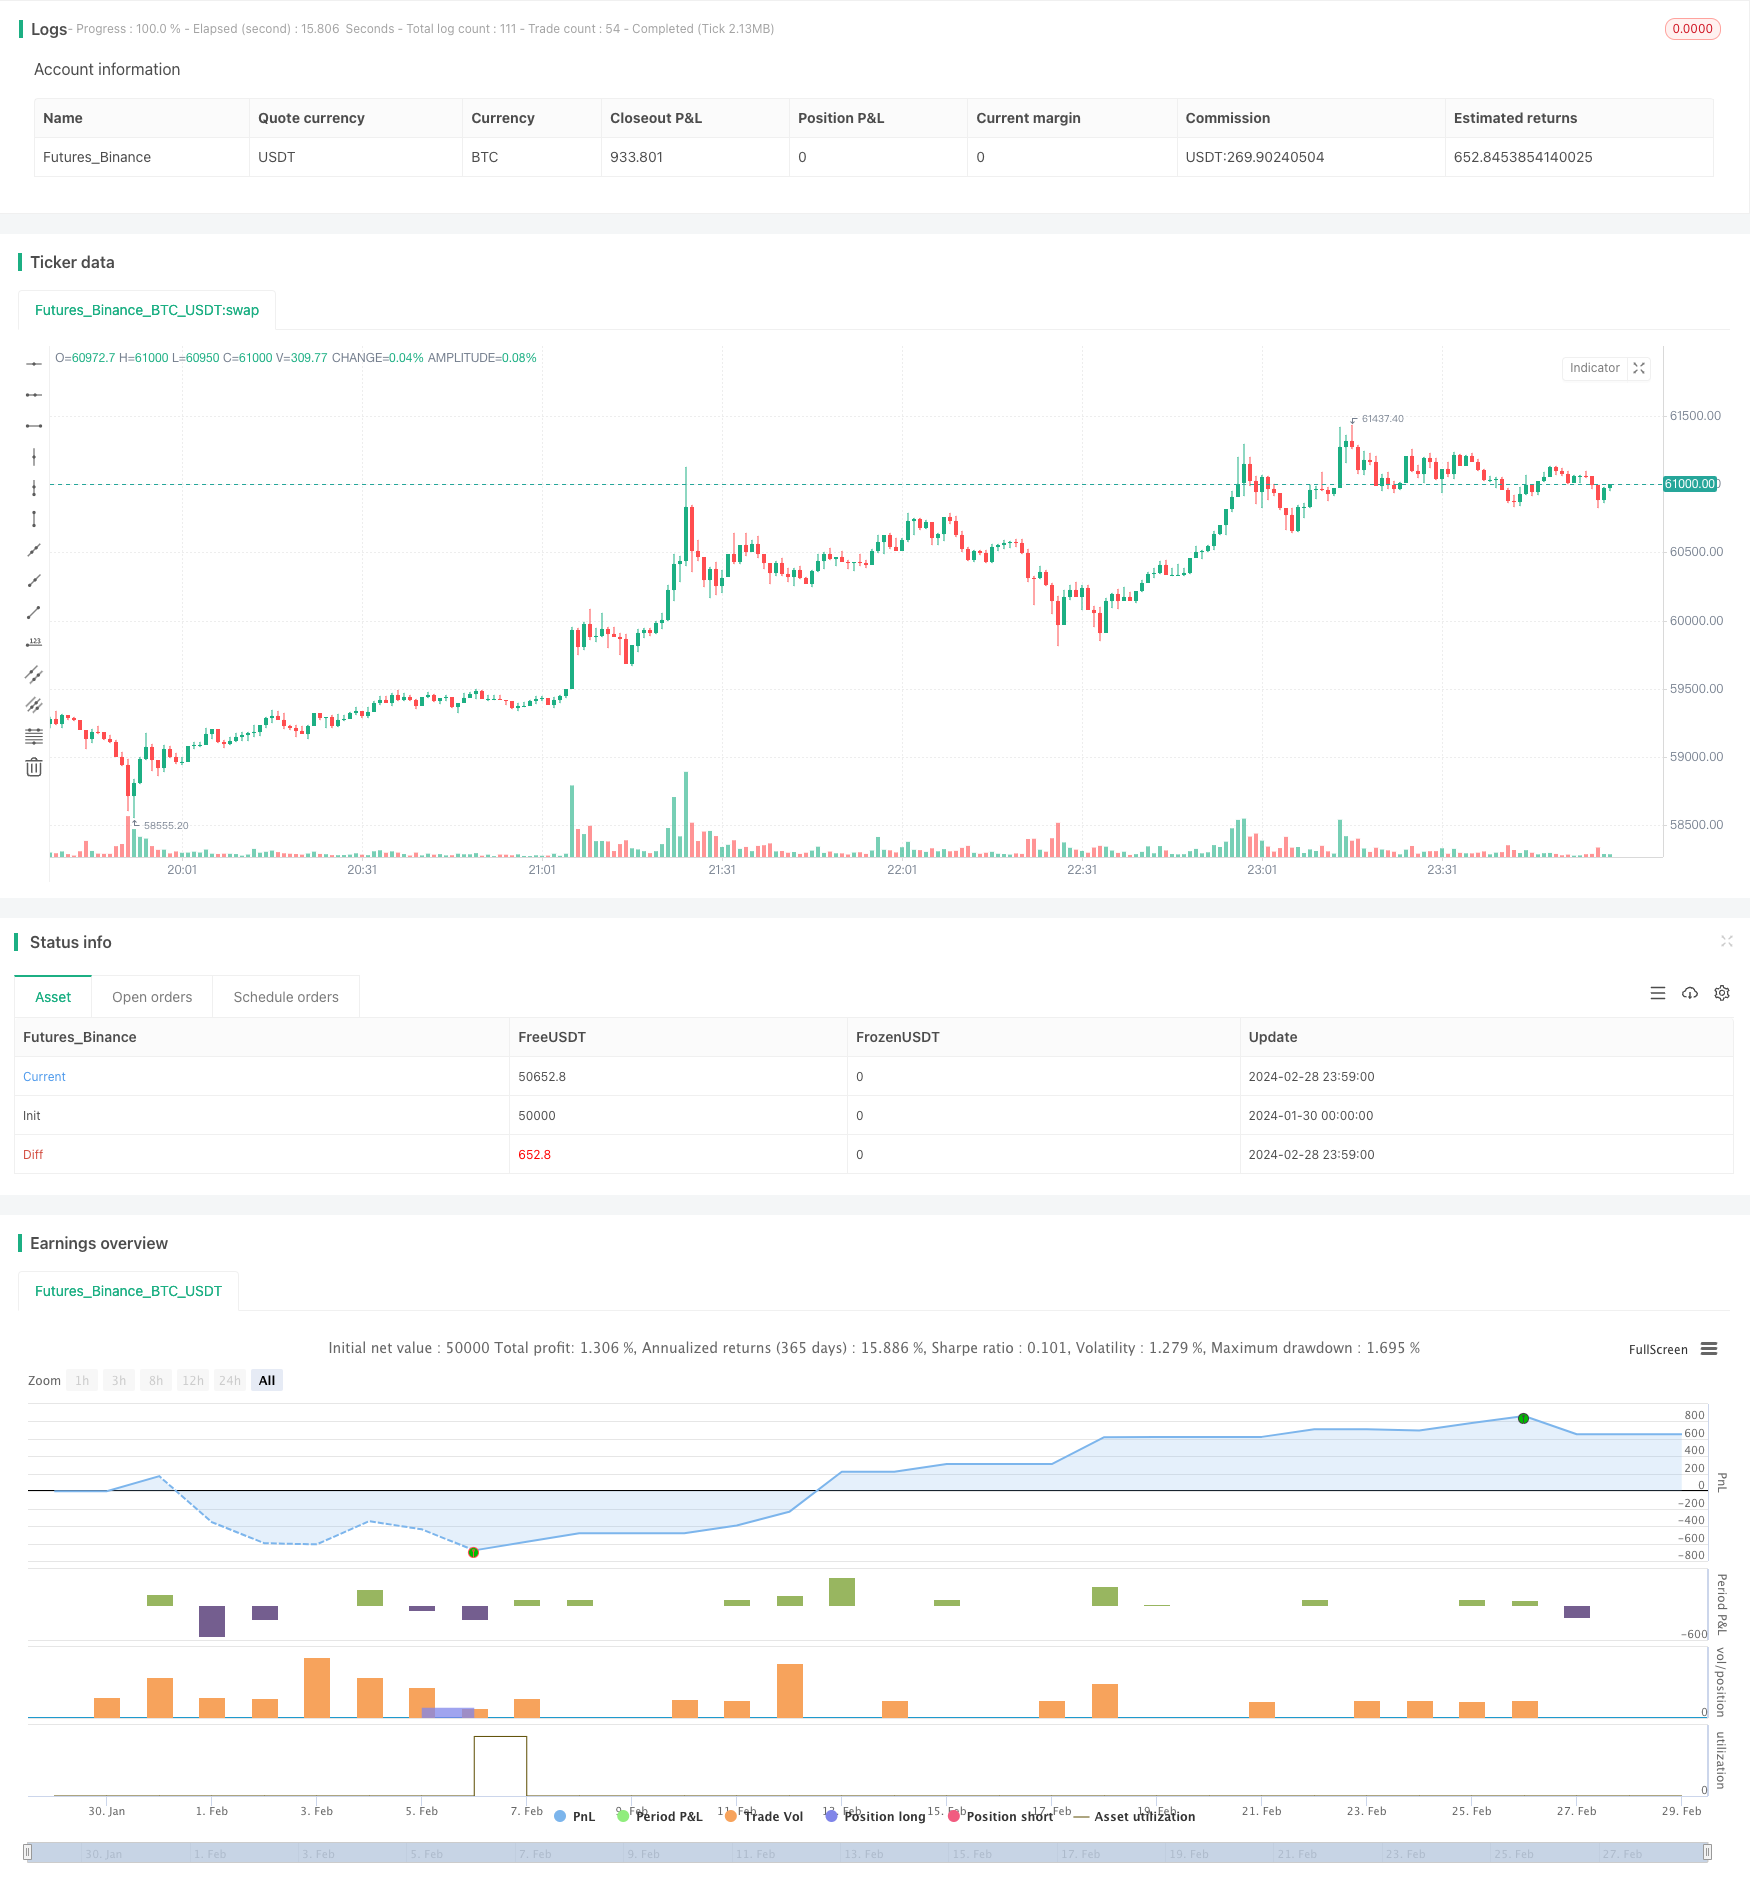
개요
이 전략은 RSI 지표와 평평한 RSI 지표의 결합을 통해 가격 낮은 시점에 구매 기회를 찾습니다. RSI 지표가 혁신이 낮고 가격이 혁신이 낮지 않을 때, 다중 헤드 분류 신호로 간주됩니다. 평평한 RSI 지표의 추세 판단과 결합하면 전략의 효과를 높일 수 있습니다.
전략 원칙
- RSI를 계산하기 위해, 14 일 줄에 대한 변수를 사용하십시오.
- 평평한 RSI를 계산하여 WMA 평균을 통해 평평한 효과를 얻습니다.
- RSI가 30보다 낮다면 과매매가 됩니다.
- 평평한 RSI가 35보다 낮거나 방향성이 강하다는 것을 판단하십시오.
- RSI의 최저점이 25보다 낮아지는지 판단하라.
- RSI를 계산하는 것은, RSI 혁신이 낮고 가격이 혁신이 낮지 않은 경우를 찾는 것입니다.
- 평평한 RSI의 하락주기를 계산하기 위해서는 3일이 필요합니다.
- 위의 조건이 모두 충족되면 구매 신호가 발생한다.
- 손해 중지 및 정지 조건을 설정하십시오.
이 전략은 주로 RSI 지표의 반전 성질에 의존하며, 평평한 RSI 판단 경향과 결합하여, 가격이 압박을 받으면서 RSI가 초과할 때 구매한다. 정지 또는 정지 후 평정 위치.
전략적 강점 분석
- 이중 RSI 지표 조합으로 전략 효과를 높인다.
- RSI의 역전적 특성을 이용해서 확률적인 이점이 있다.
- 평평한 RSI 판단 경향은 거짓 반전을 피하는 데 도움이 됩니다.
- 전체적인 Stop Loss Logic은 위험을 제한할 수 있습니다.
위험 분석
- RSI 역전 실패의 확률은 완전히 피할 수 없습니다.
- 평평한 RSI 지표는 지연되어 가장 좋은 구매 시기를 놓칠 수 있습니다.
- 스톱포인트 설정이 너무 느리고, 손실이 확대될 위험이 있다.
RSI 변수를 조정하여 구매 시기를 최적화 할 수 있습니다. 중지 간격을 적절히 줄이고 중단 속도를 가속화 할 수 있습니다. 다른 지표와 결합하여 트렌드 위험을 판단하여 거짓 반전의 가능성을 줄일 수 있습니다.
최적화 방향
- RSI 지표의 효과를 다른 변수에서 테스트할 수 있다.
- 평형 RSI의 계산 방법을 최적화하여 평형 품질을 향상시킵니다.
- 스톱톱 스톱 손실을 조정하여 최적의 리스크/이익 비율을 찾습니다.
- “기능 지표와 같은 판단력을 높여기 위해 노력해야 한다”고 말했다.
더 많은 지표들을 조합하고 변수를 조정함으로써 전략적 거래의 효과를 더욱 높일 수 있습니다.
요약하다
이 전략 전체는 RSI 역전 특성을 활용하는 전략 아이디어입니다. 쌍 RSI 지표 조합은 RSI 역전 효과를 충분히 발휘하면서도 지표 차이로 인한 불확실성을 증가시킵니다. 전체는 전형적인 지표 전략 아이디어입니다. 지속적인 테스트를 통해 지표 매개 변수의 적합성을 향상시킬 수 있으며, 더 많은 지표 판단을 조합하여 잘못된 판단의 가능성을 줄이고 전략의 튼튼함을 향상시킬 수 있습니다.
전략 소스 코드
/*backtest
start: 2024-01-30 00:00:00
end: 2024-02-29 00:00:00
period: 1m
basePeriod: 1m
exchanges: [{"eid":"Futures_Binance","currency":"BTC_USDT"}]
*/

// This source code is subject to the terms of the Mozilla Public License 2.0 at https://mozilla.org/MPL/2.0/
// © BigBitsIO

//@version=4
strategy(title="RSI and Smoothed RSI Bull Div Strategy [BigBitsIO]", shorttitle="RSI and Smoothed RSI Bull Div Strategy [BigBitsIO]", overlay=true, pyramiding=1, default_qty_type=strategy.percent_of_equity, default_qty_value=100, commission_type=strategy.commission.percent, commission_value=.1, slippage=0)


TakeProfitPercent = input(3, title="Take Profit %", type=input.float, step=.25)
StopLossPercent = input(1.75, title="Stop Loss %", type=input.float, step=.25)

RSICurve = input(14, title="RSI Lookback Period", type=input.integer, step=1)
BuyBelowTargetPercent = input(0, title="Buy Below Lowest Low In RSI Divergence Lookback Target %", type=input.float, step=.05)
BuyBelowTargetSource = input(close, title="Source of Buy Below Target Price", type=input.source)
SRSICurve = input(10, title="Smoothed RSI Lookback Period", type=input.integer, step=1)
RSICurrentlyBelow = input(30, title="RSI Currently Below", type=input.integer, step=1)
RSIDivergenceLookback = input(25, title="RSI Divergence Lookback Period", type=input.integer, step=1)
RSILowestInDivergenceLookbackCurrentlyBelow  = input(25, title="RSI Lowest In Divergence Lookback Currently Below", type=input.integer, step=1)
RSISellAbove = input(65, title="RSI Sell Above", type=input.integer, step=1)
MinimumSRSIDownTrend = input(3, title="Minimum SRSI Downtrend Length", type=input.integer, step=1)
SRSICurrentlyBelow = input(35, title="Smoothed RSI Currently Below", type=input.integer, step=1)

PlotTarget = input(false, title="Plot Target")


RSI = rsi(close, RSICurve)
SRSI = wma(2*wma(RSI, SRSICurve/2)-wma(RSI, SRSICurve), round(sqrt(SRSICurve))) // Hull moving average

SRSITrendDownLength = 0
if (SRSI < SRSI[1])
    SRSITrendDownLength := SRSITrendDownLength[1] + 1

// Strategy Specific
ProfitTarget = (close * (TakeProfitPercent / 100)) / syminfo.mintick
LossTarget = (close * (StopLossPercent / 100)) / syminfo.mintick
BuyBelowTarget = BuyBelowTargetSource[(lowestbars(RSI, RSIDivergenceLookback)*-1)] - (BuyBelowTargetSource[(lowestbars(RSI, RSIDivergenceLookback)*-1)] * (BuyBelowTargetPercent / 100))

plot(PlotTarget ? BuyBelowTarget : na)


bool IsABuy = RSI < RSICurrentlyBelow and SRSI < SRSICurrentlyBelow and lowest(SRSI, RSIDivergenceLookback) < RSILowestInDivergenceLookbackCurrentlyBelow and BuyBelowTargetSource < BuyBelowTarget and SRSITrendDownLength >= MinimumSRSIDownTrend and RSI > lowest(RSI, RSIDivergenceLookback)
bool IsASell = RSI > RSISellAbove

if IsABuy
    strategy.entry("Positive Trend", true) // buy by market
    strategy.exit("Take Profit or Stop Loss", "Positive Trend", profit = ProfitTarget, loss = LossTarget)
if IsASell
    strategy.close("Positive Trend")