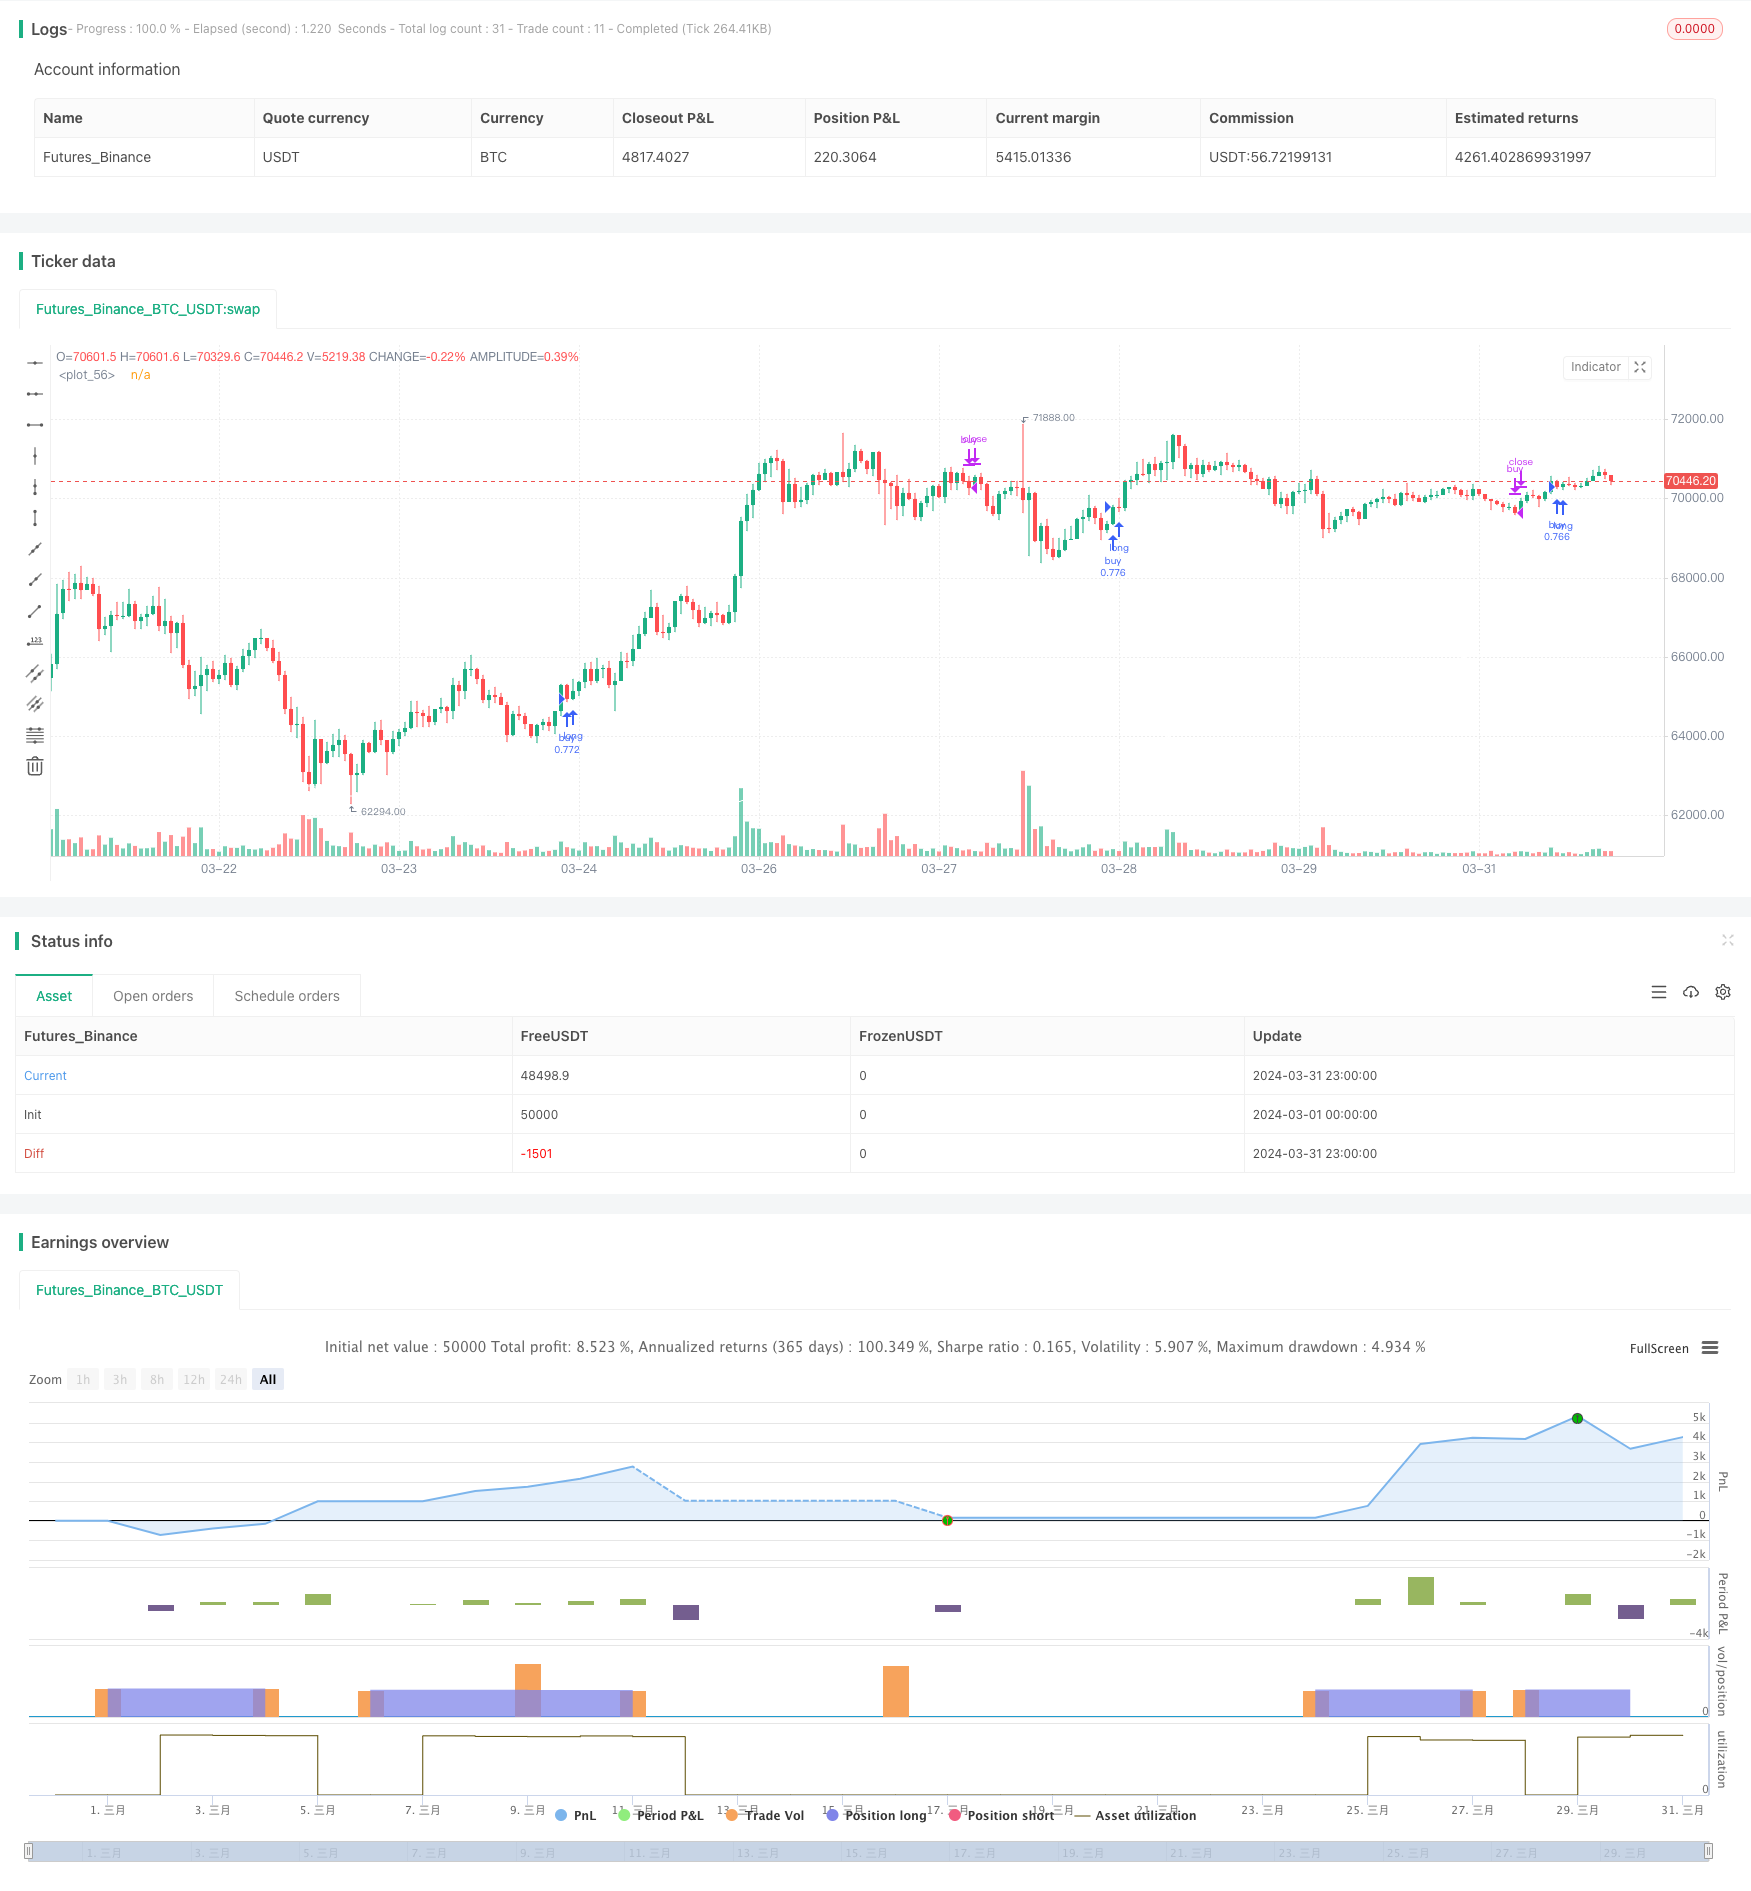
개요
이 전략은 여러 이동 평균 ((VWMA), 평균 방향 지수 ((ADX) 및 운동 지수 ((DMI) 를 사용하여 비트코인 시장의 여러 장점을 포착합니다. 가격 운동량, 트렌드 방향 및 거래량과 같은 여러 기술 지표를 결합하여, 이 전략은 상승 추세가 강하고 충분한 운동량이 있는 입구를 찾고, 위험을 엄격하게 제어합니다.
전략 원칙
- 9일과 14일 VWMA를 사용하여 다면 경향을 판단하고, 단기 평균선에 장기 평균선을 통과할 때 다면 신호를 발생시킨다.
- 89일 최고 가격과 최저 가격 VWMA로 구성된 적응 평균선을 트렌드 필터로 도입하여, 종전 가격이나 개시 가격이 이 평균선보다 높을 때만 포지션을 고려한다.
- ADX와 DMI 지표로 트렌드 강도를 확인한다. ADX가 18보다 크고 +DI와 -DI의 차이는 15보다 크면만 트렌드가 충분히 강하다고 여겨진다.
- 거래량 비율 함수를 사용하여 거래량이 60%~95% 사이의 바 라인을 필터링하여 거래량이 너무 낮은 시기를 피하십시오.
- 스톱 로즈는 앞의 K선 고도의 0.96~0.99배에 위치하고 있으며, 시간 프레임이 커질수록 감소하여 위험을 조절한다.
- 미리 설정된 포지션 보유 시간이나 가격이 자조 평균선 아래로 떨어질 때 평형 포지션.
우위 분석
- 여러 기술 지표와 결합하여 트렌드, 동력 및 거래량과 같은 여러 차원에서 시장 상태를 평가하면 신호가 더 신뢰할 수 있습니다.
- 적응형 평균선과 거래량 필터링 메커니즘은 가짜 신호를 효과적으로 필터링하여 유효하지 않은 거래를 줄일 수 있습니다.
- 엄격한 스톱로스 설정과 포지션 보유 기간 제한은 전략의 리스크 을 크게 낮춘다.
- 코드 모듈화 설계, 가독성 및 유지보수성이 좋으며, 추가적인 최적화 및 확장이 용이하다.
위험 분석
- 이 전략은 시장이 불안정하거나 추세가 불명확할 때 더 많은 가짜 신호를 생성할 수 있다.
- 스톱 로즈는 비교적 가까운 위치에 있으며, 시장의 변동이 큰 경우 스톱 로즈는 너무 일찍 촉발되어 손실이 확대될 수 있다.
- “블랙 스완” 사건에 직면했을 때, 거시경제 상황과 중요한 사건에 대한 고려가 부족할 수 있습니다.
- 매개 변수 설정은 상대적으로 고정되어 있으며, 적응력이 부족하며, 다양한 시장 환경에서 성능이 불안정할 수 있다.
최적화 방향
- 상대적으로 강한 지수 (RSI) 와 브린 밴드 등과 같은 시장 환경을 나타낼 수 있는 지표를 더 많이 도입하여 신호의 신뢰성을 높인다.
- 다른 시장의 변동에 대응하기 위해 ATR 또는 비율을 사용하여 손해 처리를 동적으로 최적화하십시오.
- 이 전략의 리스크 제어 모듈은 거시 경제 데이터와 감정 분석과 결합하여 강화되었습니다.
- 기계 학습 알고리즘을 사용하여 매개 변수를 자동으로 최적화하여 전략의 적응성과 안정성을 향상시킵니다.
요약하다
VWMA-ADX 비트 코인 다단계 전략은 가격 추세, 운동, 거래량과 같은 여러 기술 지표를 종합적으로 고려하여 비트 코인 시장의 상승 기회를 효과적으로 잡을 수 있습니다. 동시에, 엄격한 위험 관리 조치와 명확한 평형 조건은 이 전략의 위험을 더 잘 통제 할 수 있습니다. 그러나, 이 전략에는 시장 환경 변화에 대한 적응 부족과 손실 방지 전략의 최적화와 같은 몇 가지 제한이 있습니다.
전략 소스 코드
/*backtest
start: 2024-03-01 00:00:00
end: 2024-03-31 23:59:59
period: 1h
basePeriod: 15m
exchanges: [{"eid":"Futures_Binance","currency":"BTC_USDT"}]
*/

// This Pine Script™ code is subject to the terms of the Mozilla Public License 2.0 at https://mozilla.org/MPL/2.0/
// © Q_D_Nam_N_96

//@version=5
strategy("Long BTC Strategy", overlay=true,
     default_qty_type = strategy.percent_of_equity,
     default_qty_value = 100, initial_capital = 1000, currency = currency.USD)

Volume_Quartile(vol) =>
    qvol1 = ta.percentile_linear_interpolation(vol, 60,15)
    qvol2 = ta.percentile_linear_interpolation(vol, 60,95)
    vol > qvol1 and vol < qvol2

smma(src, length) =>
	smma =  0.0
	smma := na(smma[1]) ? ta.sma(src, length) : (smma[1] * (length - 1) + src) / length
	smma

ma(source, length, type) =>
    switch type
        "SMA" => ta.sma(source, length)
        "EMA" => ta.ema(source, length)
        "RMA" => ta.rma(source, length)
        "WMA" => ta.wma(source, length)
        "VWMA" => ta.vwma(source, length)
        "HMA" => ta.hma(source, length)
        "SMMA" => smma(source, length)

DMI(len, lensig) =>
    up = ta.change(high)
    down = -ta.change(low)
    plusDM = na(up) ? na : (up > down and up > 0 ? up : 0)
    minusDM = na(down) ? na : (down > up and down > 0 ? down : 0)
    trur = ta.rma(ta.tr, len)
    plus = fixnan(100 * ta.rma(plusDM, len) / trur)+11
    minus = fixnan(100 * ta.rma(minusDM, len) / trur)-11
    sum = plus + minus
    adx = 100 * ta.vwma(math.abs(plus - minus-11) / (sum == 0 ? 1 : sum), lensig)

    [adx, plus, minus]

cond1 = Volume_Quartile(volume*hlcc4)

ma1 = ma(close,9, "VWMA")
// plot(ma1, color = color.blue)
ma2 = ma(close,14, "VWMA")
// plot(ma2, color = color.orange)

n = switch timeframe.period
    "240" => 0.997
    => 0.995

ma3 = (0.1*ma(ta.highest(close,89),89, "VWMA") +
     0.9*ma(ta.lowest(close,89),89, "VWMA"))*n

plot(ma3, color = color.white)

[adx, plus, minus] = DMI(7, 10)


cond2 = adx > 18 and plus - math.abs(minus) > 15

var int count = 0

if barstate.isconfirmed and strategy.position_size != 0
    count += 1
else
    count := 0

p_roc = 0
if timeframe.period == '240'
    p_roc := 14
else
    p_roc := 10

longCondition = ta.crossover(ma1, ma2) and (close > open ? close > ma3 : open > ma3) and ((ma3 - ma3[1])*100/ma3[1] >= -0.2) and ((close-close[p_roc])*100/close[p_roc] > -2.0)
float alpha = 0.0
float sl_src = high[1]
if (longCondition and cond1 and cond2 and strategy.position_size == 0)
    strategy.entry("buy", strategy.long)
    if timeframe.period == '240'
        alpha := 0.96
        strategy.exit("exit-buy","buy", stop = sl_src*alpha)
        // line.new(bar_index, sl_src*alpha, bar_index+5, sl_src*alpha, width = 2, color = color.white)
    else if timeframe.period == '30'
        alpha := 0.985
        strategy.exit("exit-buy","buy", stop = sl_src*alpha)
        // line.new(bar_index, sl_src*alpha, bar_index+20, sl_src*alpha, width = 2, color = color.white)
    else if timeframe.period == '45'
        alpha := 0.985
        strategy.exit("exit-buy","buy", stop = sl_src*alpha)
        // line.new(bar_index, sl_src*alpha, bar_index+20, sl_src*alpha, width = 2, color = color.white)
    else if timeframe.period == '60'
        alpha := 0.98
        strategy.exit("exit-buy","buy", stop = sl_src*alpha)
        // line.new(bar_index, sl_src*alpha, bar_index+20, sl_src*alpha, width = 2, color = color.white)
    else if timeframe.period == '120'
        alpha := 0.97
        strategy.exit("exit-buy","buy", stop = sl_src*alpha)
        // line.new(bar_index, sl_src*alpha, bar_index+20, sl_src*alpha, width = 2, color = color.white)
    else if timeframe.period == '180'
        alpha := 0.96
        strategy.exit("exit-buy","buy", stop = sl_src*alpha)
        // line.new(bar_index, sl_src*alpha, bar_index+20, sl_src*alpha, width = 2, color = color.white)
    else if timeframe.period == 'D'
        alpha := 0.95
        strategy.exit("exit-buy","buy", stop = sl_src*alpha)
        // line.new(bar_index, sl_src*alpha, bar_index+20, sl_src*alpha, width = 2, color = color.white)
    else
        alpha := 0.93
        strategy.exit("exit-buy","buy", stop = sl_src*alpha)
        // line.new(bar_index, sl_src*alpha, bar_index+20, sl_src*alpha, width = 2, color = color.white)

period = switch timeframe.period
    "240" => 90
    "180" => 59
    "120" => 35
    "30" => 64
    "45" => 40
    "60" => 66
    "D" => 22
    => 64

if (count > period or close < ma3)
    strategy.close('buy', immediately = true)