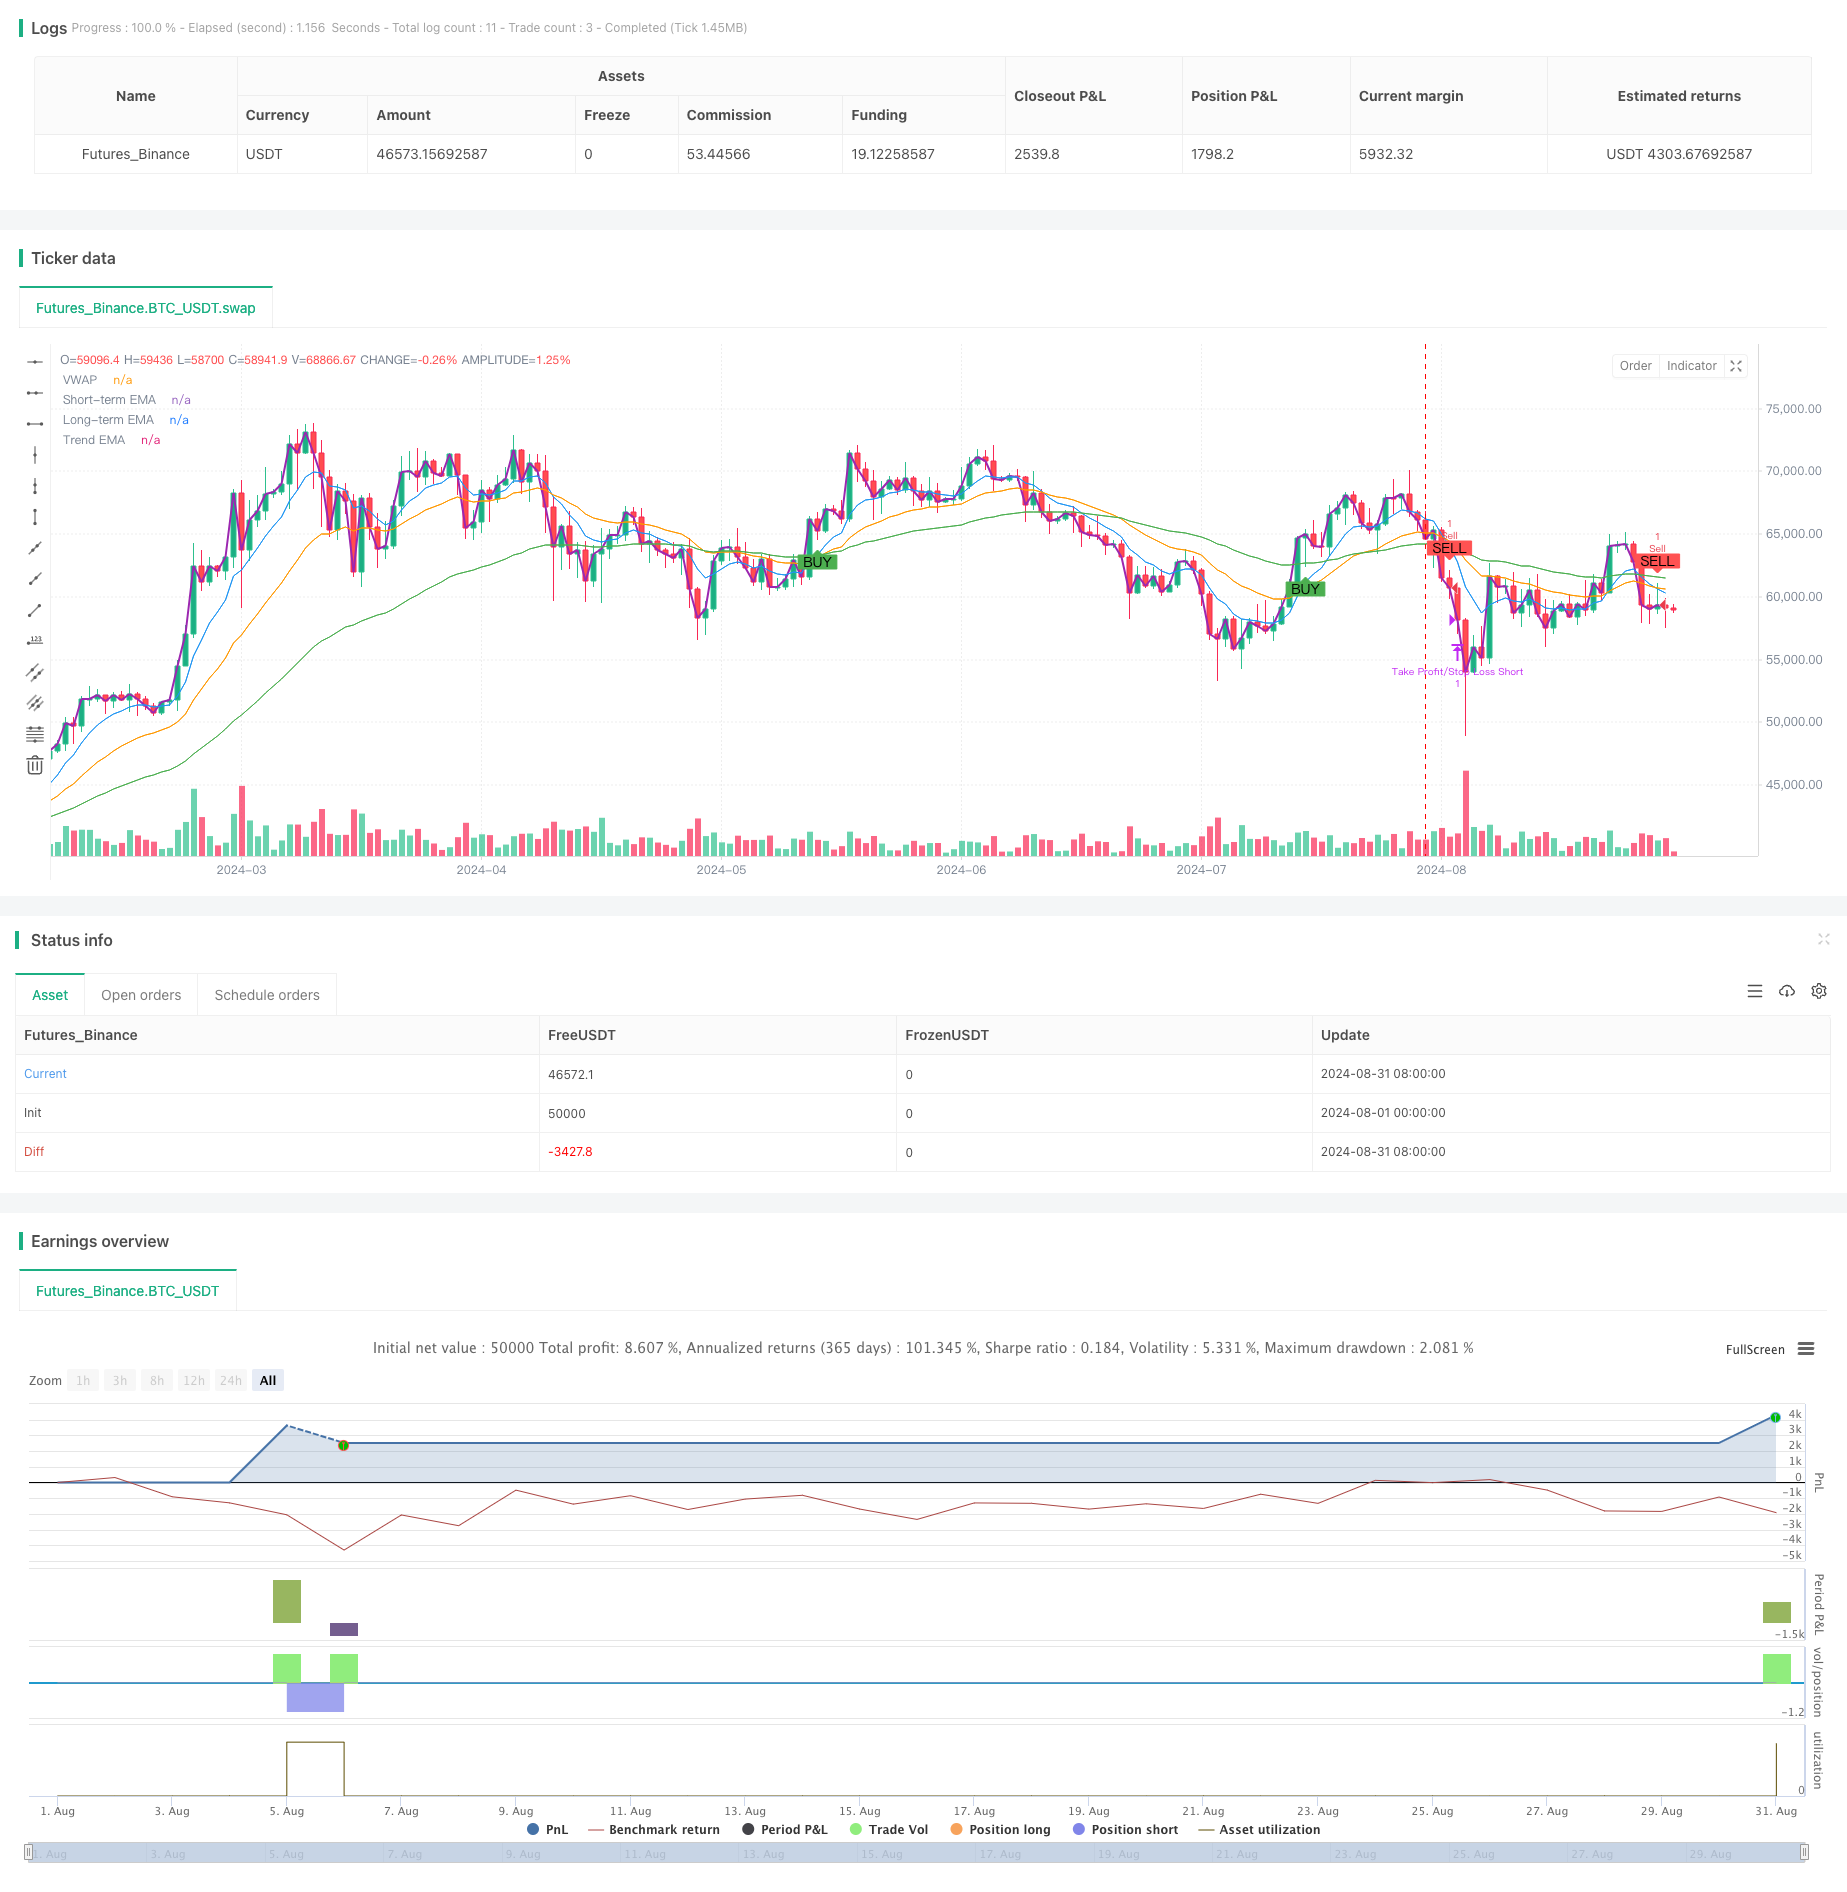
개요
이 전략은 다주기 지수 이동 평균 (((EMA) 과 거래량 가중 평균 가격 (((VWAP) 을 결합한 일일 거래 전략이다. 그것은 주로 8주기 및 21주기 EMA의 교차를 사용하여 거래 신호를 생성하며, 55주기 EMA를 트렌드 필터로 사용하며, VWAP와 결합하여 거래 방향을 확인한다. 이 전략에는 고정된 퍼센트의 중지 손실 및 중지 설정, 그리고 일일 평정 위치 장치가 포함되어 있으며, 이는 높은 승률과 안정적인 거래 성능을 달성하기 위해 고안되었다.
전략 원칙
신호 생성: 8주기 EMA 위에 21주기 EMA를 뚫을 때, 구매 신호를 생성한다. 8주기 EMA 아래에서 21주기 EMA를 뚫을 때, 판매 신호를 생성한다.
트렌드 필터: 55주기 EMA를 트렌드 필터로 사용한다. 가격이 55주기 EMA 위에 있을 때만 멀티 헤드 거래를 실행한다. 그 반대의 경우도 마찬가지이다.
VWAP 확인: 구매 신호 요청 가격은 VWAP 위에 있고, 판매 신호 요청 가격은 VWAP 아래에 있습니다. 이것은 거래 방향과 큰 자본의 흐름이 일치하도록 돕습니다.
리스크 관리: 전략은 0.5%의 고정 비율의 중지 손실과 1.5%의 고정 비율의 중지 절감을 사용하여 거래 당 위험을 제어합니다.
일간 거래: 모든 포지션은 매 거래일 종료 전에 청산하여, 밤새의 위험을 피한다.
전략적 이점
다중 확인 메커니즘: 단기, 중기 및 장기 EMA와 VWAP를 결합하여 거래 신호의 신뢰성을 향상시킵니다.
트렌드 추적: 55주기 EMA의 트렌드 필터링을 통해 거래 방향이 주 트렌드와 일치하는지 확인하십시오.
위험 제어: 고정 비율의 중지 및 중지 설정으로 거래 당 위험을 효과적으로 제어한다.
유연성: 전략의 매개 변수는 다른 시장과 거래 유형에 따라 조정할 수 있습니다.
하루 거래: 하룻밤 동안 포지션 위험을 피하고, 위험 감수성이 낮은 거래자에게 적합하다.
전략적 위험
빈번한 거래: EMA 교차는 과도한 거래로 인해 수수료 비용이 증가할 수 있습니다.
지연성: EMA는 본질적으로 지연 지표이며, 급격히 변동하는 시장에서 지연 신호를 일으킬 수 있다.
가짜 브레이크: 상반기 시장에서 빈번한 가짜 브레이크 신호가 발생할 수 있습니다.
고정된 스톱: 높은 변동성 시장에서 고정된 퍼센티지 스톱은 조기에 유발될 수 있다.
역사적 데이터에 의존: 전략 효과는 과도한 적합성에 영향을 받을 수 있으며, 미래 시장에서 재검토 결과보다 좋지 않을 수 있다.
전략 최적화 방향
동적 파라미터: 시장의 변동성 동적에 따라 조정 EMA 주기 및 VWAP 계산 주기 고려할 수 있다.
필터를 추가: RSI 또는 MACD와 같은 다른 기술 지표를 추가 필터링 조건으로 도입하여 가짜 신호를 줄여줍니다.
자율적 스톱: 시장의 변동적 동력에 따라 스톱 폭을 조정합니다. 예를 들어 ATR을 사용하여 스톱을 설정합니다.
거래 시간 필터: 거래 시작과 종료 전의 높은 변동성을 피하는 것이 전략의 안정성을 높이는 데 도움이 될 수 있습니다.
기본 요소를 추가: 중요한 경제 데이터 발표 또는 회사 실적과 같은 이벤트와 결합하여 거래 결정을 최적화하십시오.
요약하다
이 다주기 EMA는 VWAP의 높은 승률의 일일 거래 전략을 결합하여 여러 기술 지표와 엄격한 위험 관리를 결합하여 일일 트렌딩 기회를 잡기 위해 고안되었습니다. 전략의 핵심 장점은 여러 확인 메커니즘과 엄격한 위험 통제입니다. 그러나 과다 거래 및 신호 지연과 같은 도전에 직면합니다.
/*backtest
start: 2024-08-01 00:00:00
end: 2024-08-31 23:59:59
period: 1d
basePeriod: 1d
exchanges: [{"eid":"Futures_Binance","currency":"BTC_USDT"}]
*/

//@version=5
strategy("High Win Rate EMA VWAP Strategy with Alerts", overlay=true, default_qty_type=strategy.fixed, default_qty_value=1)

// Inputs
emaShort = input.int(8, title="Short-term EMA", minval=1)
emaLong = input.int(21, title="Long-term EMA", minval=1)
emaTrend = input.int(55, title="Trend EMA", minval=1)
stopLossPerc = input.float(0.5, title="Stop Loss Percentage", minval=0.1, step=0.1)
takeProfitPerc = input.float(1.5, title="Take Profit Percentage", minval=0.1, step=0.1)

// Calculate EMAs and VWAP
shortEMA = ta.ema(close, emaShort)
longEMA = ta.ema(close, emaLong)
trendEMA = ta.ema(close, emaTrend)
vwap = ta.vwap(close)

// Trend Filter: Only trade in the direction of the trend
isBullishTrend = close > trendEMA
isBearishTrend = close < trendEMA

// Generate Buy and Sell Signals with Trend Confirmation
buySignal = ta.crossover(shortEMA, longEMA) and close > vwap and isBullishTrend
sellSignal = ta.crossunder(shortEMA, longEMA) and close < vwap and isBearishTrend

// Strategy Execution
if (buySignal and strategy.opentrades == 0)
    strategy.entry("Buy", strategy.long, qty=1)

if (sellSignal and strategy.opentrades == 0)
    strategy.entry("Sell", strategy.short, qty=1)

// Stop Loss and Take Profit (Signal-Based)
if (strategy.position_size > 0)  // Long position
    strategy.exit("Take Profit/Stop Loss Long", from_entry="Buy", stop=strategy.position_avg_price * (1 - stopLossPerc / 100), limit=strategy.position_avg_price * (1 + takeProfitPerc / 100))

if (strategy.position_size < 0)  // Short position
    strategy.exit("Take Profit/Stop Loss Short", from_entry="Sell", stop=strategy.position_avg_price * (1 + stopLossPerc / 100), limit=strategy.position_avg_price * (1 - takeProfitPerc / 100))

// Close All Trades at End of Day
if (hour == 15 and minute == 59)  // Adjust this time according to your market's closing time
    strategy.close("Buy")
    strategy.close("Sell")

// Plot Buy/Sell Signals on the chart
plotshape(series=buySignal, title="Buy Signal", location=location.belowbar, color=color.green, style=shape.labelup, text="BUY")
plotshape(series=sellSignal, title="Sell Signal", location=location.abovebar, color=color.red, style=shape.labeldown, text="SELL")

// Plot the EMAs and VWAP
plot(shortEMA, color=color.blue, title="Short-term EMA")
plot(longEMA, color=color.orange, title="Long-term EMA")
plot(trendEMA, color=color.green, title="Trend EMA")
plot(vwap, color=color.purple, title="VWAP", linewidth=2)

// Alert Conditions
alertcondition(buySignal, title="Buy Alert", message="Buy Signal Triggered")
alertcondition(sellSignal, title="Sell Alert", message="Sell Signal Triggered")