Titik Pivot Supertrend
Penulis:ChaoZhang, Tarikh: 2022-05-17 15:45:37Tag:PivotATR
Halo semua,
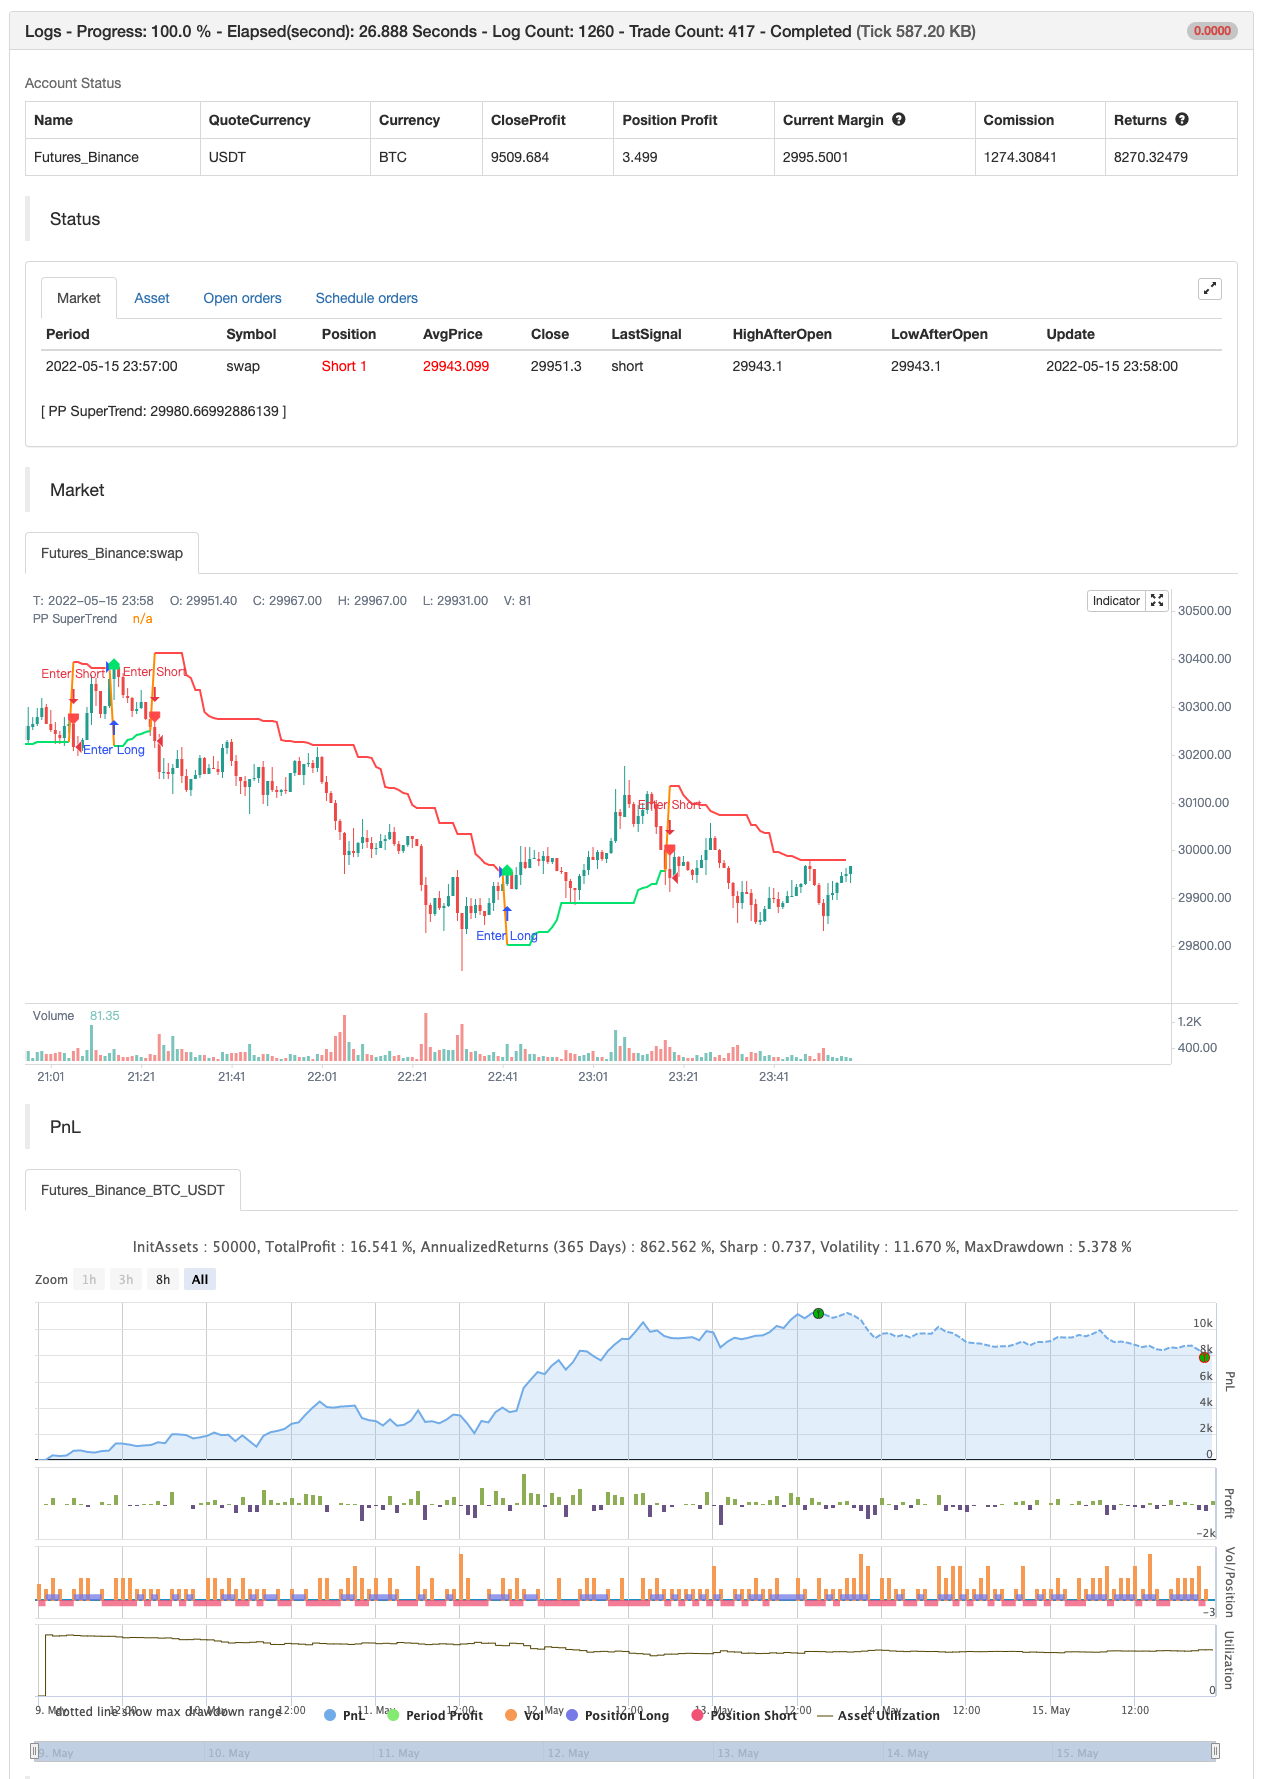
Terdapat banyak jenis SuperTrend di sekitar. baru-baru ini saya berfikir tentang Supertrend berdasarkan Pivot Points kemudian saya menulis skrip
Idea di sebalik skrip ini adalah mencari titik pivot, mengira purata mereka dan seperti dalam supertrend mewujudkan band yang lebih tinggi / lebih rendah oleh ATR. Seperti yang anda lihat dalam algoritma skrip memberikan berat kepada titik pivot masa lalu, ini dilakukan untuk meluruskannya sedikit.
Ujian belakang

/*backtest
start: 2022-05-09 00:00:00
end: 2022-05-15 23:59:00
period: 1m
basePeriod: 1m
exchanges: [{"eid":"Futures_Binance","currency":"BTC_USDT"}]
*/

// This source code is subject to the terms of the Mozilla Public License 2.0 at https://mozilla.org/MPL/2.0/
// © LonesomeTheBlue

//@version=4
study("Pivot Point SuperTrend", overlay = true)
prd = input(defval = 3, title="Pivot Point Period", minval = 1, maxval = 50)
Factor=input(defval = 2, title = "ATR Factor", minval = 1, step = 0.1)
Pd=input(defval = 6, title = "ATR Period", minval=1)
showpivot = input(defval = false, title="Show Pivot Points")
showlabel = input(defval = true, title="Show Buy/Sell Labels")
showcl = input(defval = false, title="Show PP Center Line")
showsr = input(defval = false, title="Show Support/Resistance")

// get Pivot High/Low
float ph = pivothigh(prd, prd)
float pl = pivotlow(prd, prd)

// drawl Pivot Points if "showpivot" is enabled
plotshape(ph and showpivot, text="H",  style=shape.labeldown, color=na, textcolor=color.red, location=location.abovebar, transp=0, offset = -prd)
plotshape(pl and showpivot, text="L",  style=shape.labeldown, color=na, textcolor=color.lime, location=location.belowbar, transp=0, offset = -prd)

// calculate the Center line using pivot points
var float center = na
float lastpp = ph ? ph : pl ? pl : na
if lastpp
    if na(center)
        center := lastpp
    else
        //weighted calculation
        center := (center * 2 + lastpp) / 3

// upper/lower bands calculation
Up = center - (Factor * atr(Pd))
Dn = center + (Factor * atr(Pd))

// get the trend
float TUp = na
float TDown = na
Trend = 0
TUp := close[1] > TUp[1] ? max(Up, TUp[1]) : Up
TDown := close[1] < TDown[1] ? min(Dn, TDown[1]) : Dn
Trend := close > TDown[1] ? 1: close < TUp[1]? -1: nz(Trend[1], 1)
Trailingsl = Trend == 1 ? TUp : TDown

// plot the trend
linecolor = Trend == 1 and nz(Trend[1]) == 1 ? color.lime : Trend == -1 and nz(Trend[1]) == -1 ? color.red : na
plot(Trailingsl, color = linecolor ,  linewidth = 2, title = "PP SuperTrend")

plot(showcl ? center : na, color = showcl ? center < hl2 ? color.blue : color.red : na)

// check and plot the signals
bsignal = Trend == 1 and Trend[1] == -1
ssignal = Trend == -1 and Trend[1] == 1
plotshape(bsignal and showlabel ? Trailingsl : na, title="Buy", text="Buy", location = location.absolute, style = shape.labelup, size = size.tiny, color = color.lime, textcolor = color.black, transp = 0)
plotshape(ssignal and showlabel ? Trailingsl : na, title="Sell", text="Sell", location = location.absolute, style = shape.labeldown, size = size.tiny, color = color.red, textcolor = color.white, transp = 0)

//get S/R levels using Pivot Points
float resistance = na
float support = na
support := pl ? pl : support[1]
resistance := ph ? ph : resistance[1]

// if enabled then show S/R levels
plot(showsr and support ? support : na, color = showsr and support ? color.lime : na, style = plot.style_circles, offset = -prd)
plot(showsr and resistance ? resistance : na, color = showsr and resistance ? color.red : na, style = plot.style_circles, offset = -prd)

// alerts
alertcondition(Trend == 1 and Trend[1] == -1, title='Buy Signal', message='Buy Signal')
alertcondition(Trend == -1 and Trend[1] == 1, title='Sell Signal', message='Sell Signal')
alertcondition(change(Trend), title='Trend Changed', message='Trend Changed')


if Trend == 1 and Trend[1] == -1
    strategy.entry("Enter Long", strategy.long)
else if Trend == -1 and Trend[1] == 1
    strategy.entry("Enter Short", strategy.short)
Kandungan berkaitan
- Axis sokongan dan rintangan dinamik untuk menyesuaikan strategi perdagangan kuantitatif
- Villa Dinamic Pivot Supertrend Strategi
- Strategi perdagangan dalam julat turun naik berdasarkan penunjuk turun naik rawak
- Strategi Pengesanan Tren Dinamik
- Strategi pilihan dinamik dan pengurusan kedudukan berdasarkan kadar turun naik
- SUPERTREND Strategi Stop Loss Multi-head Trend Tracker
- Perkembangan Fibonacci Dengan Jurang
- MillMachine
- Keluar Chandelier
- HalfTrend lebih kosong trend mengesan strategi pembelian harga henti rugi
Lebih lanjut
- Rasio Tenaga Arah RedK Volume-Pengcepat
- Donchian Breakout tiada cat semula
- Bar Momentum RedK
- SuperJump Turn Back Bollinger Band
- Trend Fukuiz
- BOT Johny
- SSL Hibrid
- Keluar Chandelier
- Risotto
- EMA Cloud Intraday Strategi
- Supertrend+4 bergerak
- ZigZag berasaskan momentum
- VuManChu Cipher B + Strategi Perbezaan
- Konsep Dual SuperTrend
- Super Scalper
- Ujian belakang- Penunjuk
- Trendycious
- Pembunuh Sma BTC
- Templat amaran ML
- Perkembangan Fibonacci Dengan Jurang